Examination
Effective dose (μSν)
Equivalent background exposure (days)
Intraoral
Rectangular collimation
Posterior bitewings: PSP or F- speed film
5
0.6
Full-mouth: PSP or F-speed film
35
4
Full-mouth: CCD sensor (estimated)
17
2
Round collimation
Full-mouth: D-speed film
388
46
Full-mouth: PSP or F-speed film
171
20
Full-mouth: CCD sensor (estimated)
85
10
Extraoral
Panoramic
9–24
1–3
Cephalometric
2–6
0.3–0.7
Cone-beam CT
Large field of view
68–1073
8–126
Medium field of view
45–860
5–101
Small field of view
19–652
2–77
Multi-slice CT
Head: conventional protocol
860–1500
101–177
Head: low-dose protocol
180–534
21–63
Abdomen
5300
624
Chest
5800
682
Plain films
Skull
70
8
Chest
20
2
Barium enema
7200
847
2.2 Normal Radiographic Anatomy (Fig. 2.1)
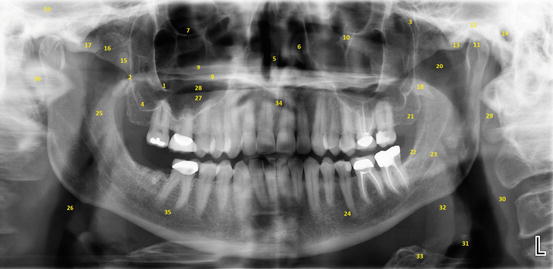
Fig. 2.1
Panoramic radiograph showing normal anatomical structures. Use the numbers in the radiograph to correspond to the key
Key: 1 zygomatic process of the maxilla, 2 posterior wall of the maxillary sinus, 3 pterygomaxillary fissure, 4 floor of the maxillary sinus, 5 nasal septum, 6 inferior nasal concha, 7 inferior orbital rim, 8 hard palate, 9 ghost image of opposite hard palate, 10 infraorbital canal, 11 mandibular condyle, 12 glenoid fossa, 13 articular eminence, 14 external auditory meatus, 15 coronoid process of the mandible, 16 zygomatico-temporal suture, 17 zygomatic arch, 18 pterygoid plate, 19 middle cranial fossa, 20 sigmoid notch, 21 maxillary tuberosity, 22 external oblique ridge, 23 mandibular canal, 24 mental foramen, 25 soft palate, 26 pharyngeal airway, 27 dorsal surface of tongue, 28 palatoglossal airway, 29 styloid process, 30 posterior pharyngeal wall, 31 epiglottis, 32 base of tongue, 33 hyoid bone, 34 intervertebral disk space between C1 and C2, 35 submandibular salivary gland fossa, 36 anterior arch of C1
2.3 Radiographic Interpretation (Fig. 2.2)
Fig 2.2
Radiographic image analysis algorithm representing the diagnostic process
Considerations when a lesion is noted on a radiograph:
-
Location: in relation to teeth, inferior alveolar canal; localized vs. generalized, unilateral vs. bilateral, single vs. multifocal
-
Shape: regular vs. irregular, hydraulic
-
Size: extension
-
Periphery: well-defined, moderately well-defined or poorly defined
-
Corticated vs. noncorticated
-
-
Internal structure: radiolucent, mixed, radiopaque, unilocular vs. multilocular
-
See table 2.2 for characteristic radiographic features of common disease categories effect on surrounding structures: root resorption/displacement, cortical bone expansion/resorption, inferior alveolar nerve (IAN) canal, maxillary sinus floorTable 2.2Radiographic features of lesions by categoriesLocationShapePeripheryInternal structureEffect on adjacent rootsEffects on adjacent boneCystsOdontogenic: teeth-bearing areas. Dentigerous: around crown. Radicular: periapical or lateral. Lateral periodontal: lateral to root

Stay updated, free dental videos. Join our Telegram channel

VIDEdental - Online dental courses

 Get VIDEdental app for watching clinical videos
