Fig. 2.1
Bone quality includes bone size, shape and bone microarchitecture
The commonest system used to classify a patient’s quality of bone at the implant site is that proposed by Lekholm and Zarb (1985). This classification of bone is divided into four groups:
-
Type 1 – mostly dense cortical bone
-
Type 2 – a thick cortical layer surrounds dense cancellous bone
-
Type 3 – a thin cortical layer surrounds dense cancellous bone
-
Type 4 – a thin cortical layer surrounds cancellous bone of low density
A sufficient amount and density of host bone is essential to implant success, which is reduced if there is a lack of stability at insertion. There is a general consensus that a minimum width of 5 mm of alveolar bone is essential for long-term implant success, with narrow ridges requiring augmentation. All commercially available implant systems have an impressive success rate exceeding 85 % after 5-year follow-up (Lekholm 1992), and selection of patients with adequate bone volume, density and architecture is critically important in determining success. Finite element analysis has shown that bone-implant strain increased with decreasing bone quality (Lin et al. 2008). However, this may not be clinically important to implant survival given the excellent implant success rate (97 % in the maxillae and 97.3 % in the mandible) achieved in patients with osteoporosis of either the hip or spine, or both (Friberg et al. 2001), assuming that the jaw bone density was also reduced in these patients. Earlier studies have shown that implant failure was related to their placement in low-density bone (especially in the maxilla) (Friberg et al. 1991), but recent improvements in implant surfaces may improve the chances of osseointegration in poor-quality bone and prevent their failure.
Figure 2.2a illustrates a dental panoramic tomogram of a 45-year-old female patient with generalised chronic periodontal disease and periapical radiolucencies affecting some of the lower teeth. Over a period of 10 years, she suffered failure of her implants and lost more teeth. This was followed by severe residual ridge resorption (Fig. 2.2b).
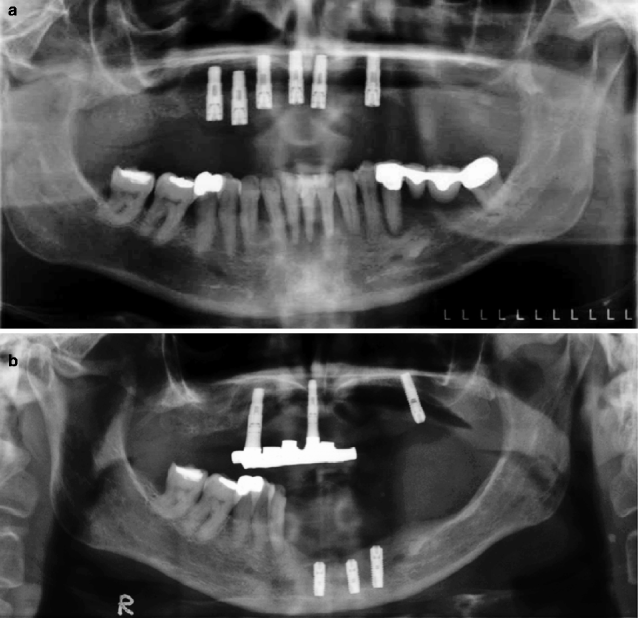
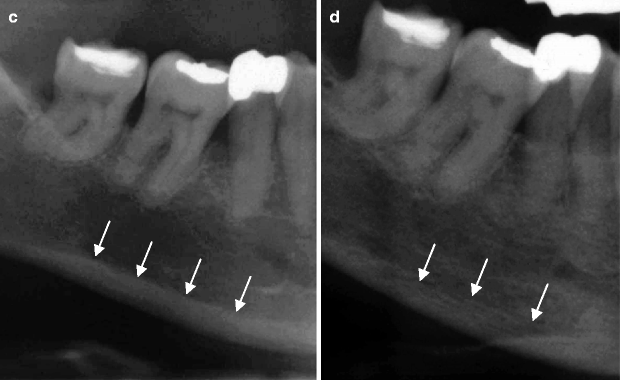
Fig. 2.2
(a) The dental panoramic tomogram of a patient who then underwent extensive implant therapy over the next 10 years. (b) The patient had severe residual ridge resorption following tooth extraction and loss of implants. (c) The superior border of the mandibular cortex appears even and unresorbed at age 45 years. (d) At age 55 years, the mandibular cortical bone has become porous and thinned. The superior cortical border is uneven. One cannot conclude that the osteoporotic bone changes are causing the implant loss and the residual ridge resorption, but they may be important
In Fig. 2.2c, the lower mandibular cortical border from a patient aged 45 years appears to have a smooth superior border (see arrows), whereas the cortical border of the later image when the patient was aged 55 years appears irregular and porous (Fig. 2.2d). The thinning and increasing porosity of the lower cortical border has been described as a sign of systemic bone loss in postmenopausal osteoporosis. Whether the reduced mandibular bone density played any causative role in the loss of this patient’s implants and teeth is unknown. This is because there are a large number of other potentially important variables that can influence tooth loss, e.g. oral hygiene and medical history of the patient.
2.2.1 Bone Quality, Gender and Age
Roberts et al. (2011) showed that women undergo little change in mandibular cortical width until the age of about 42 years, after which the cortex starts to thin at an increasingly faster (quadratic) rate. The mean smoothed mandibular cortical width in their sample was shown to be higher for adult men than women, but this is not reflected in any major difference in the failure rates of implants between genders. In a study by Jang et al. (2011), they placed 6,385 implants in 3,755 patients, but the sample had 3,120 males and a much smaller number of females, 635. Data from their figures suggested that older women had a poorer implant survival after 80 months, but there was no statistically significant effect of gender. The effect of gender was also analysed in a study of implant survival in bone grafts used for the treatment of severe alveolar ridge resorption (Schliephake et al. 1997). There was a high failure rate in older women, aged 51–60 years, who were reconstructed with an iliac crest onlay and simultaneous placement of endosseous implants. The iliac crest graft and recipient site may have been of poor quality, given the decline in bone density that occurs following the menopause. Advanced age has been shown to increase implant failure risk, but this may relate to the decline in jaw bone density which occurs with age. In a study by Moy et al. (2005), their 60–79 age group had a significantly higher risk of implant failure (RR = 2.24; P < 0.05), but this age effect was not significant at older ages (>79 years) perhaps due to a reduced sample size in this group.
Bone volume and density are two of the most important factors that determine the duration of healing before implants can be loaded. The original Brǻnemark protocol recommended a two-staged approach with placement of the implants in bone and subsequent surgical exposure after 3 months in the mandible and 6 months in the maxilla. The difference in the time of implant submergence relates to the fine trabecular bone and thin cortical structure of the maxilla compared to the mandible. Despite this, the failure rate of maxillary implants tends to be higher than in the mandible. Weng et al. (2003) in a prospective, multicentre study found that 33 % of failures were associated with machined surface implants placed in the posterior maxilla, with a success rate of only 80.6 %. Multiple factors can combine to reduce the success rate of implants in this region, such as a higher occlusal loading, a reduced volume of available bone and a reduced bone density. Overall, their implant success rate was 91.1 %, which is comparable to most other implant studies. Buser et al. (1991) later showed that 96.2 % of one-stage, non-submerged ITI implants (International Team for Oral Implantology, Institut Straumann AG, Waldenburg, Switzerland) osseointegrated successfully after a follow-up period of 3 years. This study confirmed that non-submerged implants had an excellent success rate when placed in good-quality bone.
Immediate loading of implants placed in the mandible had a 98.4 % success rate in a retrospective study by Kacer et al. (2010). They recommended that immediate loading be considered in the mandible where primary stability of the implant was greater than 35 N-cm. In a 5-year retrospective study, Malo et al. (2011) placed 995 immediately loaded implants in 221 edentulous patients and found that females lost more implants than males.
Implants have been also shown to have a better survival if placed in native maxillary bone than if augmented bone is used (Lambert et al. 2009). This relates to the lack of primary implant stability at insertion. With reduced bone quality or poor surgical technique, a two-stage surgical approach has a better prognosis than immediately loading the implant (Esposito et al. 2009). Precise drilling of the bone to the correct diameter for the implant is required; otherwise, good primary stability is not possible.
2.2.2 Imaging Modalities Available to Assess Bone Quality
Newer techniques such as microcomputed tomography may allow assessment of bone structure but are still at the experimental stage. Techniques such as dual energy X-ray absorptiometry can measure mandibular bone density (Devlin and Horner 2007), but assessing bone quality requires analysis of bone architecture. In one preliminary study, the trabecular bone volume and implant stability (measured using resonance frequency analysis) were not significantly correlated, but this may be due to the small sample size (23 implant sites of 10 patients).
Conventional dental panoramic tomograms are often used to assess the likelihood of damage of anatomical structures adjacent to the path of the implant placement and the height of the available bone. Magnification and distortion of the image may occur, which introduces an element of inaccuracy in treatment planning. Cone beam computed tomography (CBCT) provides an opportunity for 3D viewing of the jaws with no image magnification and therefore is most useful in diagnosis and treatment planning.
Much of the literature surrounding CBCT has shown good accuracy and repeatability of measurements in laboratory settings. However, these results are not directly applicable to the clinical situation where minor patient movement can produce inaccuracy. With many potential clinical applications of CBCT, its value needs to be assessed against whether it improves the quality of treatment outcome for most patients. CBCT is certainly useful in those situations requiring cross-sectional imaging, e.g. where there is some doubt about the position of the inferior alveolar nerve or the shape of the residual alveolar ridge.
There is considerable controversy as to whether CBCT bone radiodensity values (as measured by Hounsfield units) are correlated with other measurements of bone density. Fuster-Torres et al. (2011) found a significant correlation between CBCT-derived bone density values and insertion torque measurements for implant sites in the anterior mandible. Others have reported similar correlations between implant torque resistance and radiographic density evaluation using CBCT (Lee et al. 2007) or computed tomography Hounsfield units (Turkyilmaz et al. 2006). However, a major source of error in assessing jaw bone density arises from the variation in the amount of fat between the bone trabeculae at different jaw sites. Hounsfield units (HU) use the radiodensity of water as the zero on the scale, and a typical value for cancellous bone radiodensity is 700 HU, air is −1,000 HU and fat is −50 to −100 HU. If the jaw has a high fat content, the reading in HU will be reduced and therefore will not provide a true representation of the bone content. Similarly, there has been variation in intensity values reported in CBCT images which is dependent on the particular device, the precise imaging parameters and the positioning of the field of view (Nackaerts et al. 2011).
CBCT may be useful in assessing the cross-sectional shape of the residual ridge prior to implant placement and in other situations where clinical doubt exists as to the position of the maxillary sinus and important neurovascular structures. Haemorrhage involving the floor of the mouth is particularly serious where it can compromise the airway.
The CBCT data can also be used to construct templates that are employed to guide implant placement.
2.3 Surgical Planning
Radiopaque surgical guides (Fig. 2.3) allow the surgeon to plan the position of the crown or denture teeth (Ewers et al. 2010) and then use that information in the surgery to align the implant drills to the axis of the crown. The implant positions are planned using proprietary software, taking into account the crown position and occlusal load. Surgical guides can then be constructed using different rapid prototyping methodologies (e.g. stereolithography).
Fig. 2.3
A radiopaque guide allows the dentist to visualise the implant and its relation to vital structures when planning implant placement
Surgical guides can be constructed that are bone, mucosa or tooth supported. Simulated surgery can be performed on the stereolithographic models with positioning of the implant directed by the surgical guide. This is followed by placement of the abutment on the model with construction of a provisional crown. Placing implants in the patient follows the same sequence, i.e. using the surgical guide to prepare the bone site for the implants, with placement of the abutment and provisional crown (Kamposiora et al. 2012). Other recent developments include virtual combining (or registering) optical impressions of the dentition, using CEREC scanning, with CBCT data (Ritter et al. 2012). This method avoids the radiation exposure to the patient that arises from them having to wear a template during a separate CBCT scanning procedure and is highly accurate.
The patient illustrated in Fig. 2.4 has missing upper central incisors and requested implant-borne replacements. A series of cone beam CT images of the anterior maxilla in coronal (Fig. 2.4a), sagittal (Fig. 2.4b) and axial views (Fig. 2.4c) illustrates the radiopaque surgical guide in situ. The bottom right part of the figure (Fig. 2.4d) shows a volume-rendered image. A denture was constructed for the patient, taking care that she was satisfied with the tooth position, and this was duplicated to produce a radiopaque acrylic surgical stent. There has been some bone loss of the anterior residual ridge.
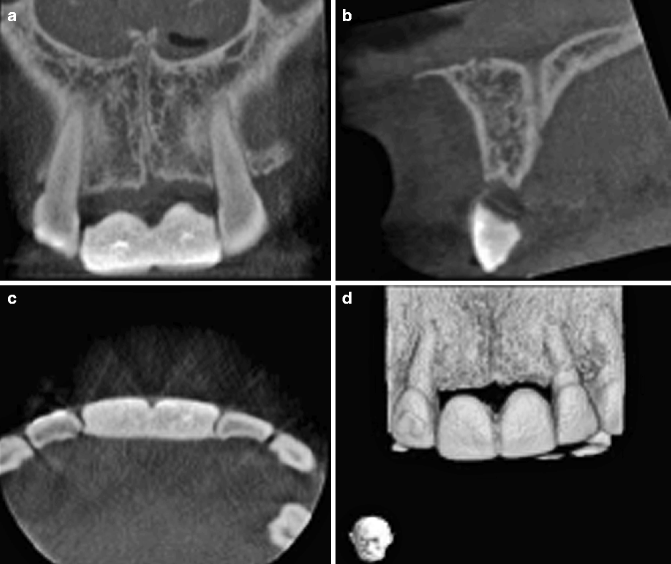
Fig. 2.4
The cone beam CT image of the implant site taken with a radiopaque stent in place (a) Coronal, (b) sagittal, and (c) axial views. (d) Volume-rendered image
2.3.1 Devices Used for Measuring Implant Stability
Dental implant stability can be assessed by two commercially available techniques: resonance frequency analysis (RFA, manufactured by Osstell ISQ) and damping capacity assessment (Periotest, manufactured by Medizintechnik Gulden, Germany). In the Periotest, a rod taps the implant over a few seconds, and the time during which the rod and implant are in contact is measured and converted into Periotest stability values. Zix et al. (2008) found that the Periotest was less precise and less reproducible than the Osstell device. Both techniques gave values which were correlated with the implant diameter, but it is not clear if this is because wider implants are more stable. Using resonance frequency analysis, Ohta et al. (2010) found no correlation between stability values recorded and implant diameter, using implants placed in pig cortical bone.
There is no gold standard method of assessing implant stability. The force needed to insert an implant (insertion torque) has been used, but to measure insertion torque precisely, dedicated devices are required. Degidi et al. (2010) found that there was no significant correlation between RFA values and insertion torque, signifying that they are measuring different bone parameters. In addition, surgeons underestimated implant stability as measured by RFA, which would indicate that an objective measure of implant stability is required if immediate loading is planned.
Ultrasound devices are used to determine bone density (Kaufman et al. 2007). Other authors (Mathieu et al. 2011) have investigated the use of quantitative ultrasound for the detection of implant stability and found that the method could detect an alteration of 1 mm in the contact length of bone and implant.
Figure 2.5 illustrates the placement of a right mandibular implant that lacked primary stability. The surgeon removed this implant and placed a second implant adjacent to the first. The mandible was weakened and subsequently fractured, which necessitated mandibular plating (Fig. 2.6). This unfortunate set of circumstances may have been avoided if the surgeon had been able to preoperatively assess the bone density of the operative site.
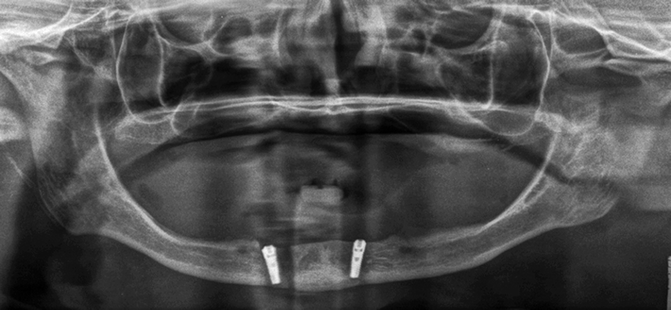
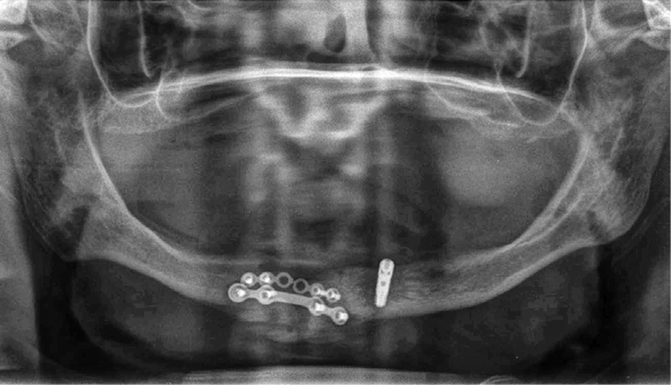
Fig. 2.5
The implant placed in the right anterior mandible lacked primary stability∎
Fig. 2.6
The dentist removed the loose right implant seen in Fig. 2.5, and drilled another bony region adjacent to the first implant recipient site. The mandible subsequently fractured and was plated
2.3.2 Optimal Size of Implants
Mathematical models have shown that an implant diameter of less than 3 mm is insufficient for sustained clinical success (Ojeda et al. 2011). The use of short implants of 10 mm length or less is controversial, but studies generally report failure rates comparable to that of normal length implants. If short implants are used, the likelihood of nerve damage or other morbidity is reduced and costs are less, but despite this, the use of normal length implants with bone grafting techniques is preferred by some clinicians. These clinicians point to the insufficient follow-up period of short implants in mostly retrospective studies (less than 5 years), the small numbers of study participants and the lack of information on potentially confounding clinical variables, e.g. bone quality. Despite this, the success of short implants may be due to recent improvements in their roughened surface design, combined with good primary stability at insertion (Annibali et al. 2012).
If a short implant (<10 mm in length) achieves osseointegration, there is evidence that it will be functional. A systematic review endorsed the use of 9.5-mm-long dental implants with an estimated survival rate of 98.6 % (95 % CI: 94.6–100 %) after 2 years (Telleman et al. 2011). Many clinicians use the maximum implant length that can be achieved, based on laboratory tests and finite element analysis that have shown reduced stresses with longer implants. However, the stresses at the bone-implant interface have not been verified clinically or even what is an acceptable amount of stress at this point during function.
Stay updated, free dental videos. Join our Telegram channel
VIDEdental - Online dental courses


