Imaging Procedures
Imaging procedures are almost never useful as primary tools for diagnosing functional disturbances. While they do provide some information about the form and position of structures, only a very few techniques can disclose any information about function. The occurrence of symptoms depends primarily upon function and the capacity for adaptation. In this regard, one must give special attention to the functional adaptability of the nonbony structural components of the joint. With the exception of MRI, imaging procedures cannot reveal evidence of adaptation in the bilaminar zone, the fibrocartilaginous articular surfaces, or the disk.
In the field of dentistry today there are two general indications for the use of imaging procedures: exclusion of primary diseases of the joint and visualization and documentation of adaptations. These requirements are usually satisfied by the MRI, panoramic radiograph, or long-cone extraoral radiograph.
There are a wide variety of techniques available for making images of the temporomandibular joint (Christiansen and Thompson 1990, Westesson and Katzberg 1991, Katzberg and Westesson 1993, Heffez 1995, McCain 1996). The reasons for such a large number of techniques are:
• The fossa and the condyle exhibit great biological variations.
• Techniques that reproduce bone structure well are frequently poorly suited for imaging soft tissues, and vice versa.
• Images of nearby bony structures can be superimposed to varying degrees on those of the joints.
• The alignment of the condyle in three-dimensional space can lead to a distorted picture of its relationship to the fossa, thus the angle of the radiation beam must some times be individualized.
Examination of the temporomandibular joint through imaging procedures is further complicated by the combination of medical and legal considerations, plus an incomplete understanding of exactly what diagnostic procedures are relevant to treatment planning. From a purely medical standpoint, the indications for imaging procedures are simply to separate primary joint diseases from functional problems, to identify adaptations, and to describe the positional relationships between disk and condyle.
All other indications are of a mostly legal nature and their value should be carefully weighed against the added radiation exposure they entail.
It is a long-recognized and undisputed fact that tomograms, for example, allow bone of the condyle and the temporal portions of the joint to be viewed in better detail. What is frequently overlooked, however, is that the detailed changes seen have no affect on the treatment. The section on testing of the joint surfaces (p. 680f) thoroughly explains how almost all functional problems of the joint surfaces can be diagnosed clinically. If detailed imaging shows a deviation from normal but there are no symptoms, no treatment is indicated. If there are clinical symptoms of a joint surface problem and the radiological findings confirm this, still the radiographs will have no influence on the treatment. For these reasons, one should be extremely reluctant to declare the need for transcranial eccentric radiographs, tomograms, transmaxillary and transpharyngeal radiographs, or so-called temporomandibular joint programs with panoramic machines.
This chapter contains information about the different imaging procedures, their advantages and disadvantages as well as their indications. The section on MRI is discussed more thoroughly, as this procedure is assuming a growing role in the diagnosis of temporomandibular joint disorders. Nevertheless, practical articles on this theme appearing in the literature are frequently all too brief.
Panoramic Radiographs
Panoramic radiograph machines have become quite common in dental offices (Friedland 1998. Whaites and Brown 1998) and the radiographs made with them are offered as a routine procedure.
Modern machines deliver a radiation dose of approximately 20 mGy (milligrays: 1 gray = 100 rad) to the skin’s surface (Goldstein 1998). The dose to the salivary glands varies from 0.7 to 4.17 mGy, and the thyroid gland receives 0.03-0.370 mCy (Nilsson et al. 1985, Underbill et al. 1988). With digital equipment (McDavid et al. 1995) the exposure can be reduced by about 43% with no loss of quality in the detection of radiolucent abnormalities (Dula et al. 1998).
An accurate evaluation of carious lesions is possible only to a limited extent. The combination of a panoramic radiograph with bite-wing radiographs, however, does provide reliable caries detection and does not necessarily require additional periapical films (Richardson 1997, Flint 1998).
A panoramic radiograph has a magnification factor of 7-27% (Updegrave 1966, Manson-Hing 1971, Akesson et al. 1992).
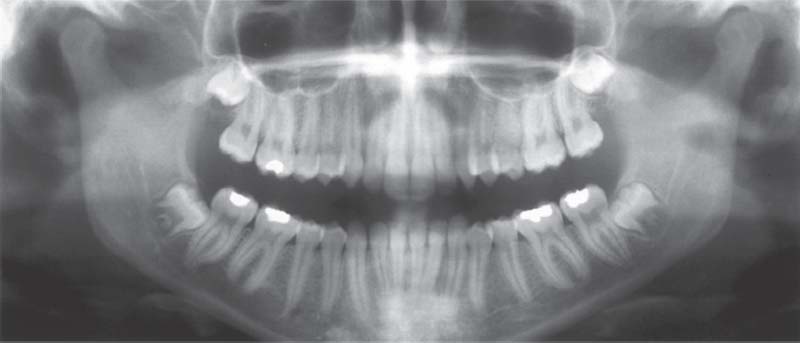
365 Physiological joints
As part of the functional diagnostics the panoramic radiograph is the method of choice for
• Confirmation of presumed de generative bone changes.
• Diagnosis of unsuspected pathology.
• Classification of the stage of a disease process.
• Evaluation of the effectiveness of therapeutic measures (Kaplan 1991).
The condyles can be evaluated well provided the radiograph was not made with the teeth in habitual occlusion.
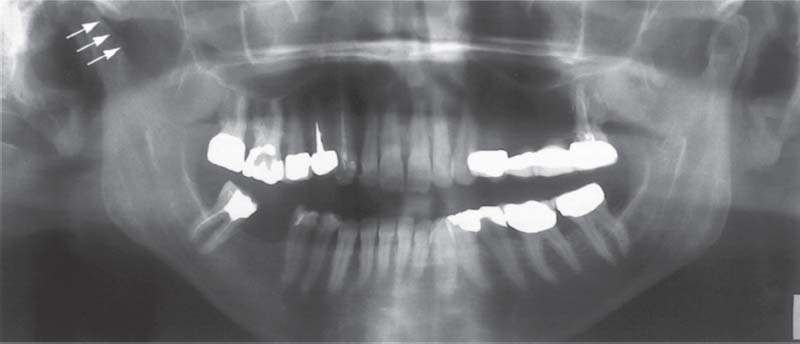
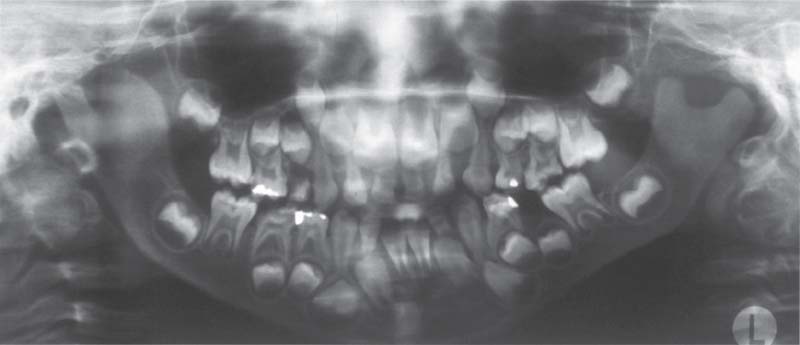
366 Degenerative changes in the right joint
The most common finding in a degenerating temporomandibular joint is a change (regressive adaptation) of the condylar bone that is accompanied by a more or less pronounced flattening of the contour (arrows). In spite of the altered bony structure, the fibrocartilaginous joint surface may be completely adapted. In that case the joint Is functionally intact and in no need of treatment. If the joint surfaces are not well adapted there will be a clinically detectable crepitus.
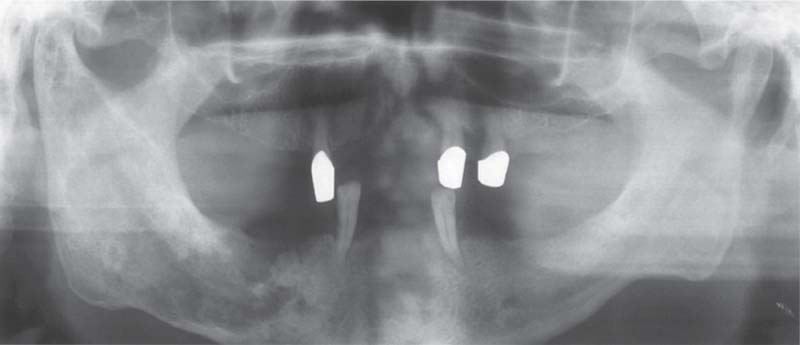
367 Osteomyelitis in the mandible and in the right temporomandibular joint
Osteomyelitis in the mandible extending all the way to the condyle can mimic the clinical symptoms of a temporomandibular joint problem. The symptoms, however, cannot be reproduced by the joint-play test. In the radiograph the trabecular “cloudy” appearance on the right side than on the left. Osteomyelitis of the mandible is frequently accompanied by anesthesia of the lower lip. The differential diagnosis must rule out a metastasis (Glaser etal. 1997).
The panoramic radiograph of the temporomandibular joint serves only to reveal advanced degenerative changes of the condyle and primary joint problems such as fractures, joint involvements with syndromes, tumors, cysts, osteomyelitis, hyperplasias, hypoplasias, and aplasias (Dixon 1995, Wilson 1996, Greenan 1997, DelBalso 1998). Considering these indications, the panoramic radiograph is the only radiograph necessary for many patients (Brooks et al. 1997).
To minimize superimposed images of the condyle and bony fossa, the exposure should not be made with the teeth in habitual occlusion. Firm judgements about bony changes in the condyle can be made only for Chose occurring in the lateral and central portions (Hollender 1994).
Findings from panoramic radiographs agree with those from tomograms in 60-70% of joints (Bezuur et al. 1989, Ludlow et al. 1995). In many cases, however, the appearance in a radiograph does not reflect the functional condition of the joint surfaces (Pullinger et al. 1990) nor is it necessarily associated with clinical symptoms (Pereira et al. 1994b). The actual contour of the cartilage agrees with the bone contour seen in the radiograph in only 14% of joints (Pullinger 1993). In addition, pronounced radiographic changes were found in the temporomandibular joints of up to 90% of asymptomatic patients (Muir and Goss 1990a. b).
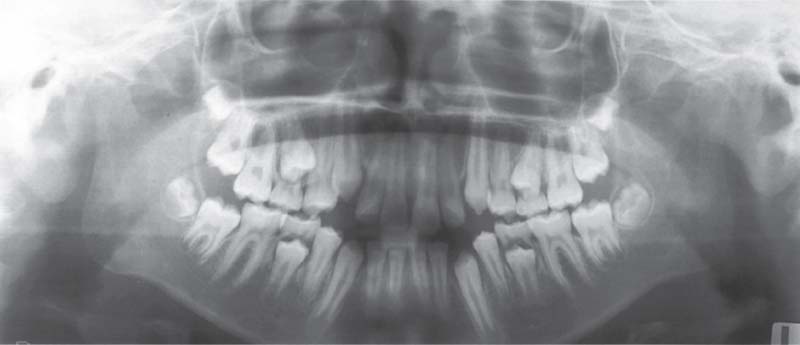
368 juvenile chronic arthritis
Panoramic radiograph of a 10-year-old with chronic juvenile arthritis. Approximately 10% of children with this disease and near normal formation of the facial bones exhibit degenerative changes in the condyles (Pearson and Rönning 1996). In patients with severe skeletal changes (“bird-face retragnathism”) the condyles always show advanced resorption. Early functional treatment can improve the skeletal problems (Pedersen et al. 1995, Paulsen 1997).
369 Goldenhar syndrome
Panoramic radiograph of a 6-year-old with Goldenhar syndrome (oculoauriculovertebral dysplasia). While the right ascending ramus and condyle have developed normally, on the left side there is underdevelopment and shortening of the condylar process. In patients with syndromes, the extent of involvement of the temporomandibular joint is of special interest because this determines the type of treatment (functional jaw orthopedics, Herbst hinge appliance, distraction osteogenesis, reconstructive dentistry).
370 Pyknodysostosis
A 56-year-old man with a spontaneous fracture of the mandible associated with pyknodysostosis. Pyknodysostosis is a rare form of sclerosing osseous dysplasia with an autosomal recessive inheritance (Maroteaux and Lamy 1962, Karkabi 1993). The temporomandibular affected (Yamada et al. 1973, Zachariades and Koundouris 1984), but the osteomyelitis that frequently accompanies it can sometimes mimic a temporomandibular joint problem (Iwu 1991, Schmitz et al. 1996).
Portraying the Temporomandibular Joint with Panoramic Radiograph Machines
For several years supplementary programs that are supposed to allow specific views of the temporomandibular joint have been made available for panoramic radiographic machines. But in most of these programs the ascending ramus is pictured only as a segment in the same projection used for a conventional panoramic radiograph. Other programs make images of the condyle from two different viewing angles, or offer the ability to make the exposure with the jaws either closed or at maximum opening. The misleading term “functional panoramic radiograph” is sometimes used in the literature.
Fundamentally, there is no compelling medical indication for any of these modifications. In some programs the orbital movement is modified so that the condyles lie in a better position within the parabolic imaging plane, and his does produce a sharper image (Chilvarquer et al. 1988). Nevertheless, in many patients this technique results in a faulty picture because the condyles tend to “wander” out of the prescribed field of the radiograph. Furthermore, considering the increased radiation dose, there is no indication for exposures made with the mouth both closed and open!
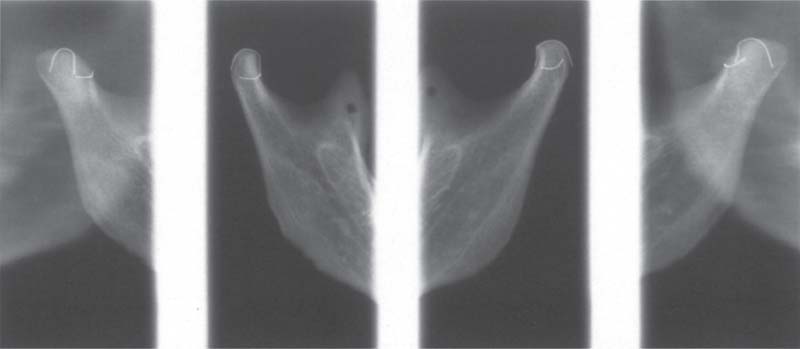
371 Biaxial radiograph of a temporomandibular joint specimen (from Gendex)
Biaxial radiographs of the ascending rami of a macerated mandible. Exposures of the condyles were made at a 0° projection angle (inner radiographs) and at a 40° projection (outer right and left). It can be seen near the edge of the right picture that the image of the left condyle is distorted posteriorly. At this angle parts of the contour of the condyle are hidden and so cannot be evaluated correctly. The vertical wire marks the central sagittal plane of the condyle and the horizontal wire outlines its lateral portion.
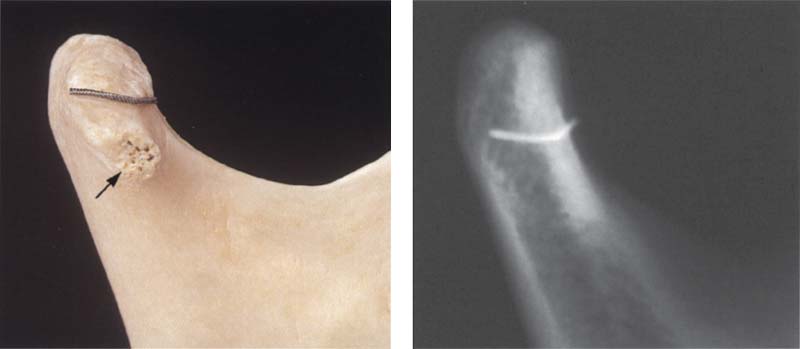
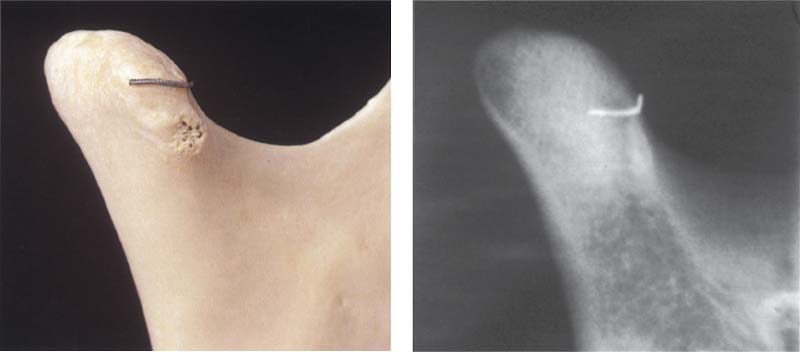
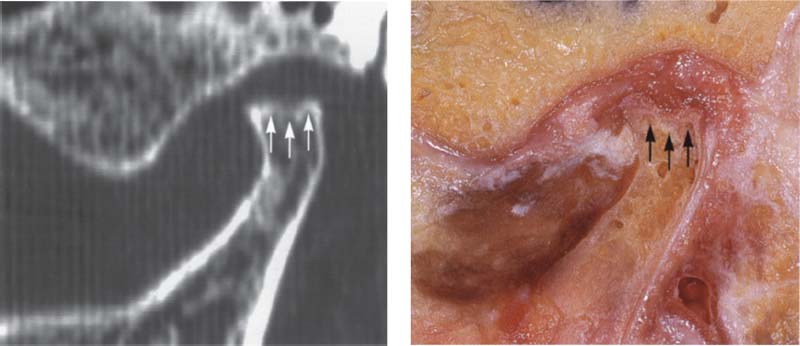
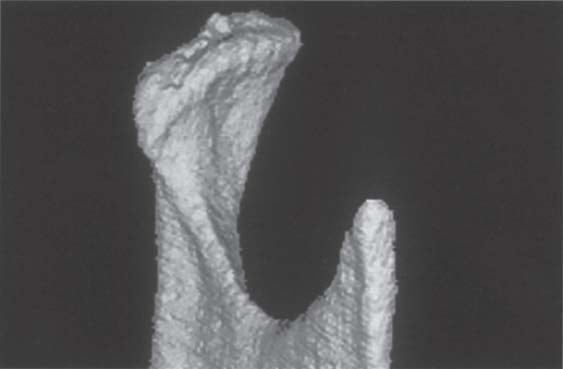
372 0° projection with the temporomandibular joint program
Left: A macerated right condyle. The wire marks the lateral boundary of the former fibrocartilaginous articular surface. With a 0° projection the path of the rays is parallel with the long axis of the condyle. Below the wire an enlarged lateral condylar pole (arrow) can be seen. Right: Radiograph of the same condyle. A part of the articular surface is superimposed over the condylar process.
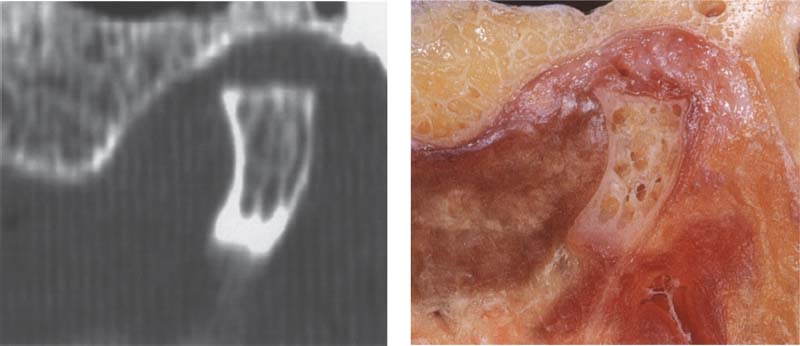
373 40° projection with the temporomandibular joint program
Left: The same condyle as shown in Figure 372, but now in a 40” projection. Here the transverse extent of the articular surface can be seen more clearly. Compared with the conventional angulation, this provides a different and perhaps broader view of the joint surface. However, because it provides no information about the fibrocartilaginous articular surface, it has no influence on treatment decisions. Right: Radiograph of the same condyle.
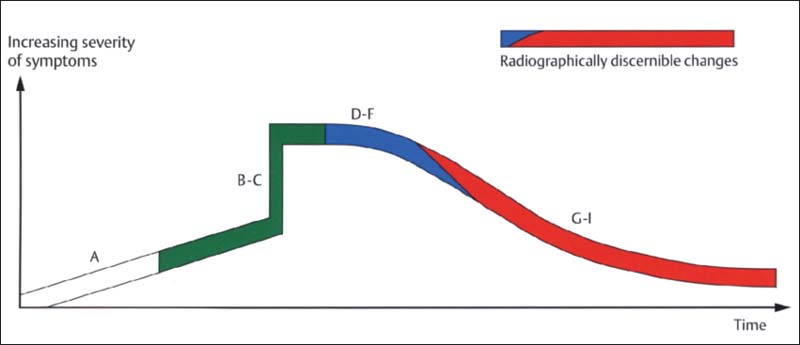
374 Degenerative joint changes (from Hatcher and Lotzmann 1992)
Radiographic representation of joint surface changes has two significant disadvantages:
• It does not show adaptive processes of the fibrocartilaginous articular surfaces that may permit normal function in spite of the osseous changes.
• Overloading of the joint surfaces can be recognized in a radiograph only after a considerable lapse of time, from stage E to stage G.
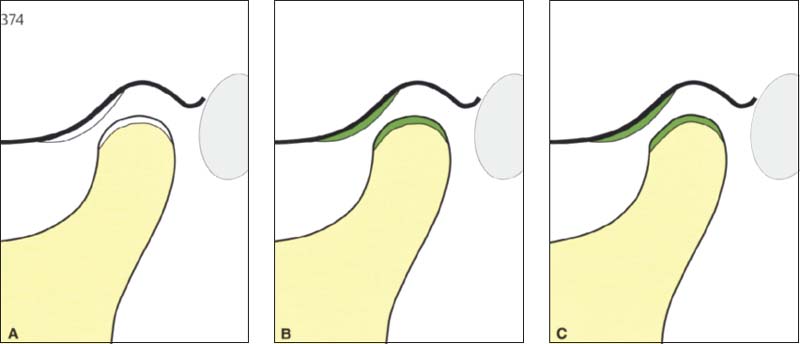
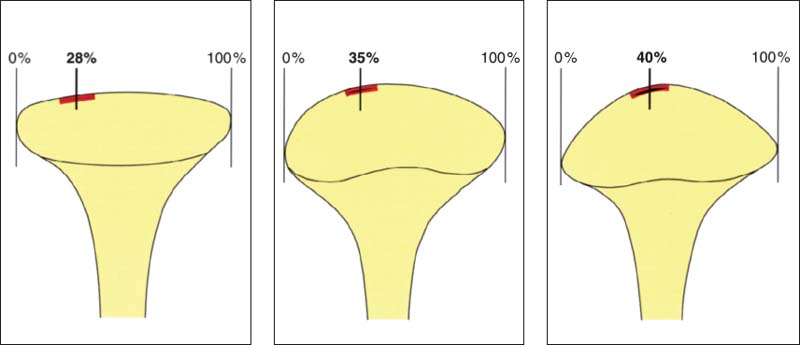
375 Stages A through C
In these stages the joints appear normal in radiographs (panoramic radiograph, Schüller projection, tomogram, CT).
A Physiological joint with normally functioning articular surfaces.
B Progressive adaptations are expressed as thickenings of the fibrocartilage that cannot be seen on the radiograph or diagnosed clinically.
C Overloading leads to flattening of the fibrocartilage.
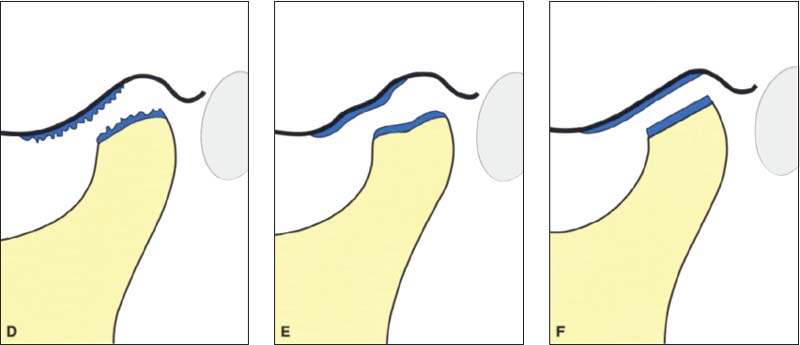
376 Stages D through F
D With further chronic overloading of the articular surfaces, cartilage matrix is resorbed and the contour of the bony condyle becomes flatter. Clinically, slight grating sounds arise at this point. E With increased loading the joint surfaces become deformed and the bone contours are flattened even more. F IF sufficient adaptation occurs, fibrocartilage will compensate for the osseous changes. Otherwise the rubbing sounds increase in intensity.
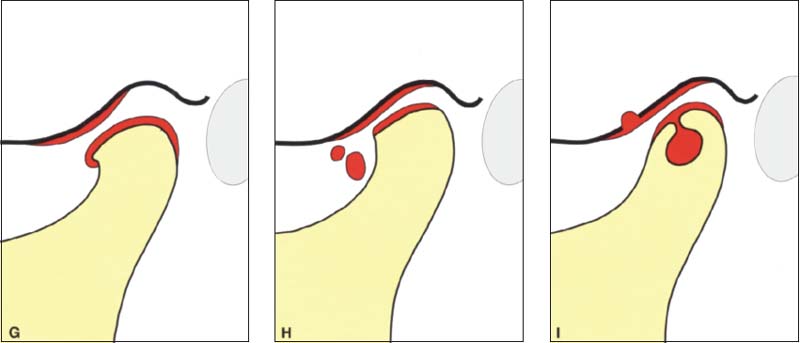
377 Stages G through I
Signs of chronic overloading of the joint surfaces that are always visible in the radiograph: G Formation of a lip at the anterior border. H Breaking off of free bodies within the joint. I Formation of subchondral cysts. Even advanced stages of osseous joint surface changes can sometimes become perfectly adapted through the formation of fibrocartilage. These cases usually have no clinical symptoms and therefore do not require treatment.
Asymmetry Index
Panoramic radiographs produce an 18-21% magnification in the vertical direction (Larheim and Svanaes 1986). The distortion is even greater when the patient is positioned incorrectly (Tronje et al. 1981). In 1988 Habets and coworkers first proposed a method for determining asymmetries on a panoramic radiograph. Various investigators have used this asymmetry index (AI) in clinical studies (Athanasiou 1989, Bezuur et al. 1989, Schokker et al. 1990, 1994, Miller 1994, Miller et al. 1994).
The principle behind this index is that the vertical heights of the right and left condyle and ramus are measured on a panoramic radiograph and these values are used in the formula AI – [(R-L)/(R+L)1 × 100% to calculate the asymmetry index. This is calculated separately for the heights of the condyles and the rami. But as demonstrated in studies by Türp et al. (1995, 1998) and by Ferrario et al. (1997), any conclusions reached by employing the asymmetry index are unreliable.
Kjellberg et al. (1994) presented a method to be employed unilaterally on each side to eliminate errors caused by magnification.
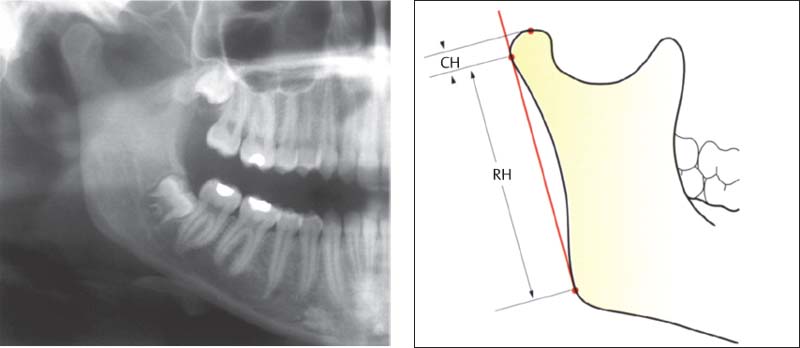
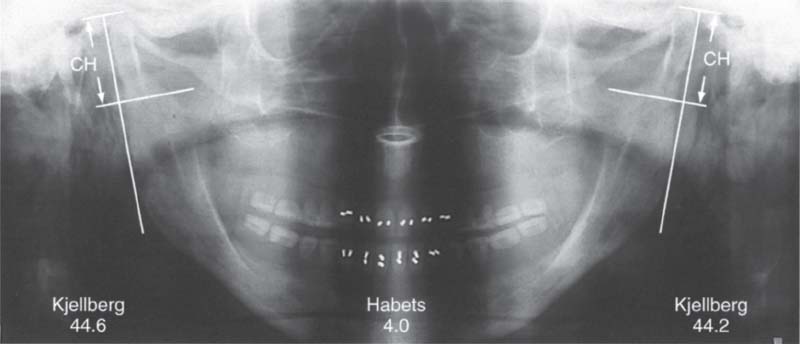
378 Habets1 asymmetry index
This asymmetry index (AI) is calculated from the formula AI = [(R-U/R+L)] × 100% in which R and L stand for the values on the right and left sides. AI can be calculated for either the height of the condyle (CH)or of the ramus (RH). A difference of more than 3% indicates an asymmetrical relationship. Errors can arise, however, through deviations in the projection angle or positioning of the patient, and these reduce the reliability of the results (Ferrario et al. 1997, Turp et al. 1995, 1998).
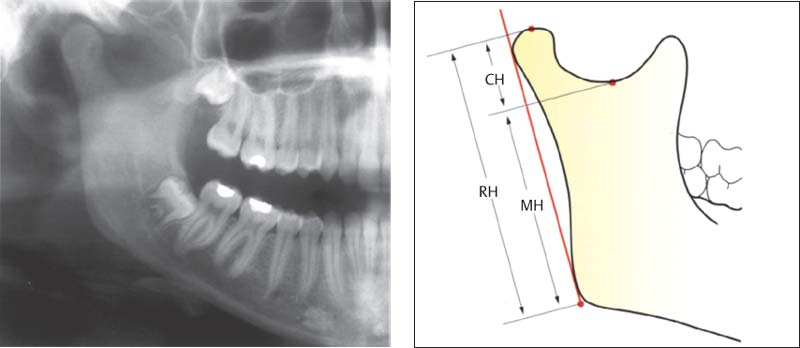
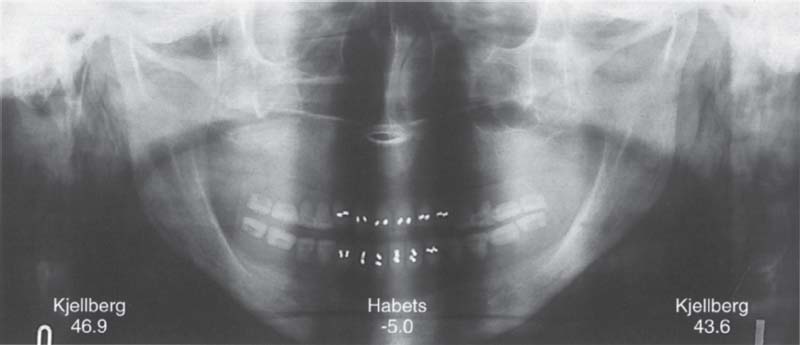
379 Kjellberg’s asymmetry index
This determination uses other reference points. By calculaing the quotient of CH:MH or CH:RH in the comparison of the two sides, the magnification error is avoided. The normal values for CH:MH and CH:RH are approximately 35 and 53 respectively. Comparison of the quotients for the two sides allows one to draw a conclusion about asymmetrical relationships in the ascending rami.
|
CH |
condyle height |
|
MH |
mandible height |
|
RH |
ramus height |
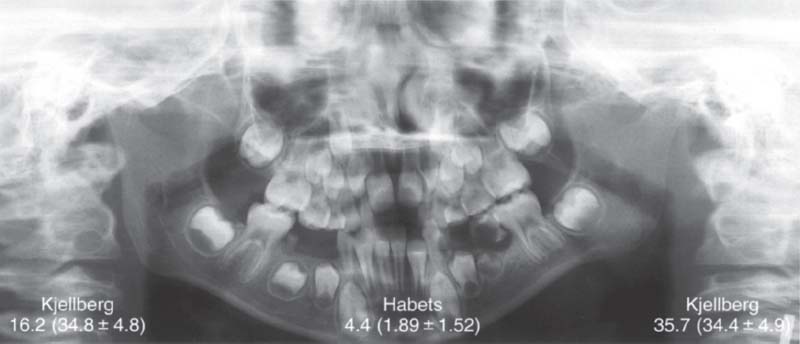
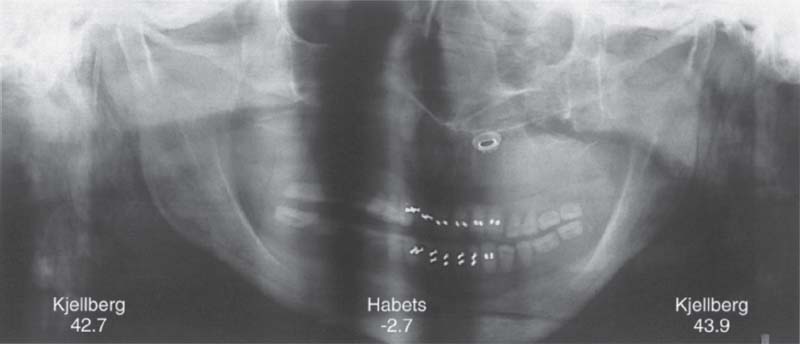
380 Asymmetry indices for a patient with hypoplasia of the right condyle
Comparison of Kjellberg’s unilateral index (right and left values with normal values in parentheses) and Habets’ asymmetry index (central figures). Even though in this obvious clinical example the values point in the right direction, the clinical significance of these, and the asymmetry index in general, is very questionable because of the biological variations in condylar form (Ferrario et al. 1997) and length (Türp etal. 1998).
Distortion Phenomena
Distortions in the images of the ascending rami and the temporomandibular joints on panoramic radiographs can be traced back to three phenomena (Kaplan 1991):
• In adults the condyles lie outside the plane of focus dictated by the dental arch, and therefore their image appears blurred.
• The central beam is not directed parallel with the long axes of the condyles and this results in an oblique anteromedial view.
• The temporomandibular joint is pictured with a magnification factor and a variable projection angle.
Inaccurate vertical measurements can result from incorrect positioning of the patient’s head (extension, flexion, lateral inclination, rotation), measurement errors on the film, or discrepancies in the projection angle. Slight deviations of head position in the machine do not have a great effect on vertical measurements in panoramic radiographs (Xie et al. 1996). Nevertheless, the error in linear measurement can amount to 9-11% (Xie et al. 1997). The agreement of a calculated asymmetry index with the actual anatomical relationships is inadequate (Türp et al. 1995).
381 Correct standard positioning
Example of the asymmetry indices of Habets and Kjellberg on the skull of a 67-year-old full denture wearer with increased condylar height on both sides. When the head is correctly positioned in the x-ray unit, the figures for the Kjellberg index are higher than normal, indicating condylar hyperplasia on both sides. Habets’ index is likewise elevated and indicates that the right condyle is longer than the left.
382 Distortion from tilting of the head
The same skull tipped 2° to the right. The resulting distortion causes the Kjellberg index to indicate that the right condyle is longer than the left. Because of the different reference points used, the curious situation arises that according to Habets’ index, there is asymmetry with the greater length on the left side. Because of the short length of CH in Habets’ method, small errors in measurement will have a greater influence on the asymmetry index.
383 Distortion from rotation of the head
The same skull turned 10” to the left. The distortion here causes the Kjellberg index to indicate that the left condyle is slightly longer than the right. Habets’ index still indicates a lengthening on the left side, but within the normal range. To summarize, these experiments demonstrate that Habets’ asymmetry index is more subject to errors than that of Kjellberg.
Eccentric Transcranial Radiograph (Schüller Projection)
The technique of the eccentric transcranial radiograph is attributed to Schüller (1905). Over the past decades many modifications of the radiation path have been advocated for improving definition of the joints. However, all the modifications allow only images of the lateral (Weinberg 1973) or centrolateral parts of the joints (Lauffs and Ewers 1988); abnormalities in the medial part cannot be evaluated on these radiographs (Carlsson et al. 1968). And even in the lateral part, small (<5 mm) bony defects are not always visible in a lateral oblique radiograph (Setz and Fleig 1973).
Contrary to earlier clinical studies (Geering 1975, Kundert 1976), it is today agreed that the Schüller projection is contraindicated for finding the position of the condyle in the fossa (Dixon et al. 1984, Aquilino et al. 1985, Preti and Fava 1988, Katzberg and Westesson 1993). The extent to which condylar translation is restricted can be easily determined clinically. Moreover, radiographic monitoring of condylar movement is obsolete. Therefore, there is no longer any rational indication for transcranial radiographs in the diagnosis of functional problems of the temporomandibular joint.
384 Transcranial radiograph of the temporomandibular joint
The right temporomandibular joint of a 52-year-old patient with the jaws closed (left) and at maximum opening (right). The images of the contours reproduce the relationships in the lateral part of the joint. An accurate evaluation of the joint space in an individual case cannot be made from the radiograph, even if one takes great pains to do so. The exposure in the open position provides no additional information and is superfluous because the extent of condylar translation is already well known from the clinical examination.
385 Depiction of the centrolateral portions of the joint
Which portion of the condyle is outlined in an eccentric transcranial radiograph depends in large measure upon the shape of the condyle (Bumann et al. 1999). The Hatter the condyle (left) the more the lateral portion will be shown. The greater the convexity of the condyle (center and right), the more the image will represent portions nearer the center. However, the bony contours of the condyle do not necessarily agree with the contours of the fibrocartilage (Klein et al. 1970. Pullinger et al. 1990, 1993).
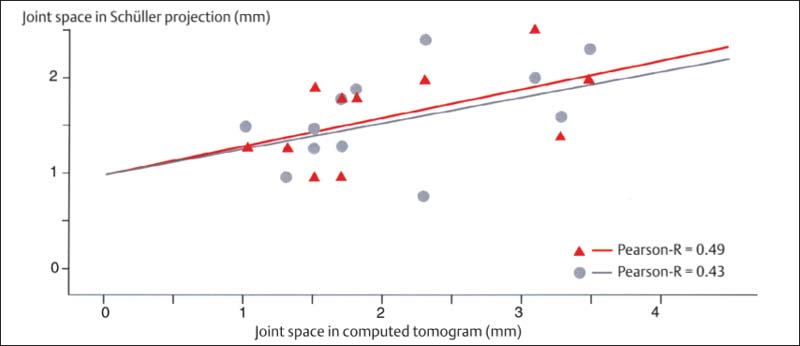
386 Correlation of the joint space width in Schüller projections and computed tomograms
Modifications of the Schüller (1905) projection by Lindblom (1936), Palla 1976), and Krenkel et al. (1982) and a consistent exposure technique using the appropriate cephalostat (Hanel 1974, Mongini and Preti 1980) are supposed to make an accurate evaluation of the joint possible. However, the correlation of individualized (red) and average-value (gray) projections with the actual joint space measured on a CT is not adequate. The Pearson-R correlation should be at least 0.7.
Axial Cranial Radiograph According to Hirtz and Conventional Tomography
Tomograms were first used as a diagnostic measure for the temporomandibular joint by Petrilli and Gurley (1939). Compared with panoramic radiographs, they have a higher specificity for diagnosing degenerative changes in the joint surfaces (Ong and Franklin 1996). Under the microscope, erosive lesions are found twice as frequently on the temporal portion of the joint as on the condyles (Flygare et al. 1995). However, lesions on the condyle tend to be more pronounced and are therefore diagnosed more frequently on the radiograph. Tomographic methods are not well suited for detecting early stages of erosion (Flygare et al. 1995).
Because of their high level of radiation exposure and their questionable therapeutic significance, the indications for tomography of the temporomandibular joint are very limited; it should be employed with reservations. Tomograms are very popular in North America for legal documentation. While some authors (Pullinger and White 1995, White and Pullinger 1995) emphasize their diagnostic importance, others (Eliasson and Isacsson 1992, Callender and Brooks 1996) call this into question.
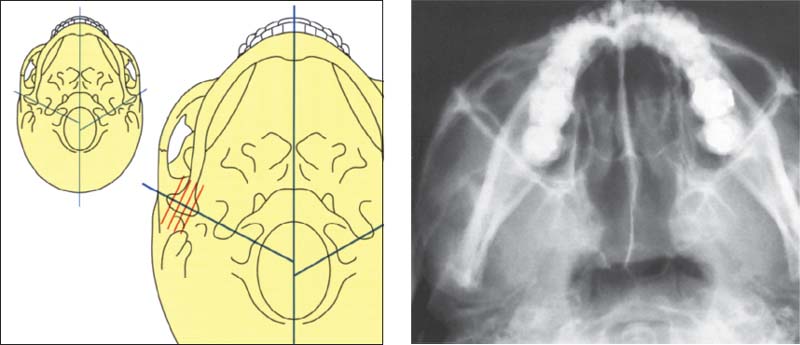
387 Axial cranial projection
Left: Schematic drawing showing the temporomandibular joints in an axial cranial projection. There is no correlation between a greater intercondylar angle and radiographically visible degeneration of the condyles. The angle is significantly greater, however, in patients with painful joints. The intercondylar angle is likewise increased in patients with disk displacements (Sato et al. 1997).
Right: Radiograph of a left temporomandibular joint in the axial cranial projection.
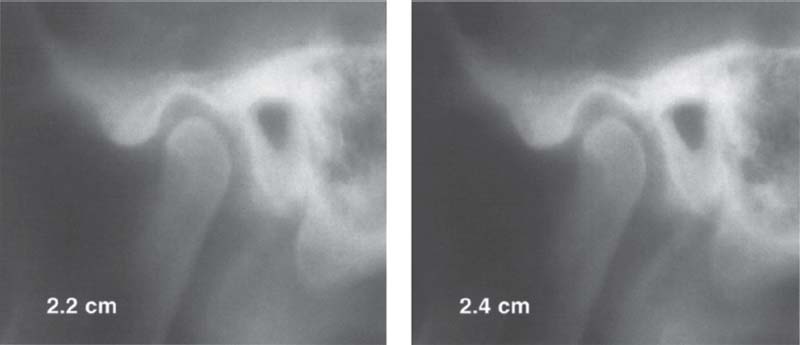
388 Tomography of a left temporomandibular joint
As a rule, an axial cranial radiograph is made first for orientation and is followed by preparation of four tomograms of each joint. Each of the recorded layers is 2 mm thick and their distance from the skin surface is 1.5-3.5 cm, depending on the thickness of the subcutaneous fatty tissue. In the case shown here the slices lie at depths of 2.2, 2.4, 2.6, and 2.8 cm. This representation of the temporomandibular joint provides reliable information about bony changes in the region of the fossa and condyle. Dimensional changes in the joint space make it impossible to draw any reliable conclusions about “joint compression” and “distraction” and therefore should not be used as the basis for therapeutic measures. Here, as with the previously described technique, there is no reason to make an exposure with the jaws open because that would provide no additional diagnostic information, and the open-position radiographs are irrelevant as far as the treatment is concerned.
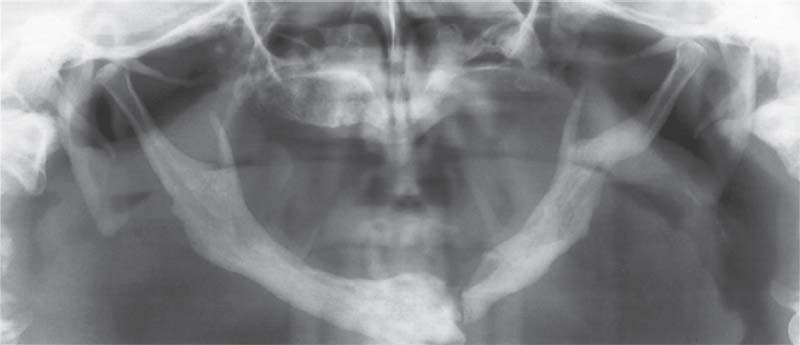
Posterior-Anterior Cranial Radiograph according to Clementschitsch
Frequently, fractures in the region of the ascending ramus of the mandible and the temporomandibular joint cannot be adequately evaluated in radiographs made in one single plane (Moilanen 1982). An additional posterior-anterior cranial exposure (Clementschitsch 1966) is chosen primarily when there is suspicion of fracture of the mandible or neck of the condyle. Because of the eccentric path of the rays (Rother and Biedermann 1978, Pasler 1991) and the opening of the jaws, there is little or no overlapping of other bony structures over the condyles. Therefore intracapsular fractures and the extent of luxation of the proximal fragment of a condylar neck fracture can be displayed well in this second plane.
Through the modern techniques of three-demensional reconstruction, however, Clementschitsch’s posterior-anterior cranial radiograph is becoming increasingly supplanted by the computed tomogram (Kahl et al. 1995). Apart from this, patients who have a suspected fracture of the neck of the condyle and bleeding from the outer ear should have a CT scan directly to reduce the total dose of radiation, because often there is also a fracture of the temporal bone that otherwise might go undetected (Avrahami and Katz 1998).
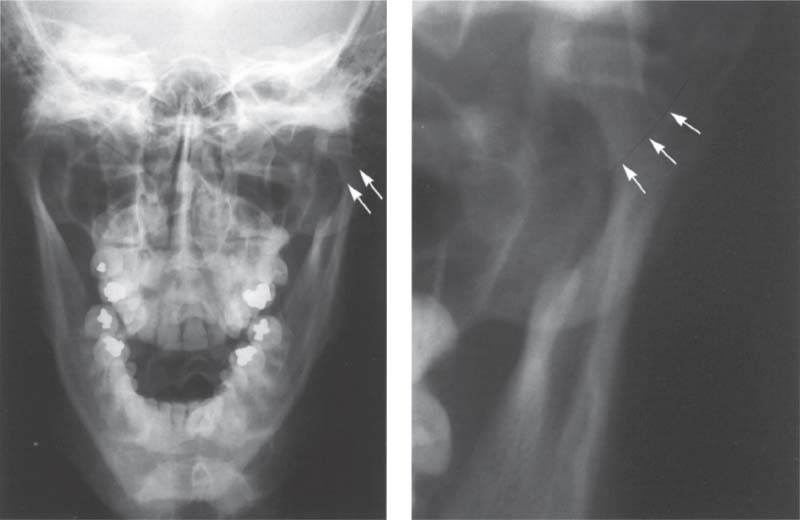
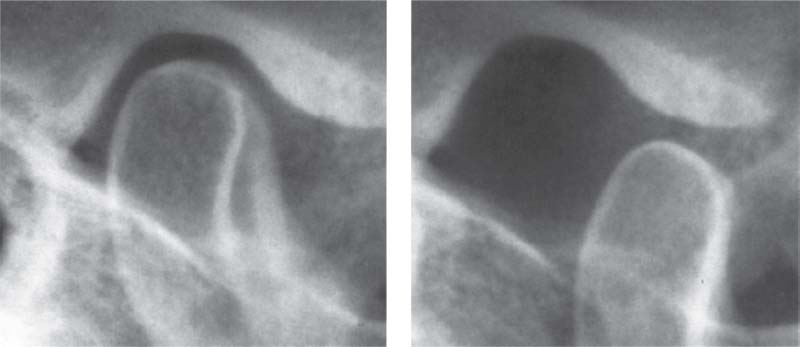
389 Intracapsular fracture
Left: Full frontal view radiograph showing an intracapsular fracture (arrows) in the left joint of a 17-year-old patient. The clinical symptom was pain in the temporomandibular joint region following a traumatic blow.
Right: Enlarged section of the left temporomandibular joint region. Here the line of disrupted continuity (arrows) can be seen more easily. Depending upon the degree of dislocation, intracapsular fractures are treated either conservatively through intermaxillary fixation or treated surgically. After a surgical reduction, the fragments are immobilized with wire, miniscrews, or resorbable pins (Rasse et al. 1991). If untreated, an intracapsular fracture could lead to osteomyelitis (Sanders et al. 1977).
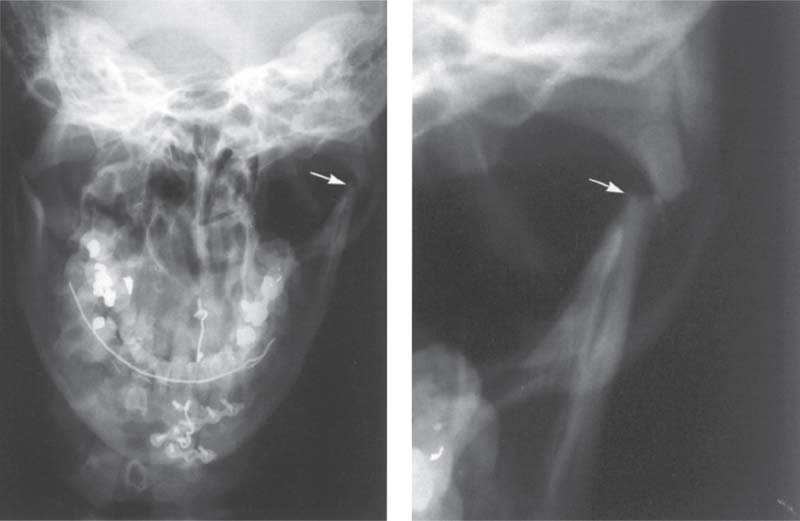
390 Fracture of the neck of the condyle
Left: Full facial view showing bilateral fractures of the condylar processes in a 38-year-old male patient. The paramedian fracture of the mandible has already been treated surgically. Right: Enlarged section of the left temporomandibular joint region. In adults the fragments will usually heal by forming a bony union in the dislocated position (Choi 1996). Surgical repositioning of the condyle without fixation results in healing with a slight medial inclination of the condyle. Subsequently. 48% of these condyles will show no alteration in their morphology (lizuka et al. 1998). Following condylar neck fractures in children, up to 77% will regain a normal physiological condylar shape through remodeling (Kellenberger et al. 1994).
Lateral Transcranial Radiograph
The lateral transcranial radiograph has no use as a diagnostic tool for the temporomandibular joint but does reveal the condition of the craniovertebral, craniofacial, and craniohyoidal complexes (Solow and Siersbaek-Nielson 1992. Kluemper et al. 1995, Huggare and Houghton 1996).
When distraction osteogenesis is planned to lengthen the ascending rami of the mandible (Stucki-McCormick 1998), a lateral transcranial radiograph is necessary to determine the distraction vector.
O’Ryan and Epker (1984) and Burke et al. (1998) were able to identify a posterior loading vector based upon the distribution of trabeculae in the condyle. In a cephalometric analysis, this is accompanied by an increased mandibular angle and mandibular plane angle. Similar findings have also been described in patients with Angle Class III occlusions and anterior disk displacements (Muto et al. 1998, Brand et al. 1995. Dibbets and Van der Weele 1996. Nebbe et al. 1997, Bumann etal. 1999).
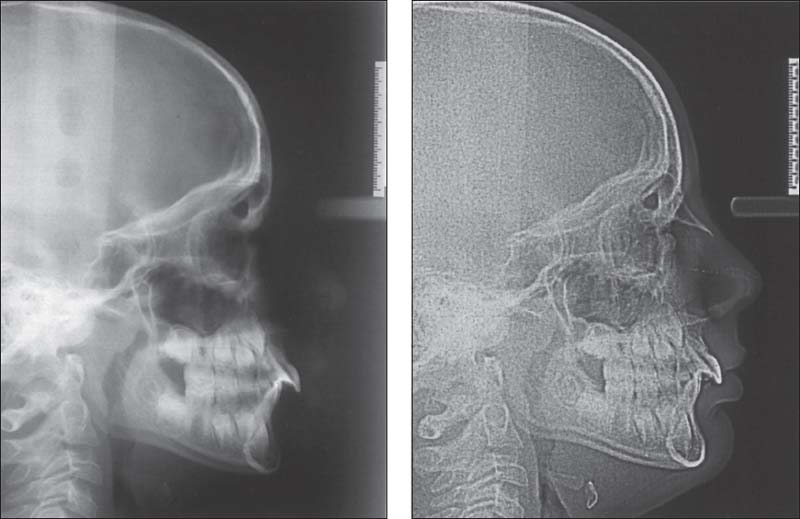
391 Conventional versus digital
Left: Conventional lateral transcranial radiograph. To capture the centric mandibular position one should not, as frequently described, slide the teeth from the incisal contact position to the retruded contact position, but should rather make the radiograph in centric condylar position after appropriate preliminary treatment.
Right: Digital lateral transcranial radiograph of the same patient. While the reproduction of the osseous reference points is virtually the same, the soft tissues show up much more clearly because of the 75% reduction in radiation exposure. This advantage has been corroborated in similar studies (Eppley and Sadove 1991. Bumann et al. 1999).
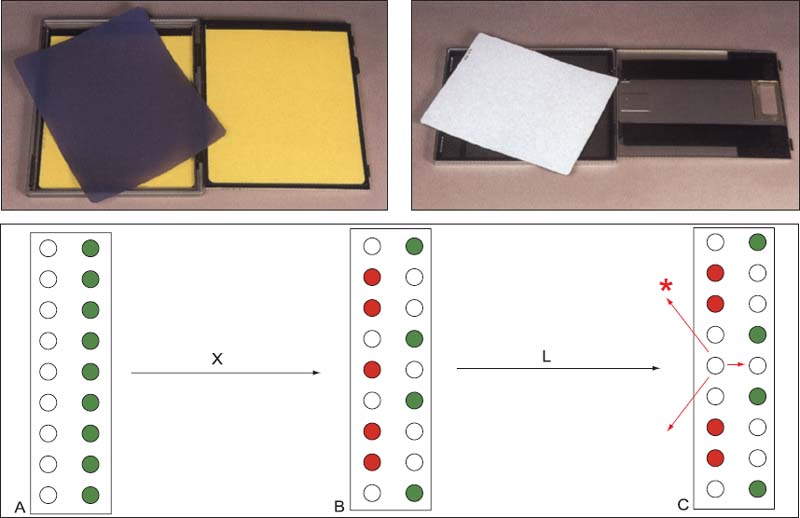
392 Cassettes for the conventional and the digital radiographic techniques
Above: Cassette-film combination for conventional lateral transcranial radiograph (left) and cassette with a special luminescent screen for digital Images (right). Below: A schematic diagram showing the operation of the screen for digital radiographs (PCR, Gendex); X-rays (X) raise electrons in the screen to a higher energy level. As the screen is swept by a laser (L) the excited electrons return to their base energy level and luminescent rays (*) are emitted.
Computed Tomography of the Temporomandibular Joint
CT(Suarez etal. 1980) is not one of the routinely used radiographic examination techniques for the temporomandibular joint. It serves primarily as an expanded diagnostic tool for fractures, advanced arthritis, ankylosis, and tumors (Brooks et al. 1997). Thanks to its high resolution, it is especially suited for diagnosing bony abnormalities (Manzione et al. 1984). Although it can reveal the disk, MRI is preferred for a more specific evaluation of the disk (Helms and Kaplan 1990, Larheim 1995).
A distinction is made between two exposure techniques (Manzione et al, 1984, Thompson et al. 1984): axial slicing with computation of an image in the sagittal plane and direct sagittal slicing. For a long time the direct sagittal scan was associated with a very uncomfortable patient position, but with more modern equipment the patient can now be positioned more comfortably.
Spiral CTs permit a more rapid and precise acquisition of data. They also reduce the radiation exposure and are advantageous for muitiplanar slices and three-dimensional reconstructions (Tello et al. 1994).
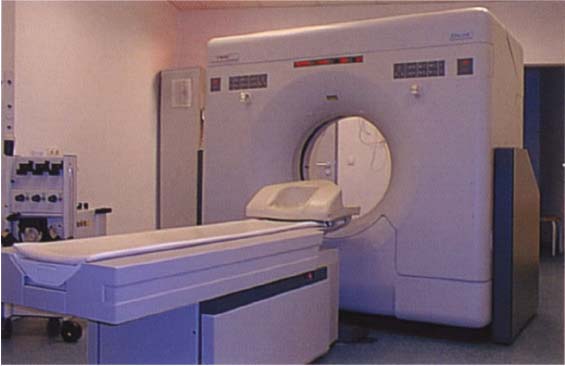
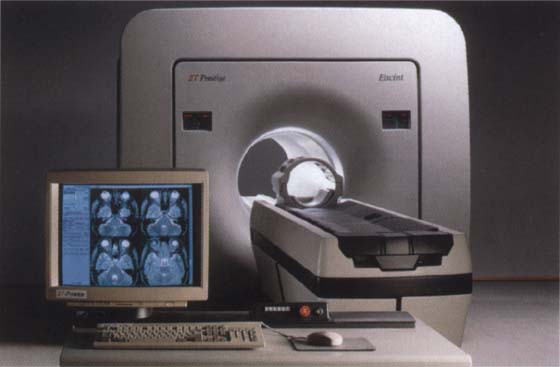
393 CT scanner
A typical model of CT scanner for the making of spiral (helical) CTs. The computer tomograph unit CT Twin shown here and manufactured by Picker (formerly by Elscint), unlike other scanners, can measure two layers simultaneously during a rotation of the detector system (Seifert et al. 1997). This so-called dual sliced mode, in contrast to the so-called fused slice mode, allows considerable reduction in both the examination time and the radiation exposure. Photograph courtesy of J. Hezel
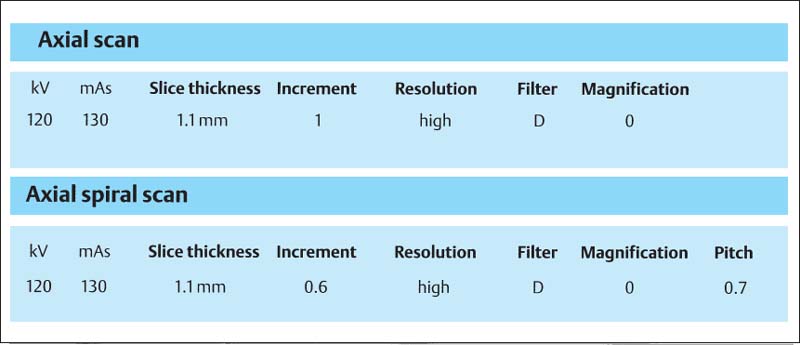
394 Scan parameters
Table of the well-tested scan parameters for the axial spiral scan. The figures apply to the CT Twin scanner.
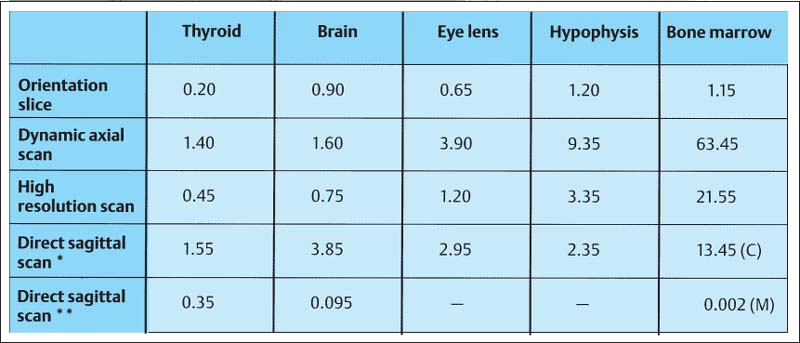
395 Radiation exposure
Radiation dose (values in mGy) delivered to different organs during a computed tomographic examination of the temporomandibular joints. The figures are derived from the work of Christiansen et al. (1987) (*) and van der Kuijl (1992) (**). C = condyle M = mandible
Computed Tomography of the Temporomandibular Joint and its Anatomical Correlation
CT is especially suited for representing f/ie morphology of bone (Thompson et al. 1984, Westesson et al, 1987, Tanimoto et al. 1990, de Bont et at. 1993. Hu and Schneiderman 1995). Therefore, it is also employed for evaluating therapeutic measures (Fernandez Sanroman et al. 1998, Kawamata et al. 1998) and for planning implant procedures (Westesson 1996, Kraut 1998). However, on small structures with a high degree of curvature, such as the condyle and fossa, the so-called partial volume effect can cause one to overestimate the thickness of the cortical bone by as much as 200% (Ahlqvist and Isberg 1998). For investigating the disk, CT is not the method of choice (de Bont et al. 1993, van der Kuij I et al. 1994). The sensitivity of disk diagnostics with CT scans is 0.8G, but because the disk is often confused with the tendon of the lateral pterygoid muscle, specificity is only 0.5. An elevated adsorption of radiation by the disk does provide evidence of hyalinization, calcification, and metaplasia (Paz et al. 1990). Remodeling processes in response to orthodontic treatment are seen as double contours of cortical bone in the fossa and on the condyle (Paulsen 1995).
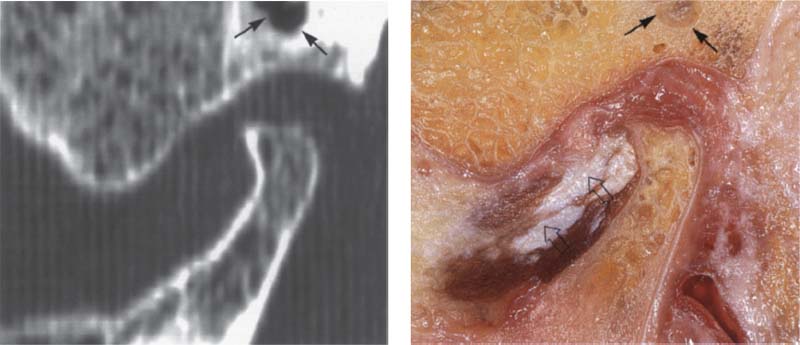
396 Lateral portion of the joint
A computed tomogram and a macroscopic anatomical preparation of the lateral portion of a human temporomandibular joint. left: Because the CT machine was not fitted with a soft-tissue window, the soft tissues cannot be identified. The low thickness of the spaces to appear as cavities (arrows).
Right: Because in this specimen the insertion of the lateral pterygoid muscle lies farther lateral than usual, part of the tendon (outlined arrows) can be recognized.
397 Central portion of the joint
Pictures of the central portion of the same joint. Notice the precision with which the CT reproduces the contours of the osseous structures (arrows).
398 Medial portion of the joint
In addition to the contours of the fossa and protuberance, the cancellous Done of the condyle is prominently reproduced in the medial slice of the joint as well. The ability of CT to accurately reproduce the bony articular surfaces should not mislead one into thinking that CTs are absolutely necessary for all temporomandibular joint problems. They are practical for joint deformations associated with syndromes, fractures, ankylosis, or tumors, but all other joint surface lesions can be adequately diagnosed through other clinical procedures (see also p. 68).
Three Dimensional Images of the Temporomandibular Joint…
Advances in computer technology have made it possible to create three-dimensional images from single axial or sagittal slices (Ray et al. 1993, Rodgers et al. 1993). This has helped to further improve the ability to make an accurate diagnosis and to more effectively plan treatment prior to surgery (Alder et al. 1995). Measurements on the computer screen can be used with confidence because these values agree with the anatomical measurements (Raustia and Phytinen 1990). The computed spatial objects can be rotated and viewed on the monitor from any direction. With the right software it is also possible to separate the condyle from the fossa. This permits accurate inspection of the medial part of the joint. For better visualization, structures that are of distinctly different shades of gray (measured in Hounsfield units) can even be displayed in different colors.
Three-dimensional imaging of the temporomandibular joint is especially indicated for ankylosis and tumors where it helps the surgeon plan exactly how much tissue to remove. Hyperplasia of the coronoid process is another classic pre-operative indication (Hönig et al. 1994).
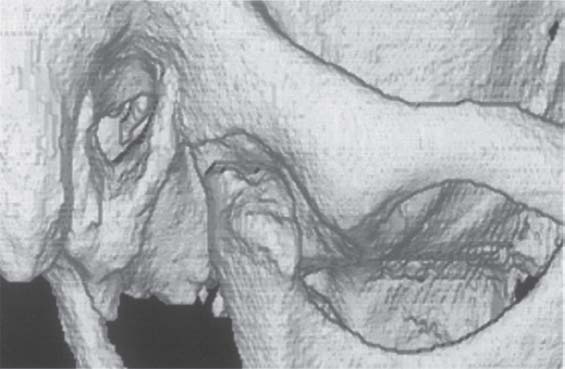
399 Three-dimensional representation of a temporomandibular joint
A three-dimensional image of the joint can be reconstructed from CT measurement data. Further detail can be seen by separating the condyle from the fossa. Special software (Denta-CT) is available for the orofacial region and is designed especially for three-dimensional imaging of the alveolar processes (Abrahams and Kalyanpur 1995).
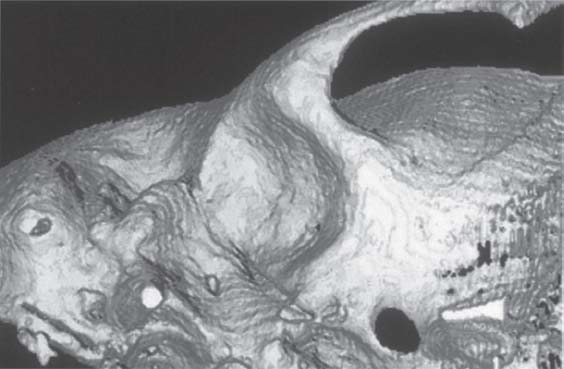
400 Three-dimensional representation of the fossa
An inferior view of the articular fossa from Figure 399 is shown. This view permits scrutiny of the condylar path and the articular eminence. The image can be rotated on the monitor so that the morphology and inclination of the joint pathway can be calculated. This determination has no clinical relevance, however. In edentulous patients the fossa lies more anterior than it does in patients with teeth. Its sagittal position depends on how long the patient has been edentulous (Raustia et al. 1998)
401 Three-dimensional representation of the condyle
This separate image of the condyle allows inspection of the joint surface. This type of image is only important for primary temporomandibular joint diseases, however. Changes in the dysfunction can be adequately diagnosed clinically and do not require three-dimensional imaging, as the radiographic findings would not change the treatment.
…with the Aid of Computed Tomography Data
Another indication that can be listed for CT with 3-D reconstruction isfracture of the neck of the condyte in adolescents and adults (Kahl-Nieke et al. 1994, Avrahami and Katz 1998). The position of the fractured condylar process relative to the ramus can be determined more accurately in a computed tomogram than in a conventional radiograph (Raustia et al. 1990). Only 4.9% of disks remain in the correct relation to the fossa following a fracture of the condylar process (Yamaoka et al. 1994). The much more important disk-condyle relationship, however, experiences much less disruption (Terheyden et al. 1996). If the fractured segment shows no contact with the ramus, it will frequently become resorhed In children and adolescents and a new condyle is formed through the remodeling process. As a rule, no resorption occurs in adults (Avrahami et al. 1993).
Alhough routine 3-D MRI reconstructions are not yet in widespread usage, they are superior to CT for diagnosing fractures of the neck of the condyle (Bumann et al. 1993, Sullivan et al. 1995, Choi 1997. Oezmen et al. 1998). This is because MRI better reveals the disk-condyle relationship, which is so important to the course of treatment, and because it requires no exposure to ionizing radiation.
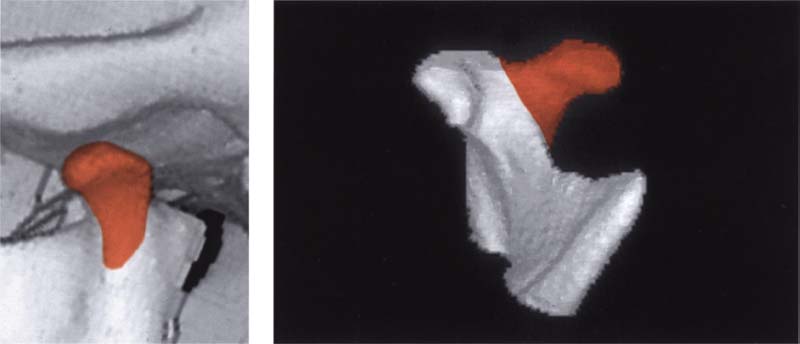
402 Condition 3 years after fracture of the neck of the left condyle
Three-dimensional image reconstructed from CT scans of the condyle of a 14-year-old patient following fracture of the left condylar process of the mandible. The isolated image of the condyle reveals that the anteromedially displaced fragment has healed in the wrong position and a “new” condyle (red) has formed lateral to it.
Left: Reconstructed left joint in a lateral view showing the new formation of a condylar process (red).
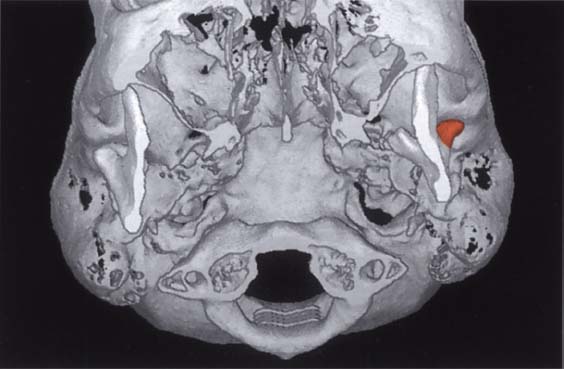
403 Inferior view for side-by-side comparison
This caudal view clearly shows the abnormal shape of the condyle in the left joint. The healed dislocated medial fragment and the remodeling in the lateral pan (red) have created a V-shaped condyle. In spite of the absence of physiological condylar form, the post-traumatic open bite found in this type of case can be closed through muscular adaptation during functional orthodontic treatment (Kahl et al. 1995. Choi 1996).
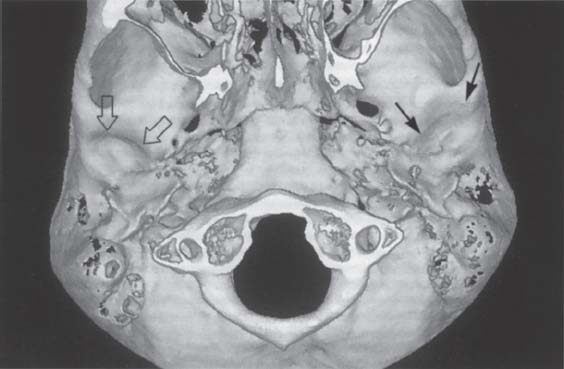
404 Changes in the joint pathway following fracture of the neck of the condyle
Digital subtraction of the condyles allows inspection and comparison of the two fossae. The V-shaped left condyle has led to flattening of the articular protuberance in the left joint (arrows). The right joint exhibits normal contours (outlined arrows). The joint pathway may be flattened by both a reduction of the eminence and apposition of bone on the roof of the fossa (Sahm and Witt 1989).
Three-Dimensional Reconstruction for Hypoplastic Syndromes
Three-dimensional images from CT data Are finding wide application for cases requiring surgical reconstruction of hypoplastic structures associated with syndromes and treatment of tumors in the facial skeleton (Linney et al. 1989, Mutoh et al. 1991, Carls et al. 1994, Eufinger et al. 1997, Jensen et al, 1998). In all disease entities with hypoplasia of the mandible or temporomandibular joint (e.g, Goldenhar syndrome, craniofacial microsomia, Treacher Collins syndrome, micrognathia, Pierre Robin syndrome), the three-dimensional CT is very helpful in planning the size of a transplant or determining the distraction vector (Stucki-McCormick 1998). With computed reconstruction, volumetric differences can be determined, and this can be quite important when using appliances for multiplanar distraction osteogenesis (Roth et al. 1997). In addition to understanding the extent of hypoplasia in the primarily affected structure, it is important for the clinician to know whieh other structures are affected by secondary adaptation. A typical example of this is deviation of the maxilla in the frontal plane in response to unilateral mandibular hypoplasia.
Goldenhar syndrome
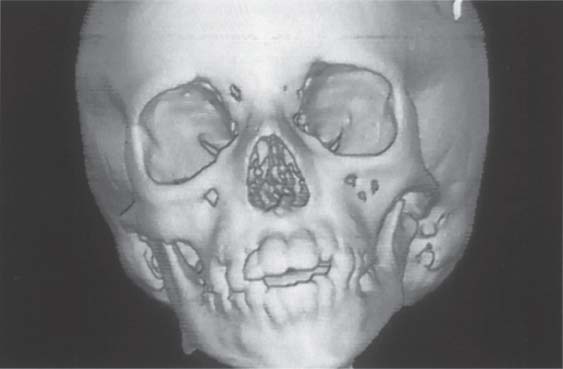
405 Frontal view
Three-dimensional reconstruction of the cranium and facial skeleton of an 8-year-old boy. Because of hypoplasia of the left ascending ramus the mandible has deviated to the left and the maxilla has under gone secondary adaptive changes. The more pronounced the adaptive changes, the more important it is to institute functional therapy in addition to surgical correction (Behnia et al. 1997).
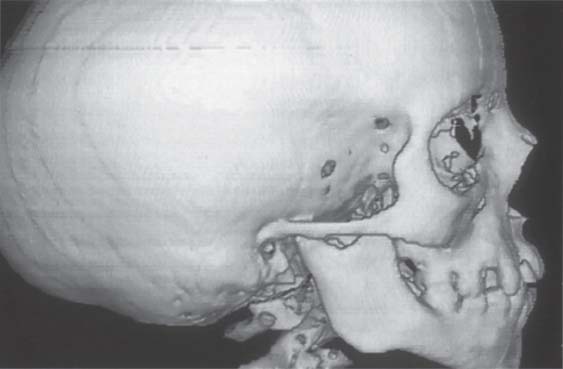
406 Right temporomandibular joint
Three-dimensional reconstruction of the unaffected right side. The relationship between the ascending ramus and the condylar process is almost normal. The condyle shows a slight flattening inconsistent with the patient’s age. The external auditory meatus and glenoid fossa show no deviation from the norm. Even though it is theoretically possible to represent the muscles of mastication in a CT. MRI is to be preferred for evaluating muscular changes.
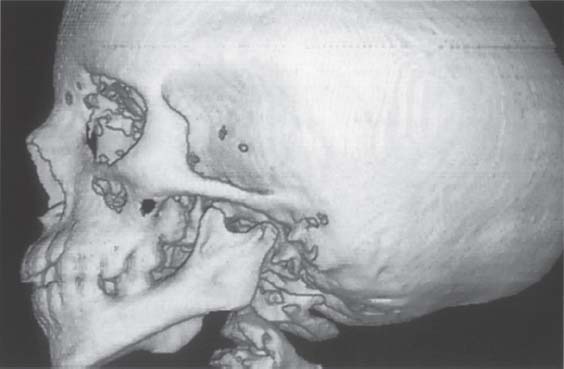
407 Left temporomandibular joint
On the left side, the mandible is noticeably underdeveloped. This affects the height of both the body of the mandible and the ascending ramus. In addition, both the condylar process and the articular eminence are hypoplastic. The osseous external auditory meatus is obliterated. While planning the surgical operation for distraction osteogenesis, the shapes of the ascending ramus and the condylar process are especially important for determining the exact distraction vector.
Three-Dimensional Models of Polyurethane Foam and Synthetic Resin
Three-dimensional models of the skull are quite helpful as an additional diagnostic tool and for simulating the surgery planned for dysgnathia or congenital syndromes (Vannier 1991. Ayoub et al. 1996. Hibi et al. 1997). They facilitate exact anatomical repositioning, shorten the operating time, contribute to an improved postoperative result, and thereby reduce the need for secondary operations (Kermer et al. 1998). The fabrication of milled models was first described by Brix et al. (1985). Stereolithography has been used since the beginning of the 1990s (Mankovich et al. 1990, Sato et al. 1998). These models are accurate to within 0.25-0.47 mm (Barker et al. 1994, Lindner et al. 1995). Measurements on three-dimensional models before and after mandibular advancement surgery revealed an average increase in the distance between the condyles of 2.9 mm and in the distance between the coronoid processes of 6.9 mm (Schultes et al. 1998). Because of its shorter production time and lower cost, milled polyurethane foam models are given preference for routine cases. If, however, reproduction of bony details and hollow spaces is necessary, then stereolithography is the method of choice (Kermer et al. 1998, Sailer et al. 1998. Santler et al. 1998).
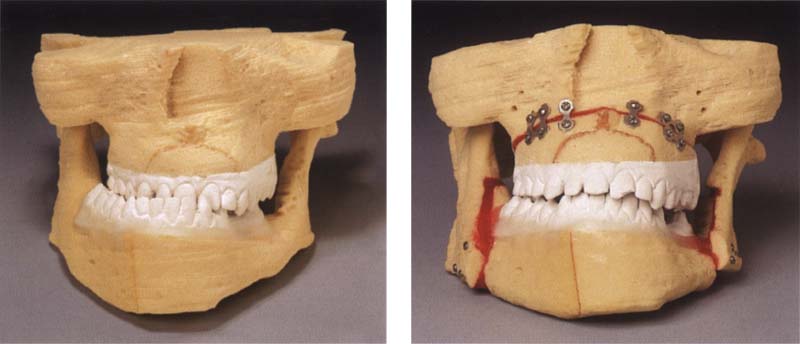
408 Polyurethane foam models
Left: The CT data guides a special milling machine that carves a model of the jaws from a block of polyurethane foam (Caggl et al. 1998).
Right: The planned operation can be simulated on the models and the fit of the osteosynthesis material tested. This will substantially reduce the operating time. This procedure is indicated especially for patients with asymmetries (Fuhrmann et al. 1994). Collection of B. Fleiner
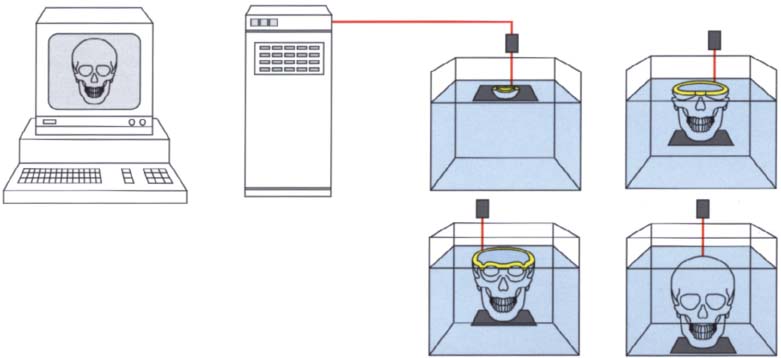
409 Principle of stereolithography
In stereolithography a UV laser is guided by the three-dimensional CT data set. The laser travels over a container of liquid synthetic resin, polymerizing a trail in the liquid material. Then a computer-guided table is submerged by the thickness of the polymerized layer and the next slice is polymerized by the laser. These steps are repeated until the entire model has been polymerized.
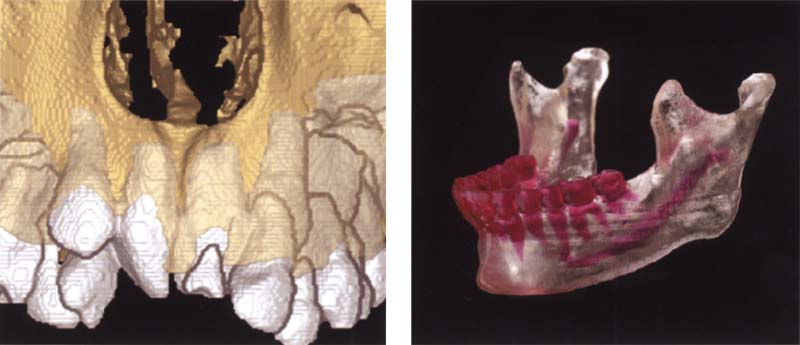
410 Stereolithographic models
Left: Monitor image of a three-dimensional model of a maxilla with retained incisor teeth from a 12-year-old patient. Modern software makes it possible to color the clinical crowns and the submerged roots and teeth differently from the bone.
Right: The most recent advances in stereolithographic technology makes it possible to produce multicolored models such as this in which the teeth can be distinguished from the bone (Clear View TM. Medical Modeling Corporation).
Magnetic Resonance Imaging
MRI is an imaging procedure by which not only bone, but also soft-tissue structures can be reproduced in detail by employing static and dynamic magnetic fields. Bloch et al. (1946) and Purcell et al. (1946) were the first to describe the principle of magnetic resonance. Clinical application was not possible, however, until the discoveries of Damadian (1971) and Lauterbur (1973). Thanks to the development of so-called surface coils, it has been possible since the mid 1980s to study the temporomandibular joint through MRI (Harms et al. 1985, Katzberg et al. 1985). Since then the MRI has developed into the method of choice for evaluating all forms of temporomandibular joint disk displacement. Because it requires no radiation exposure and reproduces soft tissue in good detail, it far outranks other imaging procedures for this purpose. The ability to depict bone structure, too, has been greatly improved and its reproduction of detail ranks only slightly below that of CT (Westesson et al. 1993). Cerebral aneurism clips, heart pacemakers, and ferromagnetic foreign bodies are contraindications to its use, but orthodontic appliances, dental implants, and dental restorations are not.
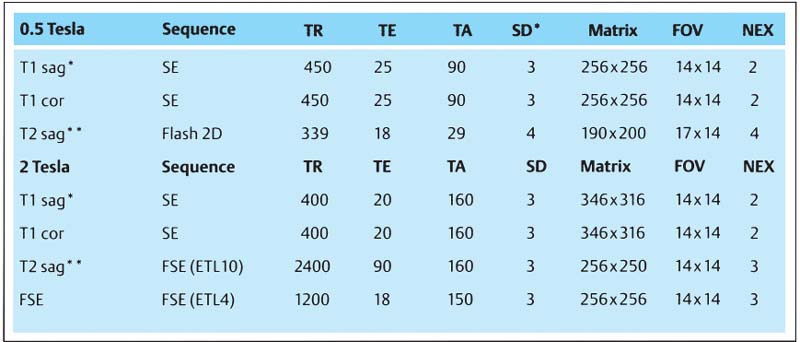
411 MR parameters for routine examination of the temporomandibutar joints
The figures given are for the MRT machine by Elscint with 0.5 and 2.0 teslas.
|
TR |
Repetition time |
|
TA |
Tilt angle |
|
Sl.Th. |
Slice thickness |
|
FOV |
Field of view |
|
NEX |
Number of repetitions |
|
* |
Closed and open |
|
** |
Open |
|
SE |
Spin echo |
|
FSE |
Fast spin echo |
412 MR tomography
Modern units use either a closed or open system. In the widely used closed systems the patient lies in a tube within which a static magnetic field uniformly aligns the protons of the tissue to be studied. Switching off a dynamic radio frequency Field causes the protons to revert to their original energy state. The electromagnetic energy this releases is received by special surface coils.
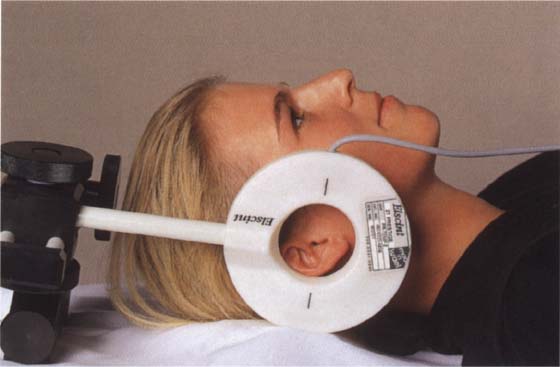
413 Patient position with a unilateral temporomandibular joint coil
The temporomandibular joint has a relatively low number of protons and therefore is a weak signal emitter. Therefore it requires a sensitive surface coil to produce an optimal image. Without this, it is impossible to produce an MR image that will provide sufficient information to be useful in treatment planning. The diameter of the coil should be 4-8 cm. Besides unilateral coils, there are also bilateral ones with which both joints can be recorded at the same time.
T1 – and T2-Weighting
The magnetizing vector in the tissue is rotated 90° in the xy plane by means of a high frequency (HF) impulse. At the end of the HF impulse, the protons relax back to their original energy level. The relaxation times T1 (spin lattice relaxation time) and T2 (spin-spin relaxation time) describe the change in magnetization in the z coordinate and the xy plane (Christiansen and Thompson 1990).
The smaller the T1 value of a tissue, the stronger its signal and the lighter the resulting image. Conversely, if the T1 value is large the image will be dark. Tissues with a large T2 value give a strong signal and light image and tissues with a short T2 time produce a weak signal and dark image.
By selecting the appropriate parameters the radiologist can make MR images that show either more T1 or more T2 characteristics. T1-weighted images are produced by using a short repetition time (TR <900-600 ms) and a short echo time (TE <20 ms). A T2-weighted MR image, on the other hand, is produced with a long repetition time (TR approximately 2000 ms) and a long echo time (TE approximately 80-120 ms) (Paiacios et al. 1990).
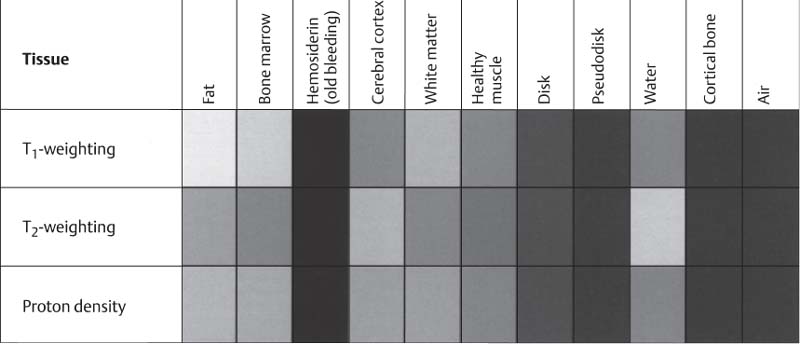
414 Signal intensity of different tissues in T1 – and T2-weighted MRIs
According to the signal intensity and the examination sequence, different types of tissue produce different values of gray. The shades of gray shown here correspond closely with those of the tissues in an actual MR tomogram.
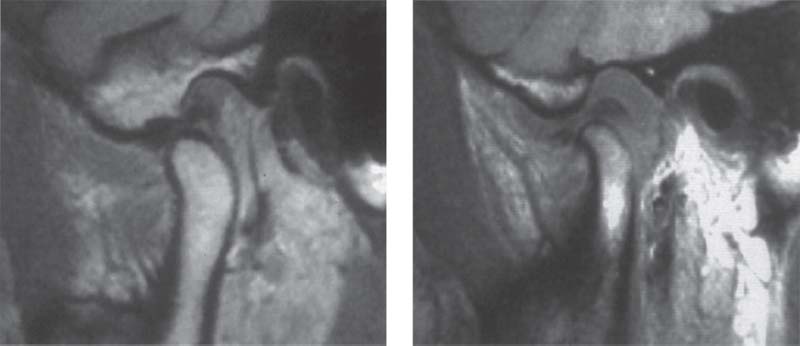
415 T1-weighted MRI
Left: Normal temporomandibular joint. The T1-weighted image is especially suited for providing excellent demarcation of the anatomical structures with optimal topographic resolution.
Right: Joint effusion. Although the anatomical structures can be clearly identified, the T1-weighted image shown here gives no indication of the intra-articular fluid.
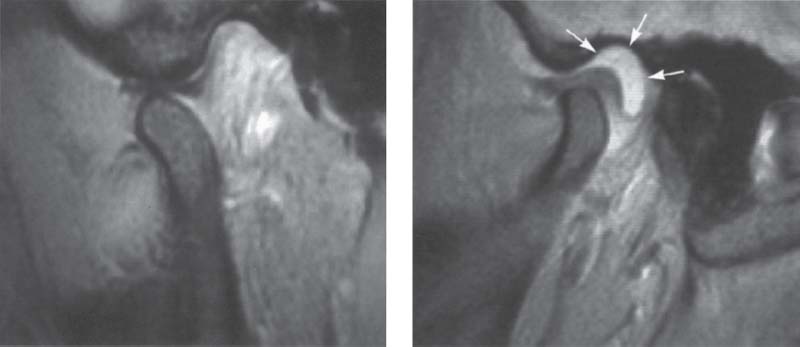
416 T2-weighted MRI
Left: Normal temporomandibular joint. Here the topographic resolution is less than in a T1-weighted image, but the individual structures are still recognizable.
Right: The same joint as shown above. Now the joint fluid (arrows) can be clearly seen. T2-weighted sequences are especially suited for identification of infections, edemas, and joint efussion and are therefore indicated as a basic procedure.
Selecting the Slice Orientation
Basically, MR images can be oriented to three planes: sagittal, frontal, and transverse (horizontal). In clinical radiology the frontal plane is also referred to as the coronal plane, and the transverse plane is called the axial plane. An image showing the temporomandibular joints in the axial plane is used not only for diagnostic purposes, but also for planning the sagittal slices. Sagittal exposures can be made as either paramedian slices or angled sagittal slices (Yang et al. 1992). Images made in a paramedian plane have two clinical advantages: First, in images made with the jaws closed and open, the two slices are exactly comparable. Secondly, artifacts caused by orthodontic bands or extensive fillings in the posterior teeth will be less than in angled slices because the rows of teeth do not lie in the plane of the slice.
For imaging the temporomandibular joint in the frontal (coronal) plane, the slice can be made in a pure frontal plane or at a small lateral angle. For the past 10 years we have been using angled slices in the frontal plane. The angulation is planned so that each slice is parallel with the long axis of one or the other condyle and perpendicular to the long axis of the disk. This method reduces the partial volume effect (Steenks et al. 1994. Chen et al. 1997).
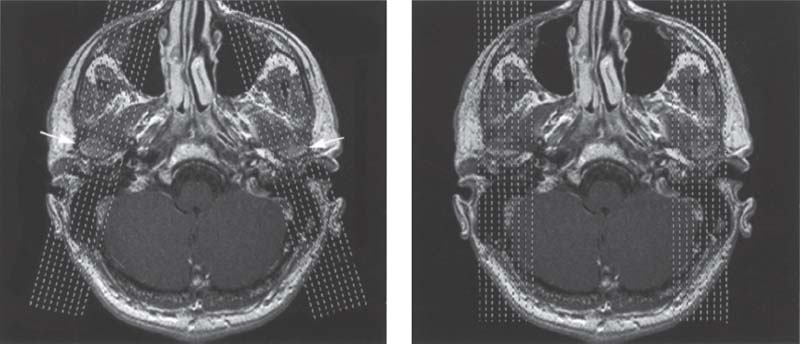
417 Slice alignment for sagittal images
For an MRI examination of the temporomandibular joint the first step is to make a horizontal orientation slice. In this plane the exact angulation of the condyles (arrows) can be determined. Basically, the sagittal slices can be made angled (left) />
Stay updated, free dental videos. Join our Telegram channel
VIDEdental - Online dental courses


