8
Measurement of severity and progression of toothwear
Toothwear belongs to the general classification of loss of dental hard tissues from the mouth. The Pindborg (1970) general classification of attrition (tooth-to-tooth contact), abrasion (third-body contact wear, e.g. toothbrush), erosion (chemical loss of surface contour, due to mineral acids) and dental caries (subsurface loss of hard tissue), which is perhaps the only true direct pathological process, still remains useful. These factors are very likely to overlap (see Chapter 1). Toothwear in all of its manifestations gives rise to changes on the surface anatomy of the tooth. Measurement of these changes is critical for assessment of the lesion severity and progress and for the effectiveness of any treatment or preventive regimes. To measure progression of dental erosion and attrition over time, profilometry offers a gold standard for the measurement and monitoring of toothwear. Two clinical cases where profilometry techniques were applied are presented later in this chapter.
NON-PARAMETRIC OR SEMI-PARAMETRIC APPROACHES
The first serious approach to measurement of loss of dental contour was made by Ryge and Snyder (1973), and adopted by the US Public Health Service (USPHS). This was a pure ranking or non-parametric approach based on A (alpha), B (beta), C (charlie), etc., with anatomical landmarks to guide the clinician when (say) A became B and B became C. It had much to commend it: it was fast, inexpensive and easily learnt by assessors. There are many variations of the Ryge chairside measurement system designed to meet special needs such as the studies in pure erosion. A very useful review of these kinds of indexes with appropriate anatomical landmarks is given by Bardesley (2008).
Leinfelder et al. (1986) and his colleagues took the Ryge system one step further by the creation of calibrated stone models with increasing toothwear in 100- μ m steps. Real clinical models could then be compared to these models with a better level of accuracy than the Ryge system. This was effectively a semi-parametric system of measurement.
PARAMETRIC MEASUREMENT OF TOOTHWEAR
Xhonga et al. (1972) used profile tracings from sectioned study models to estimate an average daily rate of erosion in cervical lesions. Despite treatment with sodium fluoride paste, approximately 7 μ m/d was recorded over 5 months from treated and untreated lesions.
The real problem of measurement of toothwear by profilometry is that volumetric loss of tissue has a complex shape which defies assessment by simple geometric calibration, such as a ‘ruler’ might give. The location and shape of this volume of loss are important for diagnosis and treatment. The answer to the problem of course lies in the capture of the entire anatomical tooth surfaces of the before and after time interval. These two images must now be fixed in space in the correct relation to each other, a processing known as ‘fitting’. Then the surfaces can be inspected (interrogated) for differences that occurred over the time interval from the point of view of extent of wear and location. This requires a digital technique with software facilities for computer image rendering, fitting and measurement.
Contact stylus technique
There are a number of displacement contact stylus techniques which are applicable to in vitro simulations of wear or clinical tooth contact roughness (Lambrecht et al. 1989). These are usually displacement styli, which are very accurate, but over a short range. One that is applicable to clinical wear is the null point stylus (Delong et al. 1985; Fig. 8.1).
Figure 8.1 Null point stylus fixed in space and the model of the tooth which moves underneath the stylus. Note with the digital scans rendered on the computer, giving the appearance of the tooth.
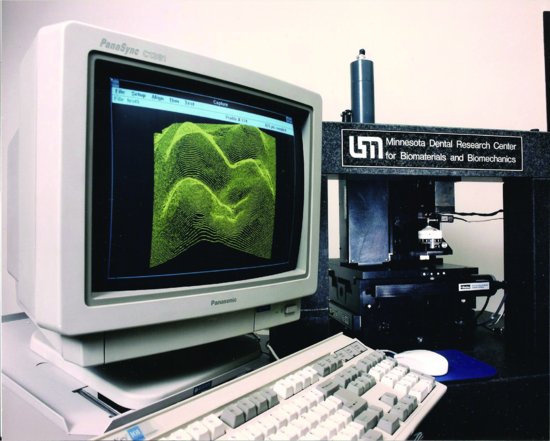
Here, the stylus is fixed in space and the clinical model of the tooth moves underneath the stylus, with the digital scan mapped out in the computer. A large number of scans can be covered with a grayscale rendition and the image of the tooth appears – a kind of clinical interface (Fig. 8.2).
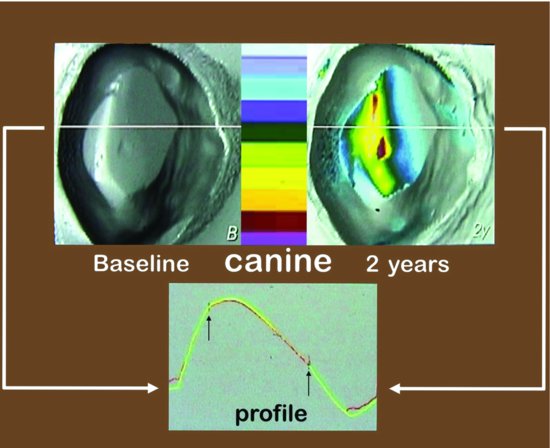
Figure 8.2 Wear on the incisal edge of a canine. The grayscaling shows the anatomical detail before (B), and wear is superimposed as a colour reference 2 years after baseline (2Y).
Fitting the computer models together
The fitting procedure of computer models is a key step and is in part a matter of clinical judgement. Necessarily, the worn model (after) will fit inside the original model (before). The clinician must identify the surfaces with no change or at least minimal change and initiate a least-squared-difference fit, which is then performed automatically by the software, as shown in Fig. 8.2 for profile 46. The renditions of the teeth show the differences due to tooth loss, which can now be displayed in many useful ways. The goodness of least-squared fit of the two models in part determines the accuracy of the measurement. With this accuracy, much more information of the wear process can be obtained than from chairside observation.
Optical techniques
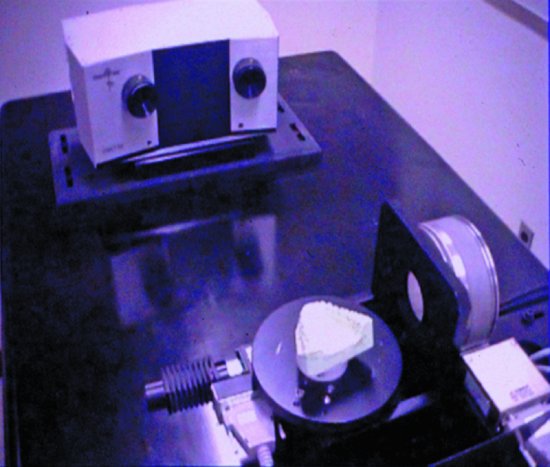
Optical techniques, including laser (Kramer et al. 2006) and white light (Delong et al. 2003), have advantages over a contact stylus in that they do not require as much attention to how the tooth model is mounted. However, as they are reflective techniques, they are very sensitive to the condition of the model or tooth surface. One such optical technique is shown in Fig. 8.3.
Figure 8.3 White-light digital profiler, with light being emitted from one port and detected by a CCD camera in the other. The reflective properties of the model are very important.
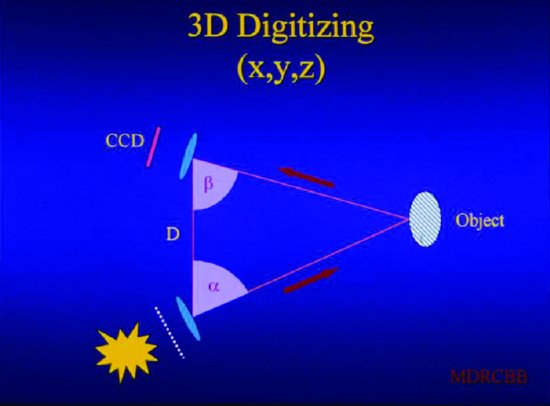
The triangulation method by which the profiler determines the anatomical location of the wear area is illustrated in Fig. 8.4. One hoped-for advance in this field is the emergence of hand-held digitisers, which are accompaniments to computerised restorative dentistry. These obviate the need for a stone model of the teeth, but do not yet have quite the accuracy of fixed extraoral digitisers. More importantly, it is very difficult to recover the files in a usable format for current wear measurement software. No doubt in future, hand-held devices will succeed fixed digitisers in this field.
Figure 8.4 Diagram of digital profiler, showing the three-point triangulation necessary to determine the anatomical location of the wear area.
Microcomputer tomography scanning method
All of the methods described so far, including straightforward chairside assessment, use line-of-sight observation. However, interproximal areas and areas of undercut cannot be assessed by line-of-sight methodologies. Using micro-computer tomography (micro-CT) scanning methods with good models this problem can be addressed. The micro-CT scanning method establishes the centre of gravity of the sample and then from a series of X-ray scans, calculates the X-ray absorption of every point within the sample. The result is a series of ‘slices’ presented as JPEG images, which are then finally assembled as a 3D model of the tooth. Micro-CT 3D models are extremely large files, and large computer facilities are required to manage them. The assembled dental models can be used to address a number of problems, including prototyping (Magne 2010) and quantitative dental anatomy (Pintado et al. 2007). Most usefully for wear measurement, the exterior contour of this model can be ‘fitted’ exactly as described for the line-of-sight models above, provided software is in a compatible language. The advantages of micro-CT profiling are shown in Fig. 8.5, where the undercut areas of a cervical abrasion are now included in the complete rendition of the lesion. Complete numeric dimensions can also be provided for the lesion and chosen slices can be highlighted for special attention (Fig. 8.5).
REPORTING TOOTHWEAR
Volume reporting
Reporting toothwear as a volume loss (mm3) is the most complete description of the process. Volume loss is a material property of the substrate only, such as that of composite, enamel or dentine. Further, there is a direct correspondence between volume loss and the cause of the wear, such as chemical, abrasive or their combinations, and there is usually reasonable linearity between cause and effect with respect to volume loss due to toothwear. To report volume loss, some digital method is necessary. Typical values for an occlusal composite are 0.05 mm3/y and for a severe cervical abrasion, 0.85 mm3/y over 26 years.
Other reporting methods
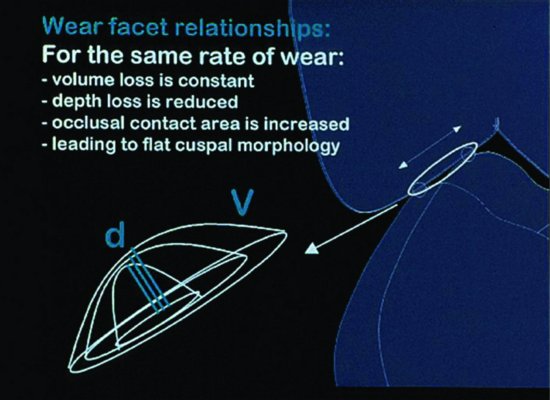
Toothwear can also be reported as a depth loss or as an increase in area of contact, especially in areas of occlusal contact. In nominal terms, depth × area = volume. Reporting depth loss is much favoured by clinicians because it affects the clinical height of the tooth, and if the whole occlusal surface is involved then the facial height may be reduced. The approximate relationships between the different methods of reporting rate of wear are shown in Fig. 8.6.
Figure 8.5 Micro-computer tomography–derived model of long-term cervical abrasive wear. Note the inclusion of undercut in the total profile of the lesion.
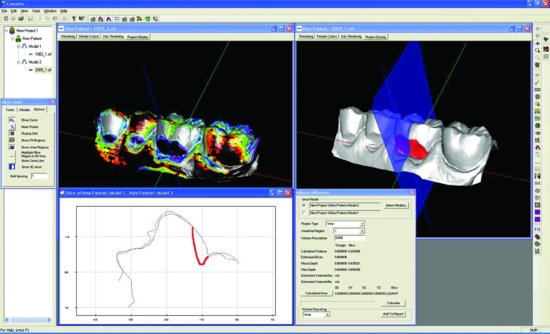
Figure 8.6 Approximate relationships between the different methods – volume, depth and contact area – of reporting wear. These observations refer to rates of change not to absolute values of wear. (Diagram courtesy of Dr. P. Magne.)
Conservation of facial height
It might be thought that a discussion of different methods of wear reporting is for those with an absorbing interest in mathematics – nothing could be further from the truth, for the following reasons. The young occlusion is characterised by well-formed cusps, with a cusp to fossa relationship under conditions of normal occlusion (Fig. 8.7). Especially in high-wearing surfaces there is a steady loss of hard tissue, which can be expressed as volume. However, there are increasing areas of occlusal contact and dentine exposure. This must mean that the rate of loss of depth lags behind the same wear expressed as rate of volume loss (see Fig. 8.6). But as has been pointed out, depth loss affects the clinical crown height and facial height where many tooth are involved. Loss of occlusal surfaces or lower permanent first molars and of palatal surfaces of upper permanent incisors occurs in children from the initial establishment of the occlusion in the mixed dentition (see Chapter 10).
Canines and premolars later lose cuspal form under these conditions, and with increasing patient age, the process advances to group function. This process is easily seen in Fig. 8.8, where the loss of buccal cusp morphology is demonstrated over an 8- and 11-year period. Well-formed cusps provide ample surfaces for increasing area of contact due to wear so that even with high volume loss corresponding loss due to depth is much less. This was demonstrated by Pintado et al. (1997) in a 2-year wear study in young adults. Facial height is conserved in young patients with high wear rates by passive eruption of the worn teeth. This position is reversed in older patients, with loss of cuspal morphology and a flat occlusal table. By this stage, the area of contact is fixed, hard tissue volume loss is fully reflected in a corresponding loss in depth, and facial height is no longer conserved.
Figure 8.7 The occlusion of a young adult characterised by well-formed cusps, with a cusp to fossa and marginal ridge relationships.
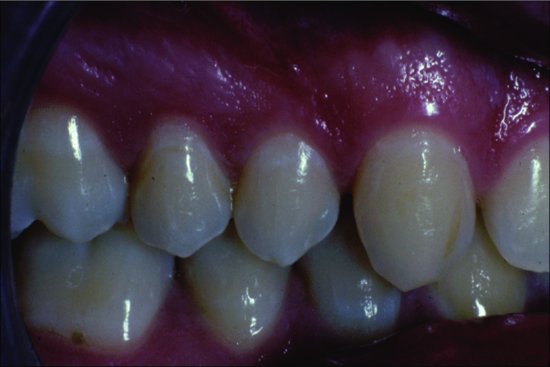
Figure 8.8 Loss of buccal cusp morphology over an 8- and 11-year period. This is due to attrition from cuspal guidance. Note the breached enamel and the progressive dentinal surface involvement. Wear due to mastication of food is minimal and represented by the small blue area on the buccal incline of the palatal cusp.
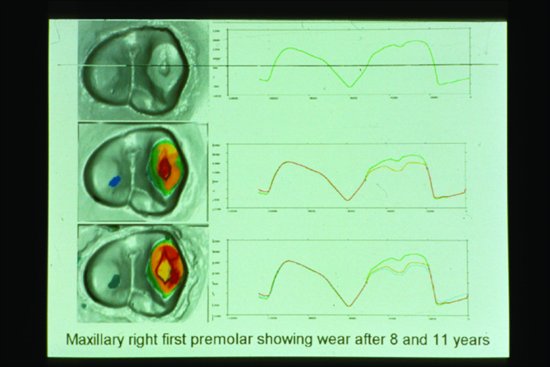
Table 8.1 What can before and after models show?
|
Study models
Whilst study models have limited application for patients with dental caries, unless major rehabilitation in cases of rampant caries is planned, for patients with toothwear, diagnostic study casts are crucial. Impressions for study models make quick and reliable records of The Stages of Wear
Stay updated, free dental videos. Join our Telegram channel
VIDEdental - Online dental courses


