Nutrition for the Oral and Maxillofacial Surgery Patient
Fasting- and Starvation-Induced Malnutrition Physiology
Trauma-, Stress-, and Sepsis-Induced Malnutrition Physiology
Substrate Depletion and Requirements
Assessment Tools for Diagnosis of Nutritional Failure
Nutritional Support Methods for Patients with Functioning Gastrointestinal Systems
Indications for the Use of Nutritional Therapy
Oral Methods of Nutritional Therapy
Most patients are well nourished before their visit. However, those patients with chronic illness, alcoholism, or anorexia and those who are older, institutionalized, or homeless may be in various stages of malnutrition. The mortality and morbidity of these malnourished patients is clearly higher than well-nourished patients who have sustained maxillofacial or multisystem trauma, or are undergoing the same operation. Evaluation and correction of malnutrition are time-consuming and not dramatic, yet its correct recognition and application can reduce postoperative complications. This chapter will compare the physiology of slow compensated starvation to the all-consuming hypermetabolism of the critically injured trauma victim. As is true in many clinical areas, the literature can be contradictory and can offer opposing opinions. Some believe that early enteral feeding in trauma patients results in decreased morbidity and complications.1 Others conclude that nutritional support is currently overused, improperly used, and has failed to show an improvement in clinical outcome.2
Fasting- and Starvation-Induced Malnutrition Physiology
A healthy 75-kg man normally stores 200 to 300 g of carbohydrate, equal to 800 to 1200 kcal (4 kcal/g), mostly as glycogen.3 Fat is normally 15% to 30% (11 to 22 kg) and protein 14% to 20% (10 to 15 kg) of body weight. The average total caloric reservoir is therefore approximately 200,000 kcal, of which 75% is fat. In the complete absence of nutritional intake, an otherwise healthy person could catabolize 1 to 2 g/kg of protein and 2 to 3 g/kg of fat/day. Theoretically, this caloric reserve could sustain life for 3 to 5 months. Realistically, death would occur after burning about 140,000 kcal (75% body fat and 50% body protein).4
Starvation involves a cascade of substitution of energy substrates as the body attempts to conserve energy resources and cellular functions. With the onset of starvation, glycogenolysis provides most of the necessary blood glucose. The available glycogen stores are rapidly depleted, and amino acids become the prime source of carbon for hepatic gluconeogenesis. The amino acid sources are muscle, connective tissue, and visceral proteins. As starvation continues, the rate of gluconeogenesis diminishes, coincident with a decrease in metabolic rate and increase in ketone use as fuel by the central nervous system. The early loss of body mass is slowed and accompanied by a decrease in urinary nitrogen excretion. In a healthy patient, nitrogen intake equals urinary excretion, about 10 to 30 g/day. In fasting starvation, urinary nitrogen excretion falls to 3 to 4 g/day, reflecting protein and therefore amino acid conservation.4 Because hepatic and GI function are more acutely affected by decreased protein intake, compromised function of both will rapidly develop. One kg of muscle equals roughly 800 kcal, and 1 kg fat equals 7000 kcal, resulting in greater weight loss when muscle is used as an energy source. This is the basis for the correlation of anthropometric measurements with malnutrition (see later).5
Trauma-, Stress-, and Sepsis-Induced Malnutrition Physiology
Malnutrition can be thought of as a spectrum. One end is the conservative rationing of body energy resources in fasting starvation. The other end is hypermetabolism induced by stress, such as trauma or sepsis. This hypercatabolic state is a neuroendocrine-mediated response to dead tissue, injured tissue, severe perfusion deficits, and invading microorganisms.6 The components of the response are the CNS, macroendocrine hormones, and microendocrine cytokines.7 The macroendocrine mediators are the anti-insulin, counterregulatory stress hormones—cortisol, glucagon, and catecholamines. Together, their actions are considered synergistic in this response.8 Especially in large wounds, such as cutaneous burns, the microendocrine response is mediated on a cellular level by interleukin-1, tumor necrosis factor, and interleukin-6.9 However, the total degree and severity of the hypermetabolic response cannot be predicted based only on the severity of the injury.
The manifestations of the neuroendocrine response are increased basal metabolic rate, increased core temperature, increased oxygen consumption, hyperdynamic circulation, loss of lean body mass, reduced insulin release, marked lipolysis with reduced hepatic ketogenesis, increased gluconeogenesis unresponsive to glucose administration, increase in lactate and pyruvate production and release, increased amino acid oxidation and efflux from peripheral stores, increased hepatic protein synthesis, and ureagenesis.7,10 These hypermetabolic responses can be duplicated in normal patients who are given levels of epinephrine, cortisol, and glucagon in concentrations seen in stressed patients.11 After activation, the hypermetabolic response peaks at 48 to 72 hours. It then subsides over another 3 to 4 days. Loss of important vitamins, trace elements, and minerals occurs very rapidly. Malnutrition will result within days. Complications such as infection will prevent the hypermetabolic response from subsiding. A vicious circle may develop because hypermetabolic patients have increased susceptibility to infection and poor wound healing. The response will once again subside if these complications can be controlled. With repeated episodes or persistent hypermetabolic state, organ failure will result.7 End-stage organ failure is manifested by liver failure, triglyceride intolerance, rapid rise in lactate levels, reduced amino acid clearance, reduced hepatic protein synthesis, and marked increase in catabolism, with ureagenesis with prerenal azotemia. Once this occurs, it is unresponsive to any nutritional supportive efforts.12 Table 3-1 is a summary of fasting starvation compared with hypermetabolic catabolism.
TABLE 3-1
Physiologic Summary of Starvation to Hypermetabolism
| Characteristic | Fasting Starvation | Hypermetabolic Catabolism |
| Neuroendocrine activation | − | + |
| Resting energy expenditure | − | ++ |
| Protein catabolism | + | +++ |
| Protein anabolism | ||
| Total body | − | − |
| Hepatic | + | +++ |
| Amino acid oxidation | + | +++ |
| Ureagenesis | + | +++ |
| Gluconeogenesis | + | +++ |
| Ketone production | ++++ | + |
| Malnutrition development rate | + | +++ |
| Simple mathematical total | 7 | 21 |
(From Cerra FB: Nutrition in trauma, stress and sepsis. In Shoemaker WC, Ayres S, Grenvik O, et al, editors: Society of Critical Care Medicine: Textbook of critical care, ed 2, Philadelphia, 1989, WB Saunders.)
Substrate Depletion and Requirements
Given the spectrum from fasting starvation to hypermetabolic catabolism, the clinician must understand the difference between nutritional and metabolic support, as described by Cerra.7 In both, the patient’s energy and substrate requirements must be met. The proper nutritional support, however, is dependent on how the patient’s neuroendocrine axis was activated. In fasting starvation, the hormonal response is activated not by starvation, but by the reintroduction of nutritional support. In stress the hormonal response is activated by the stress insult and subsequent nutritional support. Nutritional support therapy of the stressed hypermetabolic patient is more appropriately termed metabolic support because the substrate doses are adjusted to accommodate the metabolic response to injury. Table 3-213,14 compares substrate use in starvation to hypermetabolism.
TABLE 3-2
Substrate Use in Starvation Compared with Hypermetabolism
| Substrate | Fasting Starvation (Nutritional Support) | Hypermetabolism (Metabolic Support) |
| Carbohydrate | Maximum usable glucose is 5 mg/kg/min 20 nonprotein kcal/kg/day effective 150 : 1 nonprotein cal/g nitrogen or greater in diabetics; fat can replace glucose |
Resting energy expenditure and oxidation Glucose production is increased, with normal peripheral uptake Glucose entrance into the Krebs cycle is reduced Reduced fraction of total caloric production is from glucose Decreased ability of exogenous glucose to reduce the rate of gluconeogenesis In stress states, the wound itself has an extreme requirement for glucose |
| Fat | Major long-term energy source in starvation; 10% of energy requirement should be fat Necessary to prevent fatty acid deficiency secondary to insulin inhibition of lipolysis from high glucose infusions 2-3 g/kg/day of fat supplementation can cause hepatic steatosis7 |
75%-90% of energy supplied is by oxidation of fat Plasma changes diagnostic of essential fatty deficiency present from onset of stress Fatty acid intolerance develops in higher levels of stress; important to monitor triglyceride clearance |
| Protein | Body attempts to spare the amino acid reserve by using other sources of carbon for energy | Decreased total body protein synthesis Increased hepatic protein synthesis Increased catabolism, increased amino acid oxidation (up to 30% of caloric expenditure in high-level stress) Exogenous amino acids ineffective in reducing rate of catabolism Branched-chain amino acids constitute most of the amino acid oxidation Amount of muscle catabolism related to brain’s need for glucose, rather than the wound Estimated 40 mg/kg/day nitrogen required to avoid negative balance Resultant lowering of nonprotein calorie-to-nitrogen ratio to 100 : 1 |
Adapted from references 7, 13, and 14.
Amino Acids
Glutamine and arginine are semiessential amino acids that are important in times of stress and injury. Glutamine is significantly upregulated and serves as a nitrogen donor important in the formation of ammonia and in the control of acid-base balance by the kidney, as well as other anabolic processes. Glutamine is also an important amino acid for cellular energy—most significantly, for various immunologic cells and enterocytes lining the GI tract. In a hypermetabolic state, glutamine supplementation becomes essential for preventing muscle catabolism and muscle glutamine depletion. Arginine plays an important role in cell division, the healing of wounds, ammonia excretion, immune function, and the release of hormones. Branched-chain amino acids (e.g., leucine, isoleucine, valine) have been shown to have anticatabolic effects in muscle, but there is no evidence that supplementation after injury is beneficial.15
Assessment Tools for Diagnosis of Nutritional Failure
Clinical Assessment
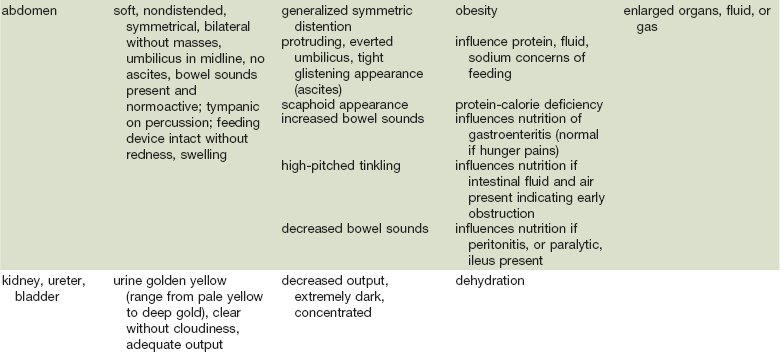
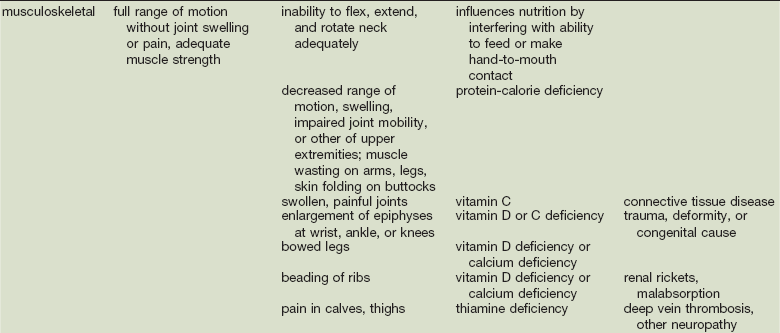
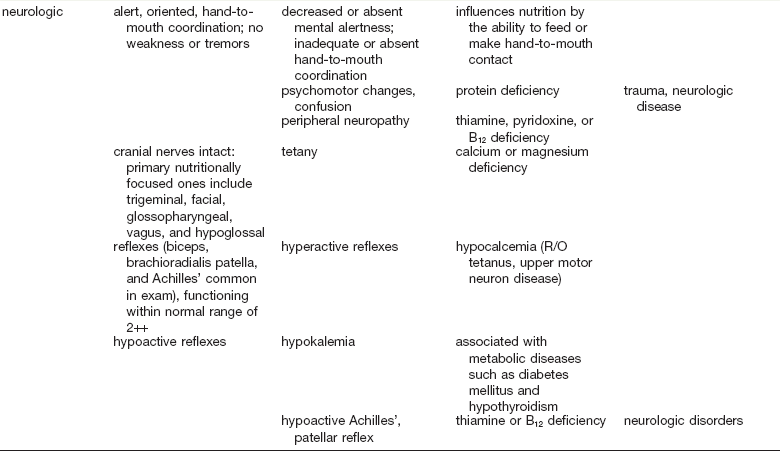
As in many areas of clinical diagnosis, there are no reliable absolute methods for the measurement of nutritional failure. Most of the methods available are too difficult or tedious to use in the clinical arena. Most produce results no better than a well-considered clinical judgment based on history and physical examination.18,19 Table 3-3 summarizes the physical findings of malnutrition.20
TABLE 3-3
Nutrition-Focused Physical Examination
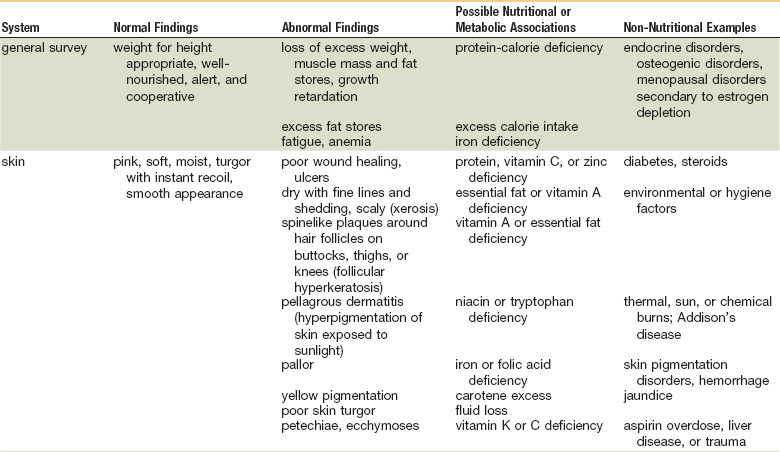
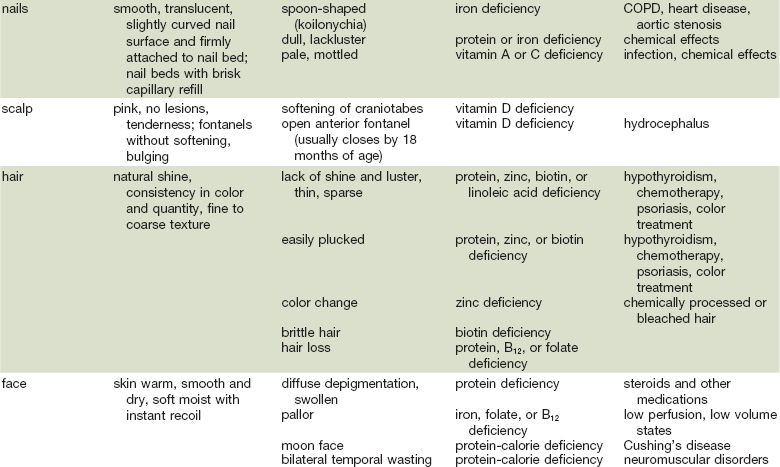
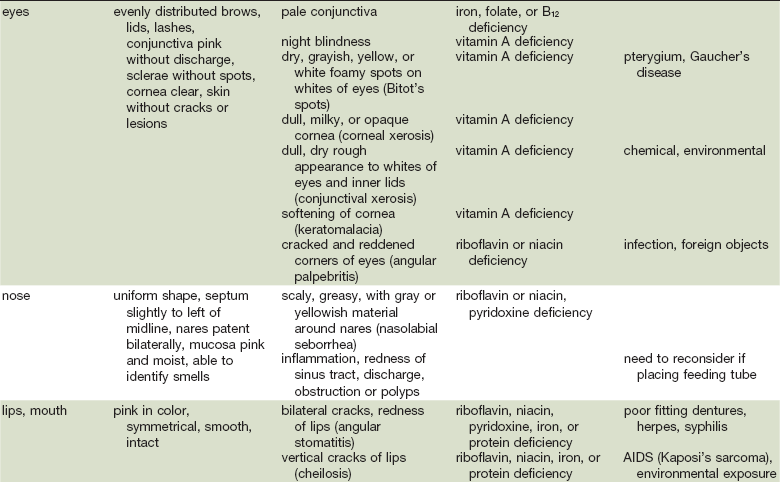
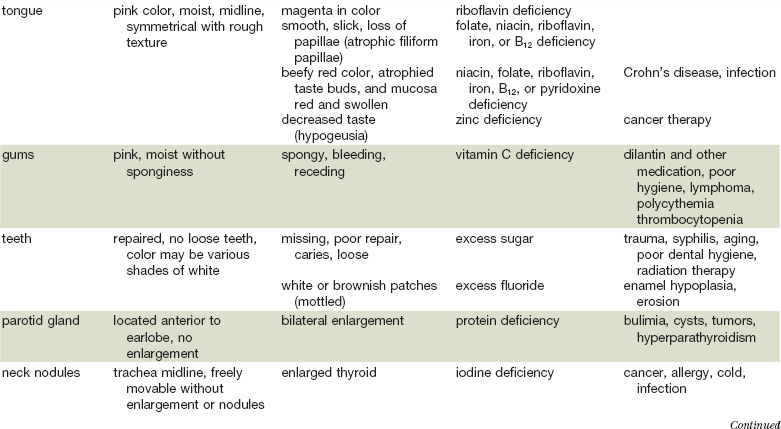
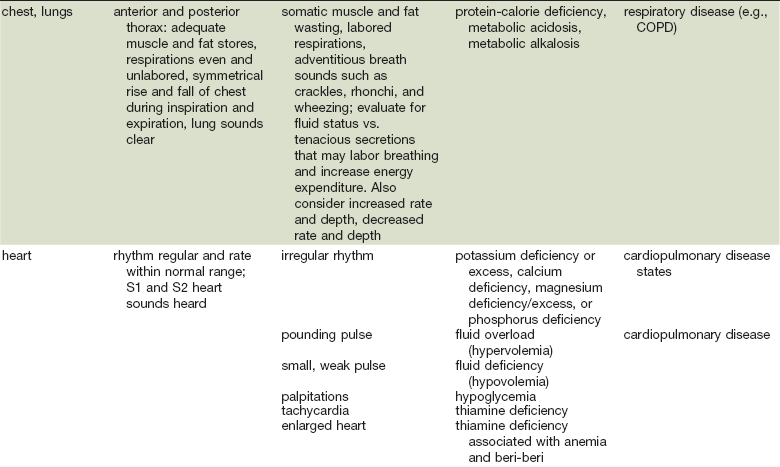
COPD, Chronic obstructive pulmonary disease.
Adapted from Hammond K: Physical assessment: A nutritional perspective. Nurs Clin North Am 32:779, 1997.
Ideal Body Weight
A medical history and review of systems revealing nausea, anorexia, diarrhea, or weight loss is suggestive of nutritional abnormality. Change in body weight, intentional or unintentional, is important. Normal ideal body weight (IBW) for patients can be calculated by the formulas21:
• Healthy males: 106 lb for initial 5 feet, plus 6 lb for every inch over 5 feet, plus 10% if over 50 years old.
• Healthy females: 100 lb for initial 5 feet, plus 5 lb for every inch over 5 feet, plus 10% if older than 50 years.
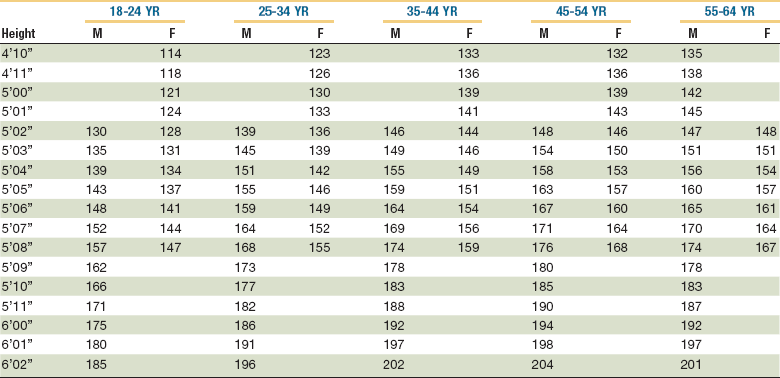
A decreasing ratio of actual to normal weight reflects increasing malnutrition. Greater than 80% to 90% is mild malnutrition, 70% to 85% is moderate malnutrition, and less than 75% is severe malnutrition.4 As an alternative, the U.S. National Center for Health Statistics has compiled normal tables of weight as a function of height for men and women (Table 3-4).
Body Mass Index.

A BMI of 26 to 27 is thought to carry moderate health risk and a BMI of 30 increases the risk of death from any cause by 50% to 150%, according to some estimates. The average American woman has a BMI of 26; fashion models typically have BMIs of 18. Conversely, a BMI of less than 18.5 has been proposed as an indication to screen for malnutrition; a BMI less than 15 is also associated with increased mortality.22
Anthropometric Measurements.
Anthropometric means the study of human body measurements on a comparative basis. When applied to nutrition, anthropometric measurements estimate stores of subcutaneous fat and lean skeletal muscle mass, which are assumed to reflect protein and caloric intake.23 Because the comparative control data are based on healthy subjects, clinical data may not apply to trauma patients. Subscapular skin fold, triceps skin fold, and midarm muscle circumference are some of the measurements used for nutritional estimates. Some anthropometric measurements have been combined together, or with laboratory data, to create predictive indices. The prognostic nutritional index and the creatinine height index have been correlated with postoperative complication rates.24
Energy Expenditure
Estimation of energy expenditure and requirements is the first step in determining the nutritional needs of a patient. The balance between energy intake and expenditure determines the daily energy requirements (calories).16 Underestimation, and subsequent underfeeding, is associated with delayed wound healing, organ failure, and infection.25 Overfeeding can produce hyperglycemia, increased carbon dioxide production, respiratory failure, and hepatic steatosis.26 Energy requirements are dependent on a number of variables, such as body surface area, age, gender, and clinical disease state. Energy expenditure is the body’s need for adenosine triphosphate (ATP) to meet metabolic needs. Total energy expenditure (TEE) is the sum of basal energy expenditure (BEE), the thermic effect of food, physical activity, and the disease process itself. BEE is further defined as the energy expended by a patient in the resting, nonstressed state after an overnight fast and is commonly referred to as resting energy expenditure (REE) in hospitalized patients.27 In situations in which measured energy expenditure is not readily attainable, an estimated caloric requirement may be used (104.67 to 146.54kJ/kg of ideal body weight); however, more sophisticated approaches to measuring requirements exist.16
Indirect Calorimetry.
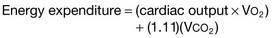
The gold standard of assessment of energy expenditure is indirect calorimetry. This technique is expensive, requires trained personnel, and has significant error at higher inspired oxygen concentrations.28 Indirect calorimetry calculates a patient’s energy expenditure by measuring oxygen consumption and carbon dioxide production. It can be performed in spontaneously breathing and mechanically ventilated patients; however, inaccuracy occurs in patients with an inspired oxygen concentration higher than 60%.27 This method measures REE and reflects the clinical situation at the time the measurement is made; it may not reflect true energy expenditure over a 24-hour period.7,19
Estimating energy requirements is necessary in clinical practice when indirect calorimetry is impractical.29 Several standardized prediction equations to measure energy expenditure have been developed, with the intent to estimate energy requirements accurately in the absence of indirect calorimetry. Each has its limitations, and none have been shown to correlate statistically with indirect calorimetry on a consistent basis.
Harris-Benedict Equation.
This equation was published 85 years ago and was developed through the analysis of indirect calorimetry obtained from healthy, young, lean body mass male and female volunteers. This equation, therefore, underestimates the energy requirements of trauma patients. Modifiers were developed to account for this; however, it is thought that the modifiers significantly overestimate requirements.16,30,31 Table 3-5 illustrates some stress factor modifiers.
TABLE 3-5
Stress Factor Modifiers for Estimating Energy Expenditure
| Injury | Factor |
| Simple starvation | 0.85 |
| Elective surgery | 1.05-1.15 |
| Sepsis | 1.2-1.4 |
| Closed head injury | 1.3 |
| Multiple trauma | 1.4 |
| Major burn | 2.0 |
Data from Malone AM: Methods of assessing energy expenditure in the intensive care unit. Nutr Clin Pract 17:21, 2002.


Ireton-Jones Equation.
Another predictive equation is the Ireton-Jones equation.32 Two hundred patients with a variety of medical and surgical diagnoses were measured by indirect calorimetry. Ventilator-dependent patients had a higher REE than spontaneously breathing patients.27
The Ireton-Jones equation for spontaneously breathing patients is as follows:

The Ireton-Jones equation for ventilator-dependent patients is as follows:

where A = age (years), W = weight (kg), O = presence of obesity (>30% above ideal body weight; absent = 0, present = 1), T = diagnosis of trauma (absent = 0, present = 1), B = diagnosis of burn (absent = 0, present = 1), a/>
Stay updated, free dental videos. Join our Telegram channel
VIDEdental - Online dental courses


