2 Mechanics and Mechanical Testing of Orthodontic Materials
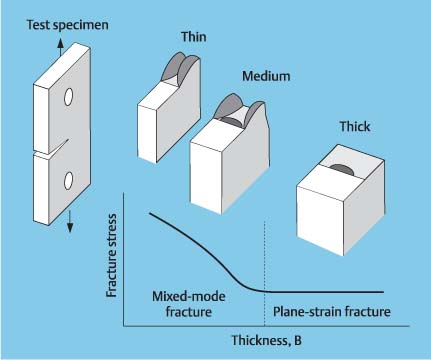
Appearance of the fracture surface for a notched tensile test specimen as the fracture mode changes from a mixture of plane stress and plane strain to purely plane strain conditions
Mechanical Testing Methods for Orthodontic Materials
Mechanical Testing Machines and Experimental Procedures
Specific Tests for Evaluation of Mechanical Properties of Orthodontic Materials
Introduction
Basic knowledge of solid mechanics is important for an appreciation of biomechanical principles used in tooth movement and for understanding the important bending and torsion tests used to measure the mechanical properties of clinical relevance for orthodontic wires. Mechanical testing is employed in the biomaterials laboratory to evaluate the important properties of metallic, ceramic, and polymeric orthodontic materials that were discussed in Chapter 1.
In this chapter the major concepts for bending and torsional deformation of solids, and the origin of mathematical relationships that have been used to evaluate the mechanical properties of archwires, will be presented. The two types of universal mechanical testing machines will be described, followed by consideration of experimental procedures for laboratory measurement of some mechanical properties of orthodontic materials. Particular emphasis will be placed upon bending tests, the evaluation of adhesive bond strength, and the measurement of fracture toughness. The diametral compression test and the measurement of fatigue behavior will also be discussed. Extensive information about other mechanical property measurements for dental materials is available in the Craig textbook.
Bending Deformation
Figure 2.1 shows a segment of a uniform rectangular beam subjected to pure elastic bending, i.e., acted upon only by a bending moment that is of insufficient magnitude to cause permanent deformation. The beam may be considered to represent an orthodontic archwire. In order to have static mechanical equilibrium, the ends of this segment are acted upon by equal and opposite bending moments. From examination of Figure 2.1 it is apparent that, at the top and bottom outermost surfaces, the length of the beam has experienced an increase (tensile strain) and a decrease (compressive strain) parallel to the axis, respectively. For a symmetric beam (round, rectangular, or square cross section), the material at the midplane does not experience any deformation. The un-deformed midplane of the elastically bent beam is termed the neutral surface, and the trace of the neutral surface on the cross section perpendicular to the beam axis is termed the neutral axis. Both the neutral surface and neutral axis are indicated in Figure 2.1.
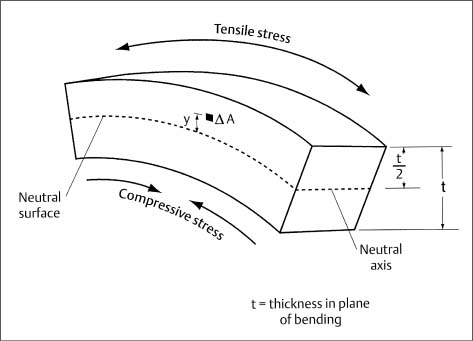
Fig. 2.1 A portion of a symmetric rectangular beam subjected to pure elastic bending. The location of the neutral surface is indicated, along with the position of the neutral axis on an axial cross section of the beam. An element of area (ΔA) located a distance (y) from the neutral surface is also shown
Figure 2.2 shows that the stress in the beam varies linearly with distance from the mid-plane, reaching maximum values at the outermost surface. The corresponding strain is obtained by dividing the stress by the modulus of elasticity (Young’s modulus) of the beam material, which has the same value for tensile and compressive stress. In textbooks on solid mechanics, force and moment balances are performed on a section of the beam (free-body diagram) to derive the elastic flexure formula. It is also assumed that plane surfaces perpendicular to the undeformed beam axis remain planar after the elastic deformation. The relationship between the stress (σ) developed in the beam as a function of the bending moment (M) and distance from the neutral axis (y) is

where I represents the moment of inertia of the cross section. The moment of inertia is a geometric quantity that corresponds to the resistance of a particular cross section to bending and is given by the relationship:
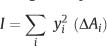
where the yi are the distances of the elemental areas (ΔAi) from the neutral axis and the summation is over all the elemental areas comprising the cross section of the beam. The contributions to the moment of inertia are greatest for the elemental areas farthest from the neutral axis, since each area is multiplied by the square of its distance from this centerline of the cross section (for a symmetric beam). This principle is exploited with the rectangular I-beam used in the construction of buildings, where the maximum amount of material is located farthest from the center (neutral axis) of the beam.
Since the largest value of y corresponds to the greatest distance (c) from the neutral axis to the surface of the beam, the maximum stress developed by the bending moment is given by

The section modulus (Z) is often defined as

so that the maximum stress in the beam can be written alternatively as

This expression is convenient to use when comparing the maximum stress developed in a series of orthodontic wires of varying cross-sectional dimensions. The relationship is analogous to the equation that defines normal stress (tensile or compressive) as the quotient of force and cross-sectional area. For bending, the role of force is assumed by the moment, and the section modulus provides information about the cross-sectional geometry of the beam.
Writing an integral expression for the moment of inertia as the elemental areas become infinitesimally small, it can be shown that for a round beam of diameter (d):

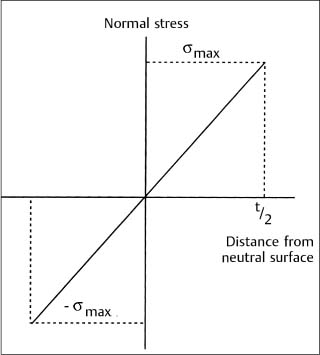
Fig. 2.2 Variation of the compressive and tensile stress with distance from the midplane of the bent symmetric beam in Figure 2.1
| Dimensions (inch) | Dimensions (mm) | Moment of inertia (I)(10−4 mm4) |
| 0.012a | 0.305 | 4.25 |
| 0.016a | 0.406 | 13.3 |
| 0.020a | 0.508 | 32.7 |
| 0.040a | 1.016 | 523 |
| 0.016 × 0.016b | 0.406 × 0.406 | 22.6 |
| 0.018 × 0.025b | 0.457 × 0.635 | 50.5c |
|
|
|
97.5d |
b Cross-sectional dimensions of rectangular wire.
For a rectangular beam of width w and thickness t in the direction of bending, the moment of inertia is given by

Because of the dependence of I on the fourth power of diameter and the cube of thickness, there can be considerable differences in the resistance to bending of orthodontic archwires having different cross-sectional dimensions.
For comparison, the values of moment of inertia for several archwire sizes are listed in Table 2.1. The enormous differences in I are evident for the four round wires shown. The greater value of I for a square wire, compared to a round wire of the same cross-sectional dimensions, can be seen from the examples of the 0.406 mm diameter round wire and the 0.406 mm × 0.406 mm square wire. The bending direction has a substantial effect on the value of I for a rectangular wire, as shown for the 0.457 mm × 0.635 mm wire bent in the edgewise (t = 0.635 mm) and flatwise (t = 0.457 mm) directions.
For a given value of moment or load, it can be shown that the elastic bending deflection of a beam (or archwire segment) is inversely proportional to its length. Consequently, the stiffness in bending for an archwire segment of length l is given by the following proportionality
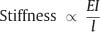
where the elastic modulus E represents the alloy contribution and I/l represents the segment geometry (cross section and length) contribution to stiffness. This relationship is useful for comparing the relative values of stiffness in bending for round and rectangular archwires of different alloys, using the preceding expressions for I and values of E given in Chapter 4.
Torsional Deformation
Figure 2.3 shows the stress distribution over the cross section of a circular beam (round orthodontic wire) of radius c subjected to torsional loading in the elastic range. It can be seen that the beam experiences shear stress, which varies linearly from zero at the center to a maximum value (τmax) at the surface. With the assumption that plane sections perpendicular to the beam axis remain plane after application of the torque (i.e., no warping of these planes occurs), a balance of the torque developed on all of the elemental areas (ΔAi) of the cross section and the external torque (T) yields the relationship

where J is the polar moment of inertia, which is given by
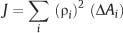
The ρi are the radial distances of the ΔAi from the center. In the limit, as the elemental areas become infinitesimally small, the polar moment of inertia for a round beam is

For a round beam, the value of J for torsional loading is thus twice the value of I for bending. Accordingly, the values of J for the four round archwires in Table 2.1 are obtained by doubling the indicated values of I.
Expressions for the section modulus (ZT = J/c) and maximum shear stress in torsion (τmax = T/ZT) for round beams can be written that are analogous to those previously shown for bending deformation.
The solid mechanics analysis for torsion of rectangular beams is mathematically complex because planar sections perpendicular to the beam axis become warped, as shown in Figure 2.4. The shear stress distribution in the twisted rectangular beam is illustrated in Figure 2.5, where it can be seen that the shear stress is zero at the corners and maximum at the midpoints of the long sides. The maximum shear stress developed in a rectangular beam subjected to a torque T can be written as:
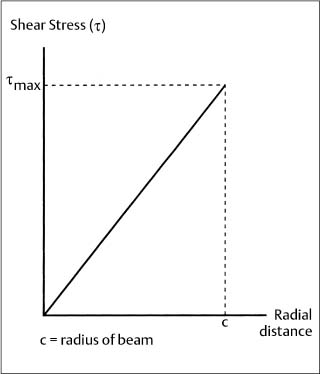
Fig. 2.3 Variation in elastic stress for a circular beam subjected to torsional loading
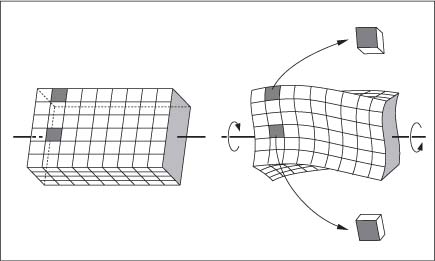
Fig. 2.4 Warping of a rectangular beam due to torsion. (From Popov, 1968)

where b and c are the long and short dimensions, respectively, of the cross section and α is a parameter that depends upon the ratio (b/c). Values of α for three different (b/c) ratios that are useful for archwire and bracket base dimensions are given in Table 2.2.
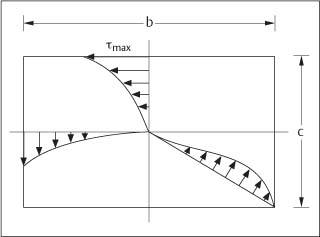
Fig. 2.5 Shear stress distribution in a rectangular beam subjected to torsion. (From Popov, 1968)
Mechanical Testing Methods for Orthodontic Materials
Mechanical Testing Machines and Experimental Procedures
Two types of sophisticated mechanical testing machines are used in the dental materials research laboratory. These machines are classified as screw-driven or servohydraulic, depending upon the method employed to move the crosshead and apply loads to the test specimen. A load cell senses the amount of force, and the raw data (the testing machine output) are typically plotted as load on the vertical axis and time or distance of crosshead movement on the horizontal axis. In order to plot stress-strain diagrams (Chapter 1), the values of load and change in specimen length must be converted to stress and strain, respectively. With the newer computer-controlled machines, the original specimen cross-sectional area and gauge length can be programmed, so that a direct plot of stress and strain is obtained.
The screw-driven machines (originally developed by Instron Corporation, Canton, MA, USA) have a large screw located at each end of the crosshead, whereas the servohydraulic machines (originally developed by MTS Systems Corporation, St. Paul, MN, USA) use the pressure of oil pumped into a hydraulic piston to move the crosshead. Because these mechanical testing machines can be employed for tension, compression, bending, or torsion tests, depending upon the specimen fixtures purchased or designed by the experimenter, they have frequently been called universal testing machines in the research literature. Either type of machine will yield accurate values of the mechanical properties of orthodontic materials under the usual laboratory conditions of a single testing cycle. The servohydraulic machines are necessary for cyclic fatigue tests (discussed later in this chapter) performed at other than very slow rates.
Both types of mechanical testing machines are often referred to as constant strain-rate machines, because the rate of movement of the crosshead can be accurately set to designated displacement speeds (typically in units of mm/sec). If the gauge length of a specimen (Chapter 1) is expressed in the usual units of millimeters, then the strain rate may be considered to have the units of (mm/mm)/sec, or equivalently units of sec−1. The standard tension or compression tests in materials science are performed at strain rates ranging from about 10−5 to 10−1 sec−1. Typical cross-head speeds for mechanical testing of orthodontic materials vary from about 0.1 to 1 mm/min. As an example, for a specimen with a 10 mm gauge length that is tested in tension at a crosshead speed of 0.5 mm/min, the strain rate is 8.3 × 10⁻⁴ sec−1 or approximately 10−3 sec−1. Servohydraulic machines can also be operated in the force control mode, where a set loading pattern is applied to the test specimen.
To determine accurate values of the elastic modulus in tension for archwires, which have high elastic moduli (stiffness) (Chapter 4), it is necessary to measure the length change of the specimen directly. An extensometer may be attached to the wire specimen, or some alternative method (such as an optical sensor) may be used. Accurate results will not be obtained if the crosshead movement (which can be read from the machine output) is used to calculate the specimen strain unless the data are corrected for the stiffness of the testing machine. Additional inaccuracy with the use of crosshead movement to determine strain can arise from slippage of archwire specimens at the grips used with the mechanical testing machine. For polymeric materials of low elastic modulus, the crosshead movement corresponds accurately to the specimen length change during tensile or compressive loading.
As previously noted in Chapter 1, the mechanical properties of metallic and ceramic dental materials are not greatly affected by loading rates normally used (i.e., the rate of crosshead movement or strain rate), although variations in loading rate can have substantial effects on the mechanical properties of polymeric materials. Other than the nickel-titanium archwire alloys discussed in Chapter 4, there is minimal difference between the mechanical properties of metallic and ceramic dental materials determined at room temperature and 37 °C. The mechanical properties of polymeric dental materials can have strong dependence upon temperature, which should be carefully investigated before extrapolating the results of room temperature measurements to clinical behavior at 37 °C.
A highly convenient and inexpensive method for obtaining an approximately 37 °C testing environment is to place a cardboard chamber around the specimen fixture area on the mechanical testing machine and use the radiant energy from a suitably positioned light bulb to provide the heating. The specimen temperature can be controlled to within about 1 °C with this technique and monitored with a thermometer or thermistor. A wide array of more sophisticated environmental chambers are commercially available, and such chambers can also be fabricated inexpensively by the investigator.
Specific Tests for Evaluation of Mechanical Properties of Orthodontic Materials
Bending Tests
Bending tests have been popular for evaluation of the mechanical properties of archwires because of the relevance of bending deformation to the activation received by the archwires under clinical conditions. Three types of bending tests have been performed: a cantilever bending test using the Olsen stiffness tester, as recommended in the original form of American Dental Association (ADA) Specification No. 32, and three-point and four-point bending tests. The ADA standard is currently being revised, and it is expected that future methodology will employ the three-point bending test. The nature of the specimen loading for a cantilever beam and the three-point and four-point bending tests is shown in Figure 2.6. The cantilever bending test performed with the Olsen stiffness tester is somewhat more complicated than the example shown in Figure 2.6 because the fixed end of the specimen rotates while the other end of the test span is deflected by a bending plate.
While the three-point bending test is relatively simple to perform in the laboratory, this test has the disadvantage that there is a linear variation of the bending moment from a maximum at the loading point to zero at the two supports, as illustrated in Figure 2.7. This loading pattern can predetermine the failure location in a specimen. In contrast, Figure 2.7 shows that there is a uniform bending moment between the two inner loading points for the four-point bending test. In this case the specimen is allowed to fail at its weakest point, which is a highly useful feature when mechanical testing is being performed to identify structural weaknesses.
Brantley has derived a formula for modulus of elasticity (E) in bending obtained with the Olsen stiffness tester for 25 mm test spans of large-diameter (d) stainless steel and cobalt-chromium-nickel archwires that yields excellent agreement with values of E obtained in tension:

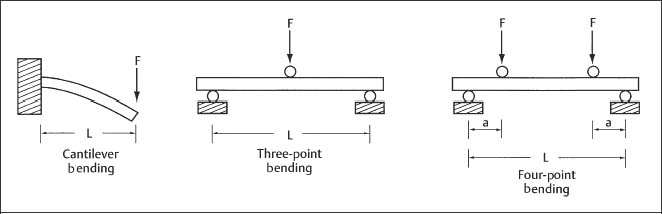
Fig. 2.6 Comparison of the specimen loading for a cantilever beam and the three-point and four-point bending tests
where l is the test span length, I is the moment of inertia, and M/θ is the slope of the bending moment-angular deflection plot. To />
Stay updated, free dental videos. Join our Telegram channel
VIDEdental - Online dental courses


