Other Imaging Modalities
The imaging modalities described in this chapter employ equipment and techniques that are beyond the routine needs of most general dental practitioners. Each of these techniques makes a tomographic image—that is, a slice through tissue—rather than a simple projection image. The most versatile of these modalities are computed tomographic (CT) scanning and magnetic resonance (MR) imaging. Nuclear medicine, ultrasonography, and positron emission tomographic (PET) imaging are used for more specialized applications. Film tomography, a mainstay imaging technique during the twentieth century, has been largely replaced by CT scanning, MR imaging, and cone-beam imaging (see Chapters 11–13). Each of these imaging modalities is used to aid in the diagnosis of conditions in the oral cavity. Thus, dentists should have a basic understanding of their operating principles and clinical applications.
Computed Tomographic Scanning
In 1972, Hounsfield, an engineer, announced the invention of a revolutionary imaging technique that used image reconstruction mathematics developed by Cormack in the 1950s and 1960s to produce cross-sectional images of the head. This form of imaging is called computed tomographic (CT) scanning. Hounsfield and Cormack shared the Nobel Prize in Physiology or Medicine in 1979 for their pioneering work.
Computed Tomographic Scanners
In its simplest form, a CT scanner consists of an x-ray tube that emits a finely collimated, fan-shaped x-ray beam directed through a patient to a series of scintillation detectors or ionization chambers (Fig. 14-1, A). These detectors measure the number of photons that exit the patient. This information can be used to construct a cross-sectional image of the patient. In early versions of CT scanners, both the x-ray tube and the detectors rotated synchronously around the patient. In more recent designs, the detectors form a continuous ring around the patient, and the x-ray tube moves in a circle within the fixed detector ring (Fig. 14-1, B). Originally, patients would lie on a stationary table while the x-ray source rotated one cycle around them. Then the table would move 1 to 5 mm for the next scan. CT scanners that used this type of “step and shoot” movement for image acquisition are called incremental scanners. The final image set consists of a series of contiguous or overlapping axial images, made at right angles to the long axis of the patient’s body. These two-dimensional slices are cross sections, typically 1 mm thick.
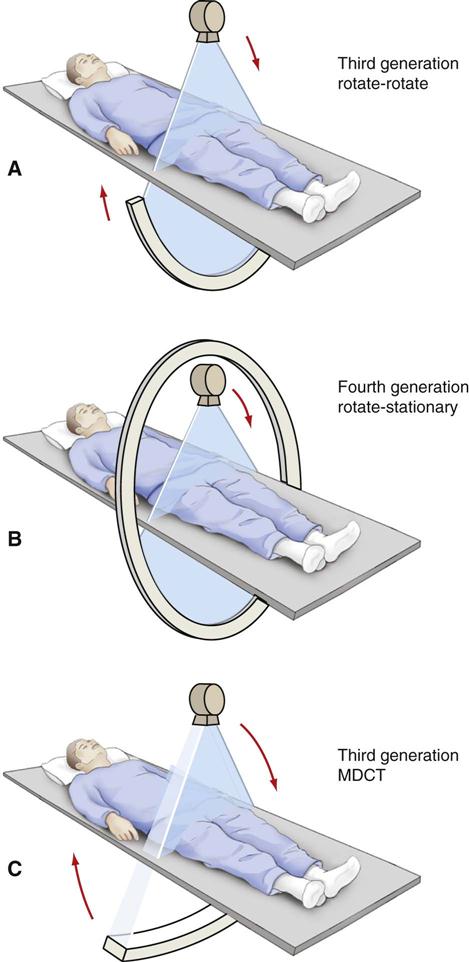
In 1989, CT scanners were introduced that acquire image data in a helical fashion (Fig. 14-2). With helical scanners, the gantry, containing the attached x-ray tube and detectors, continuously revolves around the patient, while the table on which the patient is lying continuously advances through the gantry. A continuous helix of data is acquired as the x-ray beam moves down the patient. Helical CT imaging is now the standard. In helical CT scanners, pitch refers to the amount of patient movement compared with the width of the image acquired. More precisely, the equation is as follows:
< ?xml:namespace prefix = "mml" ns = "http://www.w3.org/1998/Math/MathML" />
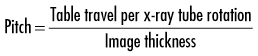
A pitch of 1 means that the image width is equal to the amount of patient movement per slice. A pitch of 2 means that the patient moves twice as far as the detector is wide, and only half the tissue is exposed. A pitch of 0.5 means that half the image is overlapped in each slice. Overlapping reconstructions result in the highest spatial resolution but also the highest patient dose. Compared with incremental CT scanners, helical scanners provide improved multiplanar image reconstructions, reduced examination time, and a reduced radiation dose.
The most recent major advance was the introduction of multidetector helical computed tomographic (MDCT) scanners in 1998. Alternative terms for the same technology are multislice CT imaging and multirow CT imaging. MDCT imaging has become widely used and has had a pronounced clinical impact. With this method, usually 64 or 128 adjacent detector arrays are used in conjunction with a helical CT scanner (see Fig. 14-1, C). Additionally, the time for the x-ray tube to make a full cycle around the patient has been reduced to 0.25 second (four rotations per second). These developments allow images from multiple slices to be captured quickly and simultaneously, thus greatly reducing both exposure time and motion artifact from breathing, peristalsis, or heart contractions; this is important for patients who cannot hold their breath for long periods and for pediatric and trauma patients. The quality of axial, reformatted, and three-dimensional images is also greatly improved with MDCT scanners compared with single-slice scanners. The meaning of pitch with MDCT scanners varies with the individual manufacturer but often means table travel per x-ray tube rotation divided by total active detector width. In general, the patient dose is higher with MDCT scanners than with single-slice scanners.
X-Ray Tubes
CT scanners use x-ray tubes with rotating anodes (see Fig. 1-9). These tubes have a high heat capacity, up to 8 million heat units (compare with dental tubes of 20,000 heat units). They operate at typically 120 kVp (range, 80 to 140 kVp) and 200 to 800 mA. Focal spot sizes range from 0.5 to 2.0 mm. The high x-ray output minimizes exposure time and improves image quality by increasing the signal-to-noise ratio. The high kVp also provides a wide dynamic range by reducing bone absorption compared with soft tissue and extends tube life by reducing tube loading. The tubes operate continuously by using three-phase or high-frequency generators. To minimize patient exposure the beam is collimated to a thin fan beam before it enters the patient. Some of the x-ray photons interact with the patient and are scattered. To improve image quality the residual beam is again collimated to remove the scattered photons. Postpatient collimation controls slice thickness. Slice thickness is typically 1 to 3 mm. Thinner slices result in higher spatial resolution and contrast, less partial volume effect (see later), and higher patient dose.
Detectors
The x-ray beam exiting the patient is captured by an array of solid-state detectors. These detectors are usually made of rare earth materials, such as Gd2S2O. The spaces between the ceramic scintillators or crystals are heated into a ceramic, sawn into small elements, and coupled to a photodiode. The ceramic is scored with a saw or laser, and the spaces are filled with an opaque material to create individual pixels 0.625 mm across. These detectors are about 80% efficient. The signal from the detector is amplified, digitized, and sent to a computer for analysis.
Image Reconstruction
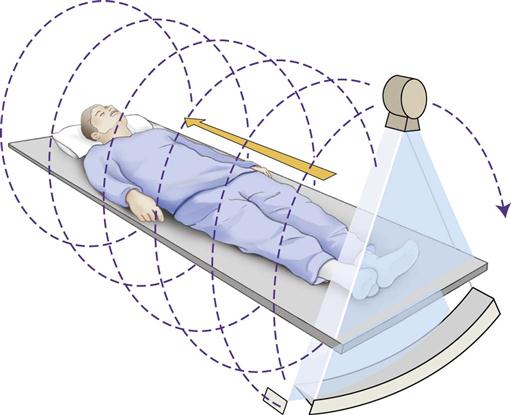
The photons recorded by the detectors represent a composite of the absorption characteristics of all elements of the patient in the path of the x-ray beam. Computer algorithms use these photon counts to construct one or, more often, many digital cross-sectional images. The CT image is recorded and displayed as a matrix of individual blocks called voxels (volume elements) (Fig. 14-3). Each square of the image matrix is a pixel. Images are typically 512 × 512 pixels or 1024 × 1024 pixels. Although the size of the pixel (about 0.6 mm) is determined partly by the computer program used to construct the image, the length of the voxel (about 1 to 20 mm) is determined by the width of the x-ray beam, which is controlled by the prepatient and postpatient collimators. An interpolator algorithm is used to correct for the helical motion of the scanner and to construct planar cross sections from the helical information.
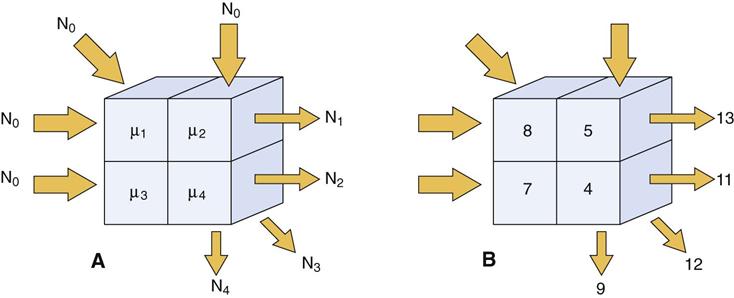
The methods used to reconstruct images are complex. Initially, an object with four compartments, as shown in Figure 14-4, should be pictured. The linear attenuation coefficients (densities) of each of the four cells can be computed by using four simultaneous equations to solve for four unknowns. This method becomes computationally impracticable when there are 5122 or 10242 cells. Instead, methods called filtered back-projection algorithms involving Fourier transformations are used for rapid image reconstruction. A modification of these methods, called the Feldkamp reconstruction, is used for MDCT and cone-beam reconstructions to account for the diverging x-ray beam. This same principle is used in cone-beam imaging (see Chapter 11). After reconstruction, various image processing filters are applied. Typically, these are smoothing filters to minimize noise in low-contrast objects such as soft tissue and edge-sharpening filters to improve visualization of fine bony detail. In recent years, an image processing technique called iterative reconstruction has been used instead of filtered back-projection to reduce noise from images. This technique allows the use of low-dose protocols yet still produces images with comparable or better image quality. More recent research in CT imaging includes using dual-energy CT imaging and spectral CT imaging to remove bone from soft tissue images and to facilitate tissue characterization.
Computed Tomographic Image
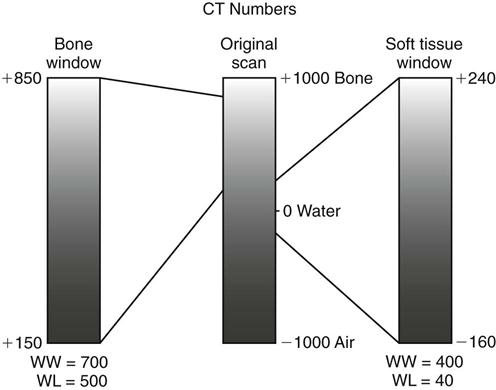
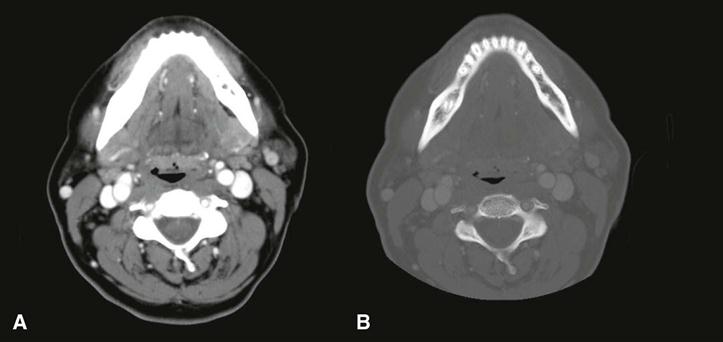
For image display, each pixel is assigned a CT number representing tissue density. This number is proportional to the degree to which the material within the voxel has attenuated the x-ray beam. CT numbers, also known as Hounsfield units (HU), in honor of the inventor Hounsfield, range from −1000 to +1000, each corresponding to a different level of beam attenuation (Table 14-1). Some newer CT machines have a range of up to 4000 HU. Because the human eye can detect only about 40 shades of gray, it is useful to adjust the range and mean of CT numbers displayed on a monitor (Fig. 14-5). An image optimized for viewing bone, a “bone window,” may have a range (window width [WW]) of 700 units and mean (window level [WL]) of 500 units. Alternatively, an image optimized to view soft tissues may have a WW of 400 units and a WL of 40 units. In these images, bone is white or light grey, soft tissue is medium gray, and air is dark grey to black. By convention, these images are displayed as if the clinician is standing at the feet of the patient who is lying on his or her back. Thus, the patient’s anterior structures appear at the top (Fig. 14-6, A), and the patient’s right side appears on the left (Fig. 14-6, B and C).
TABLE 14-1
Typical Hounsfield Units for Air and Tissues
| Tissue | Hounsfield Units (CT Numbers) |
| Bone | +400 to +1000 |
| Soft tissue | +40 to +80 |
| Water | 0 |
| Fat | −60 to −100 |
| Lung | −400 to −600 |
| Air | −1000 |
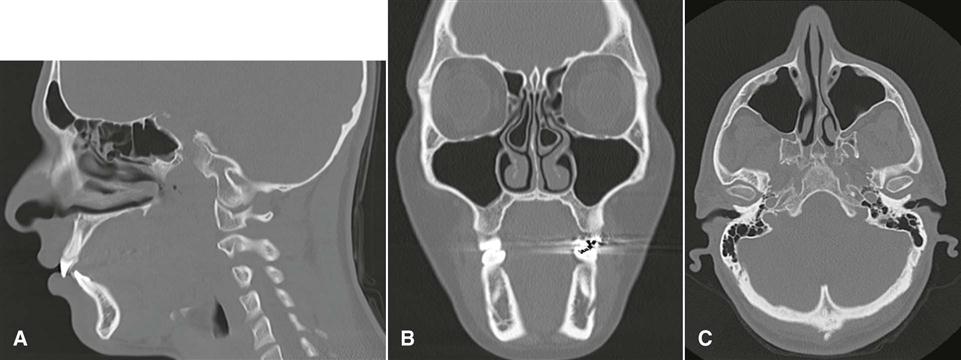
CT imaging has several advantages over conventional film radiography and tomography. First, CT imaging eliminates the superimposition of images of structures outside the area of interest. Second, because of the inherent high-contrast resolution of CT imaging, differences between tissues that differ in physical density by less than 1% can be distinguished; conventional radiography requires a 10% difference in physical density to distinguish between tissues. Third, data from a single CT imaging procedure, consisting of either multiple contiguous or one helical scan, can be viewed as images in the axial, coronal, or sagittal planes or in any arbitrary plane depending on the diagnostic task; this is referred to as multiplanar reformatted imaging. Having the capability of viewing normal anatomy or pathologic processes simultaneously in three orthogonal planes often facilitates radiographic interpretation (see Fig. 14-6).
Multiplanar images are two-dimensional and require a certain degree of mental integration by the viewer for interpretation. This limitation has led to the development of computer programs that reformat data acquired from axial CT scans into three-dimensional images. The use of three-dimensional images has been boosted by the use of MDCT imaging as a means of reviewing large amounts of information collected at each examination.
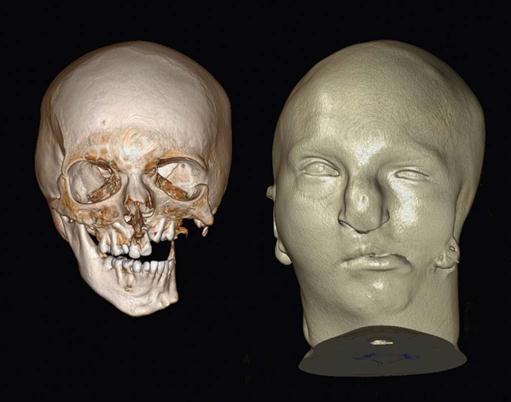
Three-dimensional reformatting requires that each original voxel, shaped as a rectangular solid, be dimensionally altered into multiple cuboidal voxels. This process, called interpolation, creates sets of evenly spaced cuboidal voxels (cuberilles) that occupy the same volume as the original voxel (see Fig. 14-4, D). The CT numbers of the cuberilles represent the average of the original voxel CT numbers surrounding each of the new voxels. Isotropic voxels 0.24 mm in size can be achieved. Creation of these new cuboidal voxels allows the image to be reconstructed in any plane without loss of resolution by locating the position of each voxel in space relative to one another. In constructing the three-dimensional CT image, only cuberilles representing the surface of the object scanned are displayed on the monitor. The surface formed by these cuberilles, either solid or partially transparent, is made to appear as if illuminated by a light source located behind the viewer (Fig. 14-7). In this manner, the visible surface of each pixel is assigned a gray-level value, depending on its distance from and orientation to the light source. Thus, pixels that face the light source or are closer to it appear brighter than pixels that are turned away from the source or are farther away. After construction, three-dimensional CT images may be manipulated further by rotation around any axis to display the structure imaged from any angle. Also, external surfaces of the image can be removed electronically to reveal concealed deeper anatomy.
Artifacts
Different types of artifacts may degrade CT images. Partial volume artifact occurs because a voxel has finite dimensions. When a voxel contains tissues of differing densities (e.g., bone and soft tissue), the resulting CT number for that voxel is an intermediate value that does not represent either tissue. The resulting image may be a blurring of the junction of the tissues or a loss of part of a thin cortical layer of bone. Beam-hardening artifact results by the preferential absorption of lower energy photons in the heterogeneous x-ray beam. Because the distance through the center of the head is longer than along a path closer to the surface, there is beam hardening seen as darkening in the middle of an axial slice. Software algorithms may minimize this artifact. Metal streaking artifacts occur because of the near-complete absorption of x-ray photons by metallic restorations. They appear as opaque streaks in the occlusal plane (see Figs. 14-6, B, and 14-7).
Contrast Agents
Contrast agents are substances used to improve visualization of structures. CT imaging frequently uses iodine, administered intravenously, to enhance soft tissue and vascular image detail. The iodine in the contrast medium has a large atomic number and effectively absorbs x rays (Fig. 14-8). Malignant facial tumors often are more vascularized than surrounding normal tissues; thus, the presence of the iodine perfusing these tissues increases their radiographic density and makes their margins more detectable. Contrast medium also helps to visualize enlarged lymph nodes containing metastatic carcinoma. However, contrast dye can be toxic to the kidneys in elderly patients with kidney disease.
Applications
CT imaging is useful for diagnosing and determining the extent of a wide variety of infections, osteomyelitis, cysts, benign and malignant tumors, and trauma in the maxillofacial region. The ability of CT imaging to display fine bone detail makes it an ideal modality for lesions involving bone. Three-dimensional CT imaging has been applied to trauma cases and craniofacial reconstructive surgery and has been used for treatment of both congenital and acquired deformities. The availability of data in a three-dimensional format also has allowed the construction of life-sized models that can be used for trial surgeries and the construction of surgical stents for guiding dental implant placement and for the creation of accurate implanted prostheses.
Magnetic Resonance Imaging
Lauterbur described the first MR image in 1973, and Mansfield further developed use of the magnetic field and the mathematical analysis of the signals for image reconstruction. MR imaging was developed for clinical use around 1980, and Lauterbur and Mansfield were awarded the Nobel Prize in Physiology or Medicine in 2003.
To make an MR image, the patient is first placed inside a large magnet. This magnetic field causes the nuclei of many atoms in the body, particularly hydrogen, to align with the magnetic field. The scanner directs a radiofrequency (RF) pulse into the patient, causing some hydrogen nuclei to absorb energy (resonate). When the RF pulse is turned off, the stored energy is released from the body and detected as a signal in a coil in the scanner. This signal is used to construct the MR image—in essence, a map of the distribution of hydrogen.
MR imaging has the particular advantages of being noninvasive, using nonionizing radiation, and making high-quality images of soft tissue resolution in any imaging plane. Disadvantages of MR imaging include high cost, long scan times, and the fact that various metals in the imaging field either distort the image or may move into the strong magnetic field, injuring the patient.
Protons
Individual protons and neutrons (nucleons) in the nuclei of all atoms possess a spin, or angular momentum. In nuclei having equal numbers of protons and neutrons, the spin of each nucleon cancels that of another, producing a net spin of zero. However, nuclei containing an unpaired proton or neutron have a net spin. Because spin is associated with an electrical charge, a magnetic field is generated in nuclei with unpaired nucleons, causing these nuclei to act as magnets with north and south poles (magnetic dipoles) and having a magnetic moment. The most common of these atoms, the MR active nuclei, are hydrogen, carbon 13, nitrogen 15, oxygen 17, fluorine 19, sodium 23, and phosphorus 31. Hydrogen is the most abundant of these atoms in the body.
A hydrogen nucleus consists of a single unpaired proton and therefore acts as a magnetic dipole. Normally, these magnetic dipoles are randomly oriented in space (Fig. 14-9). When an external magnetic field is applied, the hydrogen nuclear axes align in the direction of the magnetic field (Fig. 14-10). Two states are possible: spin-up, which parallels the external magnetic field, and spin-down, which is antiparallel with the field. Because more energy is required to ali/>
Stay updated, free dental videos. Join our Telegram channel
VIDEdental - Online dental courses


