Cone-Beam Computed Tomography
Volume Preparation
William C. Scarfe and Allan G. Farman
As cone-beam computed tomographic (CBCT) imaging is inherently a digital volumetric image-capture technology, image visualization should also be by digital display. This demands that clinicians move from static hard copy (printed) images to software-assisted volumetric review. Image display should be dynamic and formatted according to task-specific display protocols. Expanding the use of volumetric data for treatment planning and image guidance of operative and surgical procedures is facilitated by the use of appropriate application of software.
Chapter 11 detailed technical aspects of CBCT image production—creating and caring for volumetric CBCT data. This chapter focuses on the interaction and use of the subsequent volumetric data, including image display, image interpretation, and task-specific applications.
Stages in Volumetric Data Display
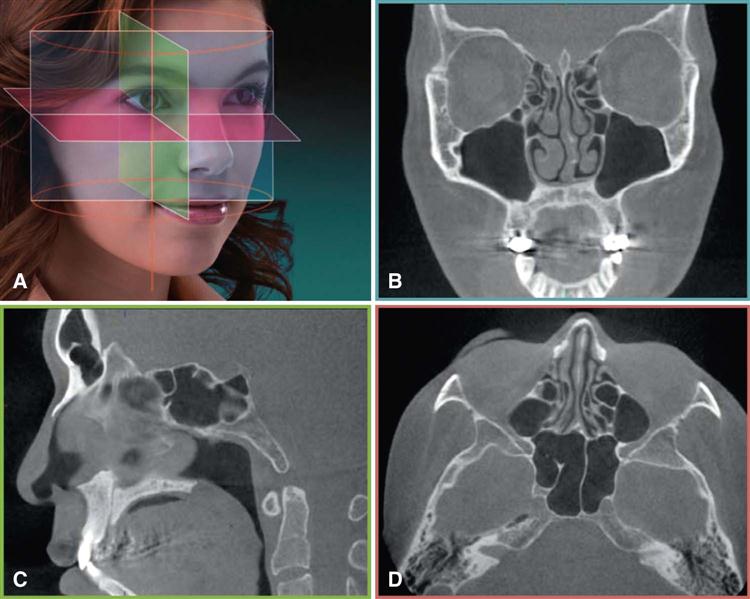
The default presentation of the CBCT volumetric data set by most software programs is usually as secondary two-dimensional contiguous reconstructed images in three orthogonal planes (axial, sagittal, and coronal) at a defaulted thickness (Fig. 12-1). Each panel of the display software presents one of a series of contiguous images in that plane. Each image is interrelational such that the location of each image in the sequence can be identified in the other two planes. CBCT data should be considered as a volume to be explored from which selected images are extracted. Technically, four stages provide an efficient and consistent systematic methodologic approach to optimize CBCT image display before image interpretation:
Reorient Data
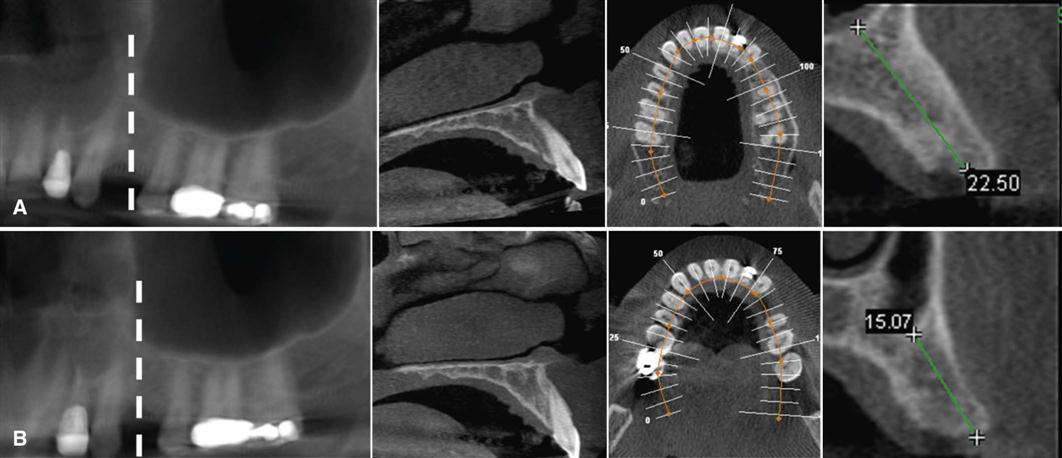
One of the advantages of CBCT acquisition is that the resultant volumetric data set can be reoriented in all three planes using PC-based software. Initial adjustment of the volumetric data set should include reorientation such that the patient’s anatomic features are realigned symmetrically or according to a reference plane (Fig. 12-2). This stage is particularly important for aligning subsequent cross-sectional, transaxial images perpendicular to the structure of interest, such as to visualize single tooth pathology, to measure the maximal height and width of the residual alveolar ridge in an edentulous segment for implant site assessment (Fig. 12-3), to compare temporomandibular joint (TMJ) condylar morphology, or to perform a craniofacial analysis.
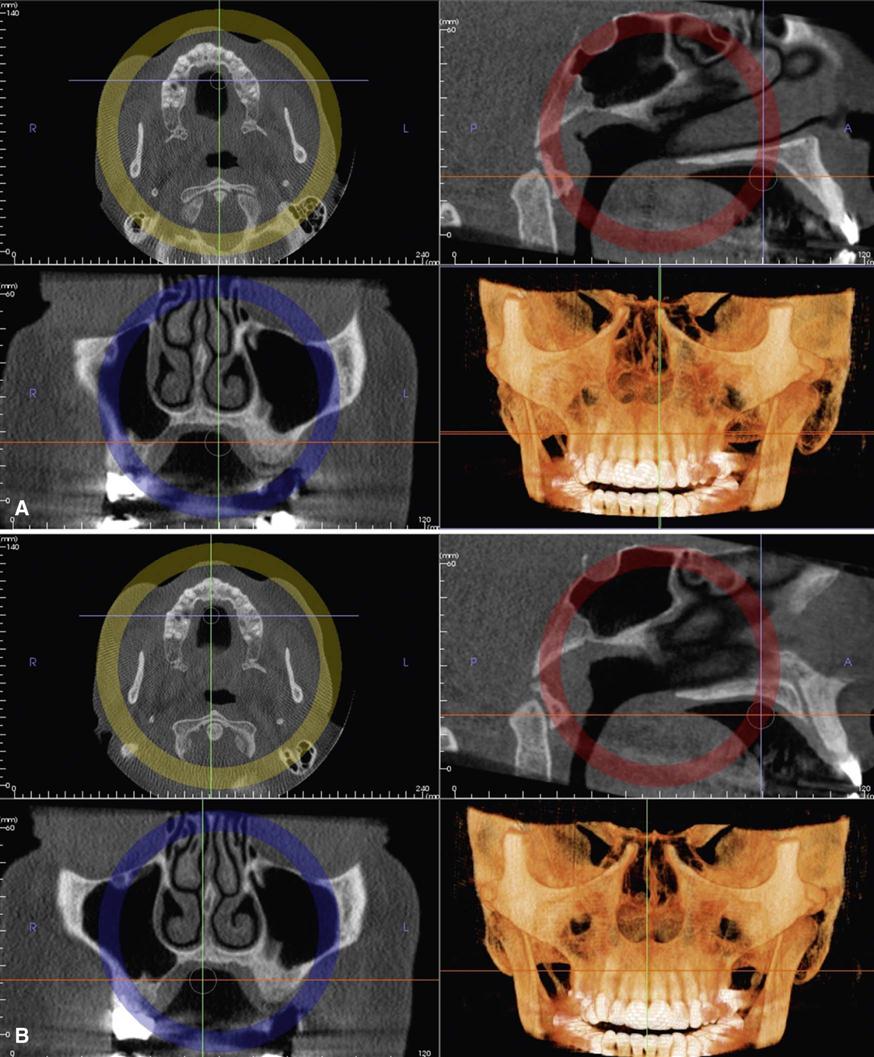
(Screen view of case made with InVivoDental software, Anatomage, San Jose, CA.)
Optimize Data
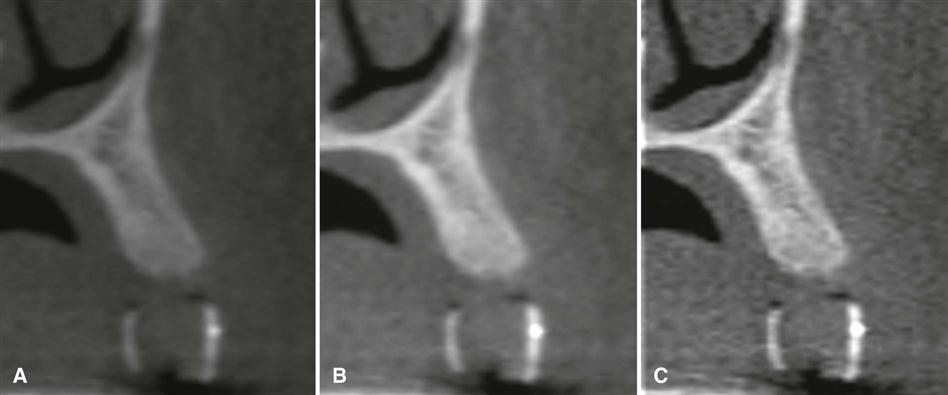
Great variability can exist in the overall density and contrast of orthogonal images between CBCT units and within the same unit depending on patient images and scan parameters selected. Therefore, to optimize image presentation and facilitate diagnosis, it is often necessary to adjust contrast (window) and brightness (level) parameters to favor bony structures. Although CBCT proprietary software may provide for window and level presets, it is advisable that these parameters be optimized for each scan. After these parameters are set, further enhancements can be performed by the application of sharpening, filtering, and edge algorithms. The use of these functions must be weighed against the visual effects of increased noise in the image (Fig. 12-4). After these adjustments, secondary algorithms (e.g., annotation, measurement, magnification) can be applied with confidence.
View Data
Because there are numerous component orthogonal images in each plane, it is impractical to display all slices on one display format. Therefore, it is necessary to review each series dynamically by scrolling through the consecutive orthogonal image “stack.” This is referred to as a “cine” or “paging” mode. It is recommended that scrolling be performed craniocaudally (i.e., from head to toe) and then in reverse, slowing down in areas of greater complexity (e.g., TMJ articulations and skull base). This scrolling process should be performed at least in the coronal and axial planes. Viewing orthogonal projections at this stage is recommended as an overall survey for disease and to establish the presence of any asymmetry.
Format Data
CBCT software provides many formatting options, each directed toward visualizing specific components of the volumetric data set. Protocols incorporating field of view (FOV) scan exposure parameters and display modes should be applied selectively to highlight anatomic features or functional characteristics within a specific diagnostic task. Overall, selection should be based on applying thin sections to show detail and thicker sections to demonstrate relationships. There are three basic format options (Fig. 12-5):
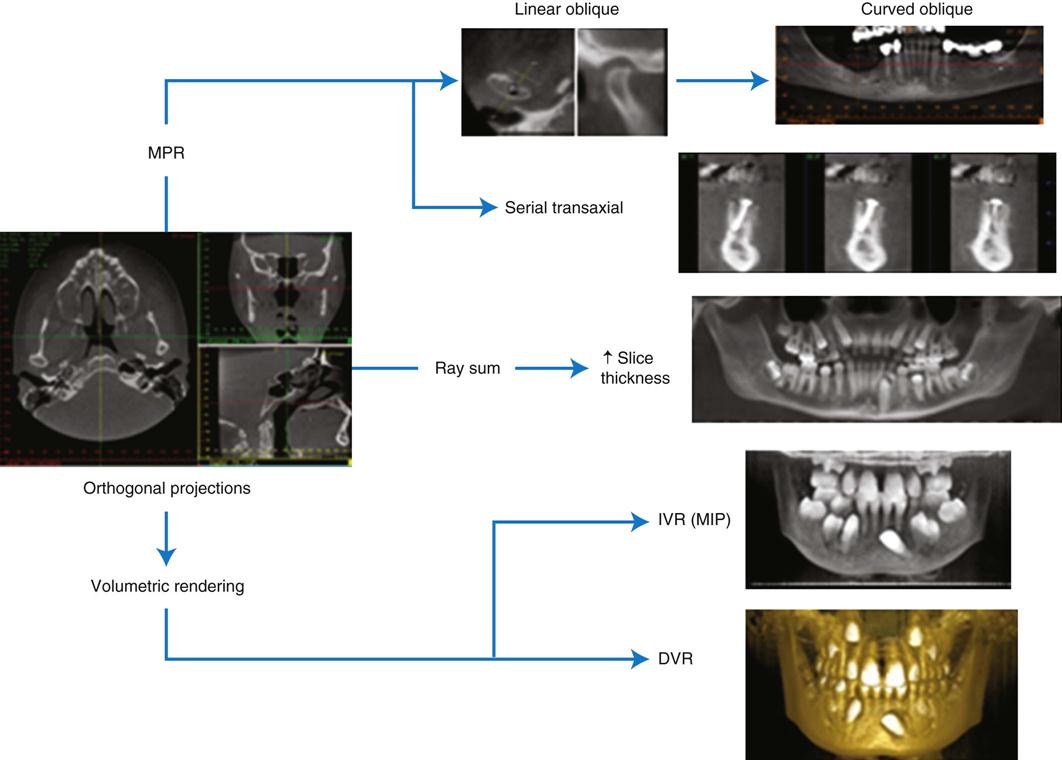
Multiplanar Reformation
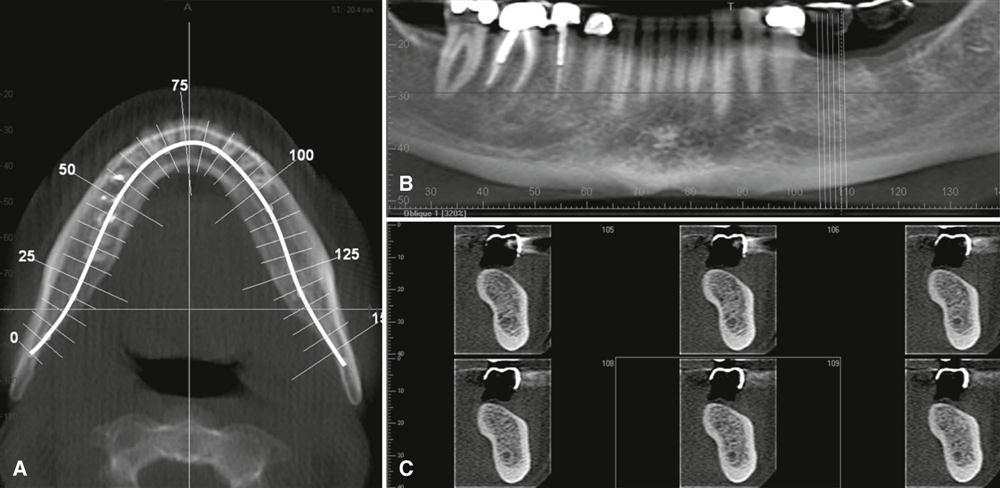
Because of the isotropic nature of acquisition, the volumetric data set can be sectioned nonorthogonally to provide nonaxial two-dimensional planar images referred to as multiplanar reformation (MPR). MPR modes include linear oblique, curved planar, and serial transaxial reformations. Several anatomic structures are not particularly well visualized and represented as displayed in orthogonal planes, and oblique reformatting can be useful in these instances (Fig. 12-6). Oblique images are most often used to transect the mandibular condyle. Curved planar images are generated by manually drawing a planning line or spline by selecting multiple nodes along the centerline corresponding to the jaw arch on an appropriate axial image; this creates a “simulated” or reconstructed dental panoramic image. Because clinicians are familiar with them and they are distortion-free, panoramic MPR reconstructions are useful for jaw evaluation. Such reconstructions must be thick enough to include the entire mandible to avoid missing disease. Serial transaxial images provide sequential images perpendicular to an arbitrary linear oblique or curved planar MPR. They are most commonly called cross-sectional images. The slice width (slice thickness) of the image and the distance between adjacent cross-sectional images (interslice interval) can often be defined. Cross-sectional images are optimal for examining teeth and alveolar bone.
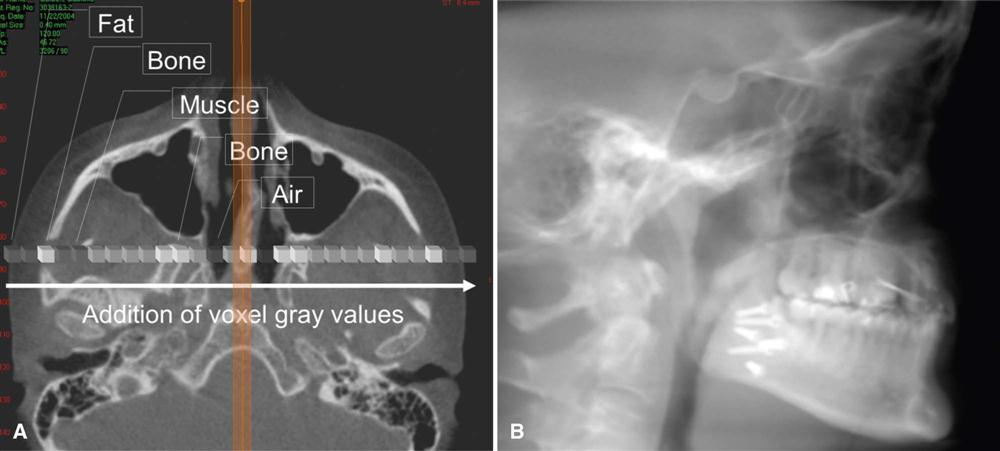
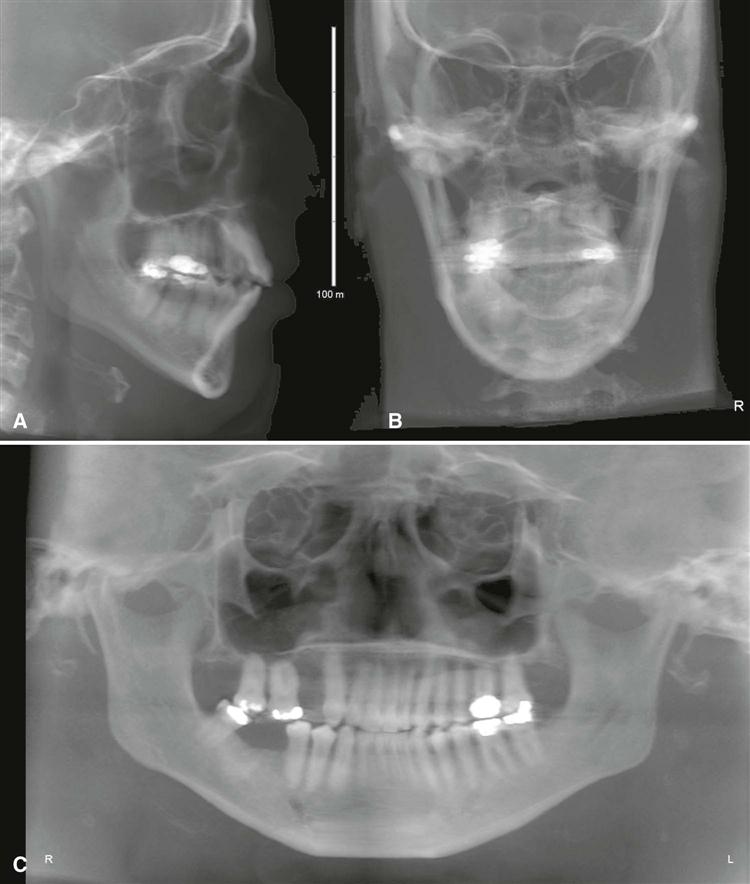
Ray Sum
The slice thickness of orthogonal or MPR images can be “thickened” by increasing the number of adjacent voxels included in the display (Fig. 12-7). This creates an image slab that represents a specific volume of the patient, referred to as a ray sum. The thickness of the slab is usually variable and determined by the thickness of the structure to be imaged. Full-thickness perpendicular ray sum images can be used to generate simulated projections, such as lateral cephalometric images (Fig. 12-8). In contrast to conventional radiographs, these ray sum images are without magnification and parallax distortion. However, this technique uses the entire volumetric data set, and interpretation is negatively affected by “anatomic noise”—the superimposition of multiple structures—also inherent in conventional projection radiography.
Stay updated, free dental videos. Join our Telegram channel
VIDEdental - Online dental courses


