Safety and Protection
Dentists must be prepared to discuss intelligently with patients the benefits and possible hazards involved with the use of x rays and to describe the steps taken to reduce these hazards. This chapter considers sources of exposure, estimates of risks from dental radiography, and means to minimize exposure from dental examinations.
Sources of Radiation Exposure
The general population is exposed to radiation primarily from natural background and medical sources (Table 3-1). Understanding these exposure sources provides a useful framework for considering dental exposure.
TABLE 3-1
Average Annual Effective Dose of Ionizing Radiation
| Source | Dose (mSv) |
| Natural background | |
| Radon | 2.3 |
| Space | 0.3 |
| Internal radionuclides | 0.3 |
| Terrestrial | 0.2 |
| Subtotal background | 3.1 |
| Medical | |
| CT | 1.5 |
| Nuclear medicine | 0.8 |
| Interventional fluoroscopy | 0.4 |
| Conventional radiography and fluoroscopy | 0.3 |
| Dental | 0.007 |
| Subtotal medical | 3.0 |
| Consumer products and other | 0.1 |
| Grand total | 6.2 |
Data from National Council on Radiation Protection and Measurements: Ionizing radiation exposure of the population of the United States, NCRP Report 160, Bethesda, MD, 2009, National Council on Radiation Protection and Measurements.
Background Radiation
All life on earth has evolved in a continuous exposure to natural background radiation (Fig. 3-1; see Table 3-1). Background radiation from space and various terrestrial sources yields an average annual effective dose of about 3.1 mSv in the United States.
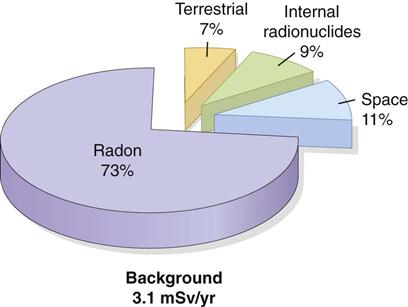
Radon and Its Progeny
Radon is a gas (radon 222) released from the ground that enters homes and buildings. By itself, radon does little harm, but it decays, releasing α particles, to polonium 218 and lead 214. These isotopes decay further, emitting more α particles. Radon and its decay products may become attached to dust particles that can be inhaled and deposited on the bronchial epithelium in the respiratory tract. Radon is estimated to be responsible for approximately 73% of the background exposure of the world’s population. Exposure to this quantity of radiation may cause 10,000 to 20,000 lung cancer deaths per year in the United States, mostly in smokers.
Space Radiation
Radiation from space comes from the sun or from cosmic rays. It is composed primarily of protons, helium nuclei, and nuclei of heavier elements as well as other particles generated by the interactions of primary space radiation with the earth’s atmosphere. Exposure from space radiation is primarily a function of altitude, almost doubling with each 2000-m increase in elevation because less atmosphere is present to attenuate the radiation. At sea level, the exposure from space radiation is about 0.33 mSv/y; at an elevation of 1600 m (approximately 1 mile, the elevation of Denver, Colorado), it is about 0.50 mSv/y. Space radiation contributes about 11% of background exposure.
Internal Radionuclides
Another source of background radiation is radionuclides that are ingested. The greatest internal exposure comes from foods containing uranium and thorium and their decay products, primarily potassium 40 but also rubidium 87, carbon 14, tritium, and others. The total exposure from ingestion contributes about 9% of background exposure.
Terrestrial Radiation
The final source of background radiation comes from exposure from radioactive nuclides in the soil, primarily potassium 40 and the radioactive decay products of uranium 238 and thorium 232. Most of the γ radiation from these sources comes from the top 20 cm of soil. Indoor exposure from radionuclides is close to the exposure occurring outdoors because the shielding provided by structural materials balances the exposure from radioactive nuclides contained within these shielding materials. Terrestrial exposure contributes approximately 7% of background exposure.
Medical Exposure
Humans have contributed many additional sources of radiation to the environment (Fig. 3-2). The largest of these sources is medical imaging, with much smaller contributions from consumer products and other minor sources.
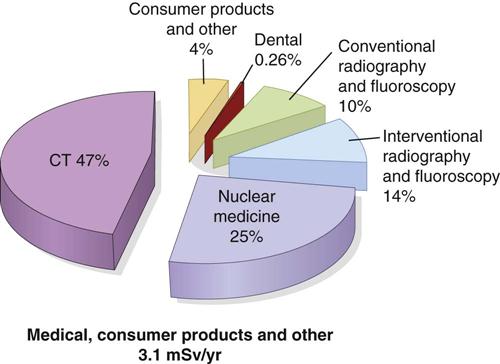
Approximately 400 million x-ray examinations are performed annually in the United States; about one quarter of these are dental. More recent estimates suggest that medical exposure in developed countries has grown rapidly in recent decades, particularly computed tomography (CT) of the chest and abdomen and increased use of cardiac nuclear medicine studies. The average doses from medical exposures are comparable to natural background exposure. CT (see Chapter 14) contributes more than half of medical exposure. In contrast to background radiation exposures, which affect everyone relatively uniformly, the distribution of medical exposures is highly skewed with older and sicker individuals receiving most medical exposures. Dental x-ray examinations, although made relatively frequently, are responsible for only 0.26% of the total exposure from medical imaging.
Consumer Products
Consumer products contain some of the most interesting and unsuspected sources. This group includes, in order of importance, exposure from cigarette smoking, building materials, air travel, mining and agriculture, and combustion of fossil fuels. As more people travel frequently above the protection of the earth’s atmosphere, cosmic radiation becomes a more significant contributor to exposure. An airline flight of 5 hours in the middle latitudes at an altitude of 12 km may result in an exposure of about 25 µSv. Other minor sources of exposure from consumer products include dental porcelain, television receivers, and smoke alarms. In total, consumer products contribute only about 1.6% of the total average annual exposure.
Other Sources
Other sources of exposure affect caregivers or others in contact with patients receiving nuclear medicine treatments; people who work in nuclear power generation; individuals involved in areas of industrial, medical, educational, or research activities; workers in medical and dental x-ray facilities; workers in airport inspection systems; and commercial pilots. All these sources of radiation combined contribute only about 0.1% of the total average annual exposure.
Dose Limits, Exposures, and Risk
This section considers governmental dose limits for individuals who are occupationally exposed to radiation and for members of the general population. It also covers the amounts of radiation received by patients in dental and medical radiography and the estimated risks from these exposures.
Dose Limits
Recognition of the harmful effects of radiation and the risks involved with its use led the International Commission on Radiological Protection (ICRP) to establish guidelines for limitations on the amount of radiation received by both occupationally exposed individuals and the public (Table 3-2). These limits pertain to planned exposure situations, not to background radiation and not to emergency situations. Since their establishment in the 1930s, these dose limits have been revised downward several times reflecting increased knowledge concerning the harmful effects of radiation and the increased ability to use radiation more efficiently. Occupationally exposed individuals include dentists and their staffs. Individuals in the reception area or who are walking in a corridor outside a dental office are members of the public. Dose limits for members of the public—individuals not exposed occupationally—are generally set at 10% of occupationally exposed individuals. The current occupational exposure limits have been established to ensure that no individuals will have deterministic effects and that the probability for stochastic effects is as low as reasonably and economically feasible.
TABLE 3-2
| Type of Limit | Occupational | Public |
| Effective dose | 20 mSv per year, averaged over defined periods of 5 years with a maximum of 50 mSv in any one year | 1 mSv in a year |
| Annual equivalent dose to | ||
| Lens of eye | 20 mSv, averaged over defined periods of 5 years with a maximum of 50 mSv in any one year | 15 mSv |
| Skin | 500 mSv | 50 mSv |
| Hands and feet | 500 mSv | — |
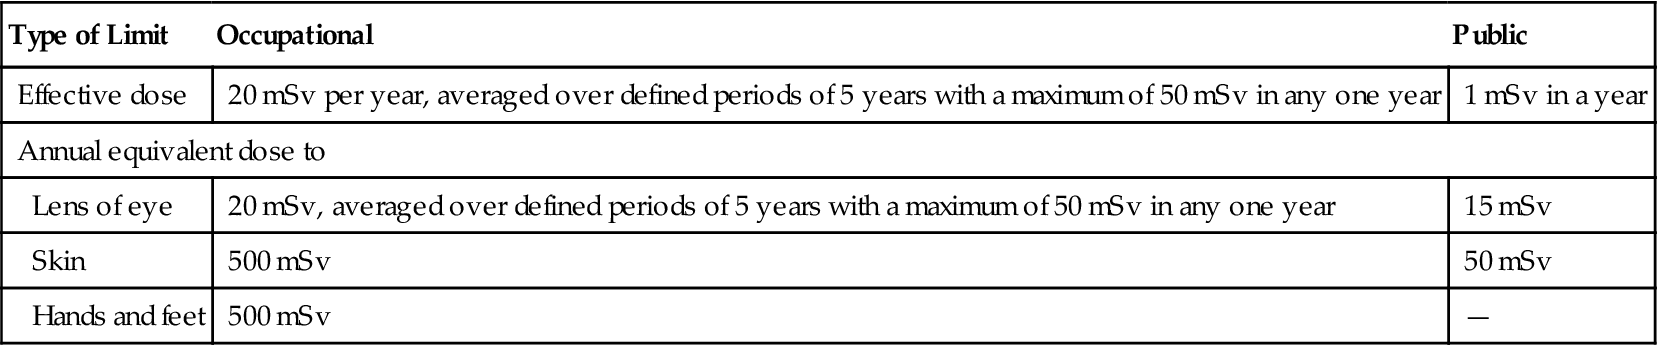
Data from the 2007 recommendations of the International Commission on Radiological Protection. IRCP Publication 103, Ann ICRP 37:1-332, 2007; and ICRP Statement on Tissue Reactions, ICRP ref 4825-3093-1464, 2011: http://www.icrp.org/docs/icrp%20statement%20on%20tissue%20reactions.pdf.
Dentists and their staff are occupationally exposed workers and are allowed to receive an average of 20 mSv of whole-body radiation exposure per year. Although this level of exposure is considered to present only a minimal risk, every effort should be made to keep the radiation dose to all individuals as low as practical. The dental profession does well in this area. The average dose for individuals occupationally exposed in the operation of dental x-ray equipment is 0.2 mSv—1% of the allowable exposure.
There are no limits on the exposure a patient can receive from diagnostic examinations, interventional procedures, or radiation therapy; this is because these exposures are made intentionally and for the direct benefit of the recipient. Individual circumstances make the setting of limits inappropriate. However, increasing concern for minimizing patient exposure has led multiple institutions, including the National Council on Radiation Protection and Measurement (NCRP) to issue diagnostic reference levels (DRL) for medical and dental diagnostic imaging. DRL exposure values represent the acceptable upper limits for patient exposure (75th percentile of general practice), whereas achievable doses represent the median dose (50th percentile) in general practice. The NCRP recommends a DRL of 1.6 mGy entrance skin dose for intraoral periapical and bitewing radiography. The NCRP further recommends an achievable dose of 1.2 mGy for intraoral radiography. These standards require that most users of D-speed film convert to E/F-speed film or a digital system. Multiple means to minimize unnecessary patient and operator exposure are described next.
Patient Exposure
Patient dose from dental radiography is usually reported as effective dose, a measure of the amount of radiation received by various radiosensitive organs during the radiographic examination. Table 3-3 shows typical effective doses from common dental intraoral, extraoral, and medical examinations. The equivalent exposure in terms of days of natural background radiation is shown. Dental exposures are a small fraction of the annual average background exposure.
TABLE 3-3
Effective Dose from Radiographic Examinations and Equivalent Background Exposure
| Examination | Effective Dose (µSν) | Equivalent Background Exposure (days) |
| INTRAORAL1 | ||
| Rectangular collimation | ||
| Posterior bitewings: PSP or F-speed film | 5 | 0.6 |
| Full-mouth: PSP or F-speed film | 35 | 4 |
| Full-mouth: CCD sensor (estimated) | 17 | 2 |
| Round collimation | ||
| Full-mouth: D-speed film | 388 | 46 |
| Full-mouth: PSP or F-speed film | 171 | 20 |
| Full-mouth: CCD sensor (estimated) | 85 | 10 |
| EXTRAORAL | ||
| Panoramic1–3 | 9–24 | 1–3 |
| Cephalometric1,2,4 | 2–6 | 0.3–0.7 |
| Cone-beam CT5,6 | ||
| Large field of view | 68–1073 | 8–126 |
| Medium field of view | 45–860 | 5–101 |
| Small field of view | 19–652 | 2–77 |
| Multislice CT | ||
| Head: Conventional protocol6–9 | 860–1500 | 101–177 |
| Head: Low-dose protocol6,8 | 180–534 | 21–63 |
| Abdomen7 | 5300 | 624 |
| Chest7 | 5800 | 682 |
| Plain films10 | ||
| Skull | 70 | 8 |
| Chest | 20 | 2 |
| Barium enema | 7200 | 847 |
CCD, Charge-coupled device; PSP, photostimulable phosphor.
1Data from Ludlow JB, Davies-Ludlow LE, White SC: Patient risk related to common dental radiographic examinations: the impact of 2007 international commission on radiological protection recommendations regarding dose calculation, J Am Dent Assoc 139:1237-1243, 2008.
2Data from Lecomber AR, Yoneyama Y, Lovelock DJ et al: Comparison of patient dose from imaging protocols for dental implant planning using conventional radiography and computed tomography, Dentomaxillofac Radiol 30:255-259, 2001.
3Data from Ludlow JB, Davies-Ludlow LE, Brooks SL: Dosimetry of two extraoral direct digital imaging devices: NewTom cone beam CT and Orthophos Plus DS panoramic unit, Dentomaxillofac Radiol 32:229-234, 2003.
4Data from Gijbels F, Sanderink G, Wyatt J et al: Radiation doses of indirect and direct digital cephalometric radiography, Br Dent J 197:149-152, 2004.
5Data from Pauwels R, Beinsberger J, Collaert B et al: Effective dose range for dental cone beam computed tomography scanners, Eur J Radiol 81:267-271, 2012.
6Data from Ludlow JB, Ivanovic M: Comparative dosimetry of dental CBCT devices and 64-slice CT for oral and maxillofacial radiology, Oral Surg Oral Med Oral Pathol Oral Radiol Endod 106:106-114, 2008.
7Data from Shrimpton PC, Hillier MC, Lewis MA et al: National survey of doses from CT in the UK: 2003, Br J Radiol 79:968-980, 2006.
8Data from Loubele M, Jacobs R, Maes F et al: Radiation dose vs. image quality for low-dose CT protocols of the head for maxillofacial surgery and oral implant planning, Radiat Prot Dosimetry 117:2/>
Stay updated, free dental videos. Join our Telegram channel
VIDEdental - Online dental courses


