Introduction
In this study, mechanical stress in the form of tooth movement was applied to osteoprotegerin-deficient knockout mice, which served as an animal model for juvenile Paget’s disease. To compare and evaluate bone turnover and response of the surrounding bony tissue, we administered reveromycin A. We also investigated the ability of reveromycin A to control osteoclastic activity in juvenile Paget’s disease.
Methods
Eight-week-old male osteoprotegerin-deficient knockout and wild-type mice were injected with reveromycin A (15 mg/kg of body weight) intraperitoneally twice daily. An elastic module was inserted interproximally between the maxillary left first and second molars.
Results
Administration of reveromycin A to osteoprotegerin-deficient knockout mice reduced tooth movement distances, increased bone volumes at the interradicular septum, decreased osteoclast counts, and reduced serum alkaline phosphatase and tartrate resistant acid phosphatase. Reveromycin A administration also caused a temporal shift in peak Runx2 staining in osteoprotegerin-deficient knockout mice so that the overall staining time course was similar to that observed for wild-type mice.
Conclusions
Reveromycin A administration in osteoprotegerin-deficient knockout mice inhibited bone resorption and normalized bone formation. As a result, normal bone turnover was obtained.
During orthodontic treatment, tooth movement involves the resorption of alveolar bone by osteoclasts on the pressure side and its formation by osteoblasts on the tension side, leading to alterations of the surrounding tissues. Optimal tooth movement and bone healing, which depend on osteoclastic and osteoblastic activity, are important for successful orthodontic treatment. Osteoclasts are the only cells that participate in the breakdown and resorption of calcified bone tissue. The processes of osteoclast differentiation, maturation, and functioning are controlled by the receptor activator of NF-κB ligand (RANKL), which is expressed on the cell membranes of both osteoblasts and bone marrow stromal cells. Osteoclasts and their precursor cells express the receptor activator of NF-κB (RANK), which interacts with RANKL via intercellular contact, inducing differentiation into matured osteoclasts. Osteoprotegerin (OPG), produced by osteoblasts, is a member of the tumor necrosis factor receptor superfamily and a decoy receptor. OPG strongly inhibits the interaction between RANKL and RANK, suppressing osteoclast differentiation and functional expression as a decoy receptor for RANKL. In vivo, if OPG is overexpressed in mice, bone resorption is reduced, and the mice will develop severe osteopetrosis. On the other hand, OPG knockout mice, which recapitulate juvenile Paget’s disease (also known as idiopathic hyperphosphatasemia), typically appear normal at birth, but as they grow, osteoclast activity is promoted. As a result, the adult mice have severe osteoporosis because bone resorption outpaces bone formation relative to wild-type mice. It is the lack of, or the mutation of, the gene encoding OPG (compound heterozygous or homozygous, inherited as an autosomal recessive trait) that causes juvenile Paget’s disease in humans. In this disease, patients can appear normal at birth, but the systemic clinical symptoms increase with age, leading to high levels of bone turnover. High levels of serum alkaline phosphatase are found in patients with juvenile Paget’s disease, and because OPG knockout mice show similarity to these patients, we believed that an investigation using OPG knockout mice will be helpful in understanding the bone turnover in juvenile Paget’s disease.
Certain drugs, such as bisphosphonates, are prescribed to treat bone diseases such as osteoporosis or Paget’s disease. Bisphosphonate reportedly binds rapidly and tightly to bone minerals, after which osteoclasts incorporate bisphosphonate during bone resorption and induce apoptosis of osteoclasts. Accordingly, the effect of the drug can continue for years after drug therapy has been stopped. However, there are occasions when not only tooth movement has been stopped but also the tooth must be moved again during orthodontic treatment, for which the use of bisphosphonate is considered unsuitable.
Recently, the drug reveromycin A was developed to selectively suppress osteoclast activity. Reveromycin A is an acidic substance produced by actinomyces. It is not absorbed by regular cells but is selectively absorbed by osteoclasts actively secreting acid and dissolving bone. It has been reported that reveromycin A selectively controls apoptosis of activated osteoclasts, has a short half-life, and inhibits bone resorption both in vitro and in vivo.
In this study, mechanical stress in the form of tooth movement was applied to OPG knockout mice serving as an animal model for juvenile Paget’s disease. Although bone tissue undergoes modeling or remodeling by osteoclasts and osteoblasts during tooth movement, the relationships between osteoclasts, osteoblasts, and bone metabolism are not fully understood. Therefore, observation of what occurs to the bony tissues surrounding the teeth during tooth movement can be an effective method for helping to understand the mechanism of bone turnover. The goal of the study was to assess the effects of reveromycin A on the surrounding bony tissue during tooth movement. We examined alveolar bone remodeling in OPG knockout and wild-type mice during tooth movement to test our hypothesis that reveromycin A administration can inhibit bone resorption, decrease tooth movement, and lead to normal bone turnover.
Material and methods
Eight-week-old male OPG knockout (n = 40) and wild-type (C57BL/6J; n = 40) mice were used as the experimental and control animals, respectively. The mice were randomly divided into 2 groups: without reveromycin A for control (n = 20) and with reveromycin A (n = 20). These groups were further divided into 5 subgroups based on the duration of elastic insertion: 0 hours, 2 hours, 12 hours, 1 day, and 3 days (n = 4 in each group). The mice were purchased from Clea Japan (Osaka, Japan) and housed at the animal experimentation laboratory in the School of Dentistry, Aichi-Gakuin University in Nagoya, Japan. The mice were genotyped by polymerase chain reaction analysis following the methods of Mizuno et al. Room temperature and humidity were maintained at 22°C ± 2°C and 50% ± 10%, respectively. A 12-hour light and dark cycle was used. The mice were given free access to solid food (CE-2; Clea Japan) and tap water. All procedures involving the care and use of laboratory animals in this study were performed in accordance with the guidelines for animal experiments at the School of Dentistry at Aichi-Gakuin University and approved by its animal care committee. In this study, reveromycin A (reveromycin A 3 sodium) was used as the experimental drug. Based on the methods of Watanabe et al and Shoji et al, the mice were anesthetized using intraperitoneal pentobarbital. Orthodontic elastic (3M Unitek, Tokyo, Japan) was inserted between the maxillary left first and second molars using 2 tweezers to induce experimental tooth movement of the first molar ( Fig 1 , A ). After insertion of the elastic, excess elastic was cut on the buccal and lingual sides.
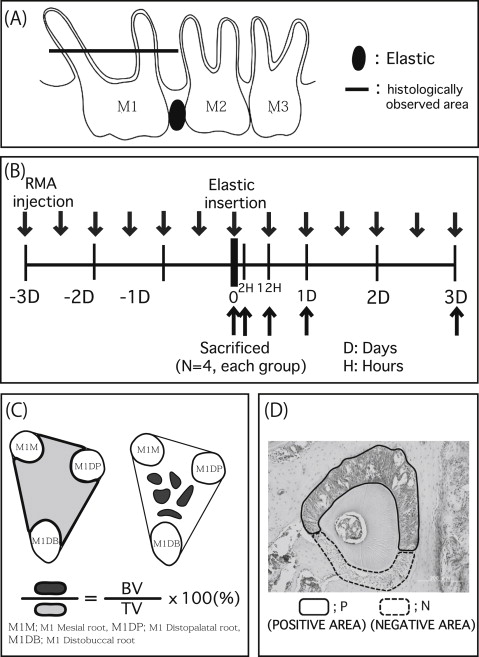
Reveromycin A (15 mg/kg of weight) was administered intraperitoneally twice a day starting 3 days before using the Waldo method in the experimental groups of mice, according to the method of Woo et al ( Fig 1 , B ). An identical volume of physiologic saline solution was administered to the control group.
Two hours, 12 hours, 1 day, and 3 days after elastic insertion, images of the maxillary left alveolar bones and molars were obtained with a microcomputed tomography scanner (SMX-225CT-SV2; Shimazu, Kyoto, Japan). The images were analyzed with TRI/3D-BON software (Ratoc System Engineering, Tokyo, Japan) to determine how much each tooth had moved. Images were rotated 360° for observation and adjusted to ensure that the occlusal view with the narrowest gap between the first and second molars was observed, based on the methods of Shoji et al. A sagittal view was used for observing the height of the alveolar crest of the right first molar’s interradicular septum, the roots of the first molar, and the surrounding alveolar bone. In addition, the bone density of trabecular bone in the first molar’s interradicular septum was measured at the baseline and at 3 days after elastic insertion.
On the day of elastic insertion and at 2 and 12 hours, 1 day, and 3 days later ( Fig 1 , B ), the mice were killed, and maxillary bone was removed. The bone samples were fixed in 10% neutral buffered formalin. The samples were decalcified for 4 weeks using 10% EDTA (pH 7.2) at 4°C, embedded in paraffin, and then cut into 5-μm horizontal sections. The occlusal third of the region between the root furcation and the apex was examined ( Fig 1 , A ). Next, hematoxylin eosin staining, tartrate resistant acid phosphatase (TRAP) staining with an acid phosphatase leukocyte kit (Sigma-Aldrich, St Louis, Mo), and Runx2 immunostaining were performed. The stained sections of the periodontal tissues were examined with a light microscope. The bone volume in the interradicular septum was measured in accordance with the method of Sprogar et al ( Fig 1 , C ). Osteoclast counts (osteoclast number/bone surface) were measured for the TRAP-stained sections of the distal surface of the alveolar bone of the maxillary first molar distopalatal root. To evaluate local osteoblast activity, Runx2 immunohistologic staining was conducted using an Envision+ kit (Dako Cytomation, Kyoto, Japan) with antirabbit Runx2 (M-70, Runx2: 1/1000; Santa Cruz Biotechnology, Santa Cruz, Calif). Following the method of Shoji et al, saturation in the immunohistologic staining was evaluated as follows.
- 1.
After converting the immunostained tissue sections to a gray-scale image with Photoshop (Adobe Systems, San Jose, Calif) ( Fig 1 , D ), the saturation ratios of positive to negative stained areas of the periodontal ligament were expressed at one of 256 gradation levels.
- 2.
Ratios of positive to negative stained areas of the periodontal ligament were also calculated with a point-hit method using grids according to the methods of Kimmel and Jee and Shoji et al.
- 3.
Osteoblastic surface areas (osteoblast surface/bone surface) were examined for sections stained with hematoxylin and eosin of the alveolar bone from the distal surface of the palatal root to obtain the bone-formation parameters.
For the measurement of serum markers of bone turnover, blood samples from the OPG knockout and wild-type mice were collected under diethyl ether anesthesia. A commercial alkaline phosphatase kit was used to measure the alkaline phosphatase serum levels (Liquitech ALP; Roche Diagnostic K.K., Tokyo, Japan). The level of TRAP in blood was measured using an enzyme-linked immunosorbet assay (ELISA) kit (Immunodiagnostic Systems, Scottsdale, Ariz).
Statistical analysis
All data are presented as means and standard deviations, and statistical analyses were carried out by 1-way analysis of variance (Tukey multiple comparison test). All statistical analyses were performed with Prism software (version 5; GraphPad Software, San Diego, Calif), and values of P <0.05 were considered to be significant.
Results
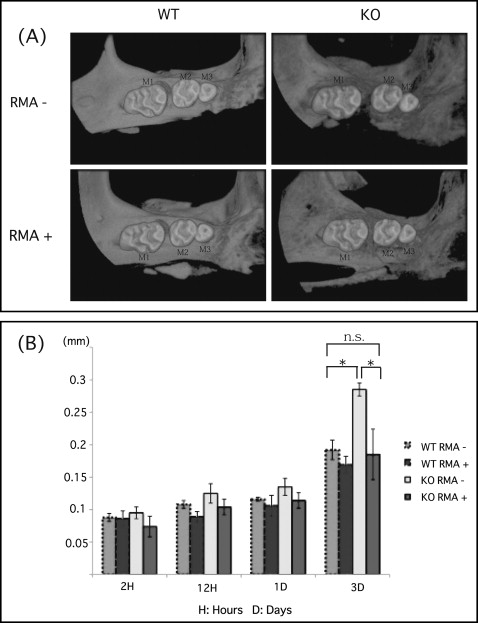
There was no significant difference in tooth movement at 1 day after elastic insertion in any group. However, there was a statistically significant increase in tooth movement in the OPG knockout mice without the reveromycin A after 3 days. This group also showed significantly greater movement than did the wild-type mice without the reveromycin A after 3 days ( Fig 2 ). On the other hand, the OPG knockout mice given the reveromycin A showed significantly less tooth movement than did the OPG knockout mice without the reveromycin A after 3 days. Finally, after 3 days, there was no significant difference between the OPG knockout mice given the reveromycin A and wild-type mice without the reveromycin A ( Fig 2 ).
The alveolar crest of the interradicular septum was observed, and bone density was measured 3 days after elastic insertion using microcomputed tomography scanning. An elastomer predisposes to periodontal inflammation and periodontal bone loss, in addition to subjecting the teeth to mechanical forces. In the wild-type mice without the reveromycin A, there were few changes in the density of the trabecular bone at the first molar interradicular septum and in the alveolar bone between the first and second molars. However, there was considerable resorption of alveolar bone at the first molar furcation and the distopalatal root in the OPG knockout mice without the reveromycin A. The alveolar bone between the first and second molars also exhibited considerable resorption. The bone density of the first molar interradicular septum was significantly lower in the OPG knockout mice without the reveromycin A than in the wild-type mice without the reveromycin A. Bone resorption at the first molar furcation, distopalatal root, and alveolar bone between the first and second molars of the OPG knockout mice given the reveromycin A was suppressed relative to the OPG knockout mice without the reveromycin A. The decrease in bone density at the first molar interradicular septum was significantly lower in the OPG knockout mice given the reveromycin A relative to the OPG knockout mice without the reveromycin A ( Fig 3 ).
The histologic findings in the periodontal tissue were as follows. Before elastic insertion, the alveolar bone trabeculae around the root were arranged in a looser mesh in the OPG knockout mice without the reveromycin A than in the wild-type mice without the reveromycin A. At 1 and 3 days, there was widening on the tension side (bone formation side) and narrowing on the compression side (bone resorption side) of the periodontal ligament relative to the specimens before elastic insertion in the wild-type mice without the reveromycin A. Although there was a small amount of alveolar bone resorption, no significant changes in the bone trabeculae were observed. After 3 days, there were considerable changes in the bone trabeculae and a significant bone volume decrease in the interradicular septum in the OPG knockout mice without the reveromycin A. Interradicular septum bone resorption observed in the OPG knockout mice without the reveromycin A was suppressed in the OPG knockout mice given the reveromycin A; no considerable changes in the bone trabeculae were observed, indicating no change of volume in the alveolar bone ( Fig 4 , A and B ). Moreover, the OPG knockout mice without the reveromycin A showed a significantly higher number of osteoclasts than did the wild-type mice without the reveromycin A at 3 days ( Fig 4 , C ). The number of osteoclasts was significantly lower in the wild-type mice given the reveromycin A relative to the wild-type mice without the reveromycin A. In the OPG knockout mice groups, the mice given the reveromycin A showed significantly fewer osteoclasts than did the mice without the reveromycin A ( Fig 4 , C ).
In the OPG knockout mice without the reveromycin A, expression of Runx2 on the tension side of the periodontal ligament was considerably greater than that of the wild-type mice without the reveromycin A at 2 hours, but it had decreased considerably at 12 hours. There was a further decrease in Runx2 expression at 1 day. Peak Runx2 expression occurred between 1 and 12 hours in the wild-type mice without the reveromycin A and at 2 hours in the OPG knockout mice without the reveromycin A ( Fig 5 , A and B ). In both groups, Runx2 positivity was first observed on the tension side of the periodontal ligament and then on the compressed side, spreading over the entire ligament. At all times, the areas surrounding the periodontal ligament tended to stain more widely for Runx2 in the OPG knockout mice without the reveromycin A than in the wild-type mice without the reveromycin A. There was a significant difference in the area stained between the 2 groups, with Runx2 staining at 1 day ( Fig 5 , A and C ). In the OPG knockout mice given the reveromycin A, the expression of Runx2 was strongly expressed on the tension side of the periodontal ligament 2 hours after elastic insertion. At 12 hours in the OPG knockout mice given the reveromycin A, the expression of Runx2 became stronger relative to the OPG knockout mice without the reveromycin A. The peak in the OPG knockout mice without the reveromycin A was at 2 hours, but after administration of reveromycin A, the expression peak was at 12 hours. Although there was a difference in the strength of the expression, there was a similarity in the transition of the Runx2 expression of the OPG knockout mice given the reveromycin A and the wild-type mice without the reveromycin A ( Fig 5 , A and B ). The area of the OPG knockout mice given the reveromycin A showed a reaction exclusively at the tension side by 1 day after elastic placement. The transition of the expression of the OPG knockout mice given the reveromycin A was similar to that of the wild-type mice without the reveromycin A in terms of the area that reacted to Runx2 ( Fig 5 , A and C ).
At 3 days, the bone formation parameter (osteoblast surface areas) of the OPG knockout mice without the reveromycin A showed a significantly higher value than that of the wild-type mice without the reveromycin A. In the OPG knockout mice, the bone formation parameter of the group that received the reveromycin A was significantly lower than that of the group without the reveromycin A ( Fig 6 ).


