Introduction
The purpose of this study was to quantify anteroposterior and transverse facial soft-tissue changes with respect to underlying skeletal movements after maxillomandibular advancements by using cone-beam computed tomography.
Methods
Thirty white patients were treated by maxillomandibular advancements after LeFort I osteotomies and bilateral sagittal split osteotomies. The patients were scanned by using cone-beam computed tomography within 1 week before the surgery, within 1 week after the surgery, and a minimum of 8 weeks postsurgery. We measured the differences between the first and last images and calculated ratios for anteroposterior and transverse soft-to-hard tissue movements. Changes in the greatest interalar width were also measured.
Results
There was a statistically significant difference in the greatest interalar width change between patients receiving maxillary advancements greater than 4 mm and those having advancements less than or equal to 4 mm ( P <0.023). Mean ratios of anteroposterior soft-to-hard tissue movements were 84.9% ± 38.0% in the malar region, 96.1% ± 15.5% in the chin, and 101.1% ± 27.3% in the subcommissural region. Mean ratios of transverse soft-to-hard tissue movements were 39.4% ± 19.7% in the malar region and 82.5% ± 56.7% in the subcommissural region.
Conclusions
The amount of maxillary advancement most likely plays a role in the postsurgical increase in interalar width. In addition, facial soft tissues appear to respond more to anterior movement of the jaws than to an increase in transverse dimensions after maxillomandibular advancements.
One goal of orthodontic treatment is to maintain or improve a patient’s facial balance. When orthognathic surgery is performed in conjunction with orthodontics, the capacity to alter facial appearance is increased. Even with the ability to optimally reposition the jaws through orthognathic surgery, however, a patient’s final soft-tissue appearance might not reflect the exact movements of the jaws. Because of factors such as soft-tissue thickness and elasticity, the facial soft-tissue drape does not always follow the movement of the underlying skeleton at a 1:1 ratio. A thorough understanding of the soft-tissue response to underlying skeletal movement is necessary for treatment planning, prediction, patient education, and informed consent.
Numerous studies have attempted to quantify facial soft-tissue changes after orthognathic surgery. A consistent finding was that the alar base width and the greatest interalar width of the nose generally increase after maxillary advancements and impactions. Because of this potentially undesirable side effect, most surgeons place an alar base cinch suture to aid in controlling the final width of the alar base, and several studies suggest that this procedure is helpful.
Another frequently studied soft-tissue region is that overlying the chin. By measuring the differences between presurgical and postsurgical lateral cephalograms, several studies have shown that the soft-tissue chin region advances at about 100% of the amount of mandibular advancement. Using 3-dimensional (3D) laser-scanning techniques, McCance et al observed a 125% average for the soft-to-hard tissue ratio of thechin.
Few studies have attempted to quantify postsurgical soft-tissue changes in facial regions lateral to the midline because these structures are usually not identifiable on traditional 2-dimensional cephalograms. Furthermore, repeatedly identifying nonmidline soft-tissue landmarks is difficult even with newer 3D imaging techniques because these tissues are broad and curved. Nonetheless, by superimposing 3D laser facial scans, McCance et al found a soft-to-hard tissue response of 150% in the paranasal regions after maxillary advancements, but Soncul and Bamber reported findings closer to 75% for similar measurements. In another laser facial-scanning study, McCance et al showed progressively decreasing soft-tissue responses to maxillary advancements as the location of measurement moved away from the midline.
Another region of the face that few studies have attempted to quantify is the soft tissue covering the lateral aspects of the mandible, particularly after mandibular advancements. McCance et al demonstrated smaller soft-to-hard tissue movement ratios lateral to the midline in the mandible. The soft tissues overlying the chin, mentalis, and canine regions advanced 125% of the amount of mandibular advancement, whereas the soft tissues over the body of the mandible approached only a 100% ratio.
Most studies quantifying soft-tissue profile changes after orthognathic surgery have been comparisons of presurgical and postsurgical lateral cephalograms, but these studies largely neglect nonmidline structures and facial shapes. In the past few decades, several techniques have been developed to analyze patients 3-dimensionally, but most of these methods include only soft-tissue information. Cone-beam computed tomography (CBCT), on the other hand, gives clinicians high-resolution images with both soft-tissue and hard-tissue information. Additional benefits include lower costs and less radiation exposure to patients than conventional computed tomography. The purpose of this study was to quantify both anteroposterior and transverse facial soft-tissue changes with respect to underlying skeletal movements after maxillomandibular advancements by using CBCT.
Material and methods
The records of 30 white patients were collected from a private practice in oral surgery. The average patient age was 27.9 years (range,16–63 years); the sample included 10 male and 20 female subjects. The patients had received maxillary and mandibular advancements with rigid fixation, all performed by 2 oral surgeons using the same protocol. Eleven patients with malar deficiency also received malar augmentations in the form of Interpore-200 (Nobel Biocare, Yorba Linda, Calif) and Avitene (C. R. Bard, Woburn, Mass) heat-treated grafts. These grafts are moldable mixes of porous hydroxyapatite and microfibrillar collagen, and were also used to augment the antegonial notch regions when necessary. Ten patients received advancement genioplasties. All patients received alar base cinches, and V-Y advancement mucosal closures were performed as necessary for patients requiring more upper lip fullness. Alar base cinches were tightened at the surgeon’s discretion. All patients received comprehensive orthodontic treatment before and after surgery.
All patients had 3 CBCT scans: within 1 week presurgery (T0), within 1 week postsurgery (T1), and at least 8 weeks postsurgery (T2). The range for the T2 scans was 8 to 17 weeks, with a mean of 10 weeks. All scans were taken with the patient in centric relation, without a splint. The scans were made with an i-CAT CBCT scanner (Imaging Sciences International, Hatfield, Pa) and required 40 seconds each. Voxel size was set at 0.25, and each scan contained 555 slices, sufficiently encompassing the region of interest.
Each data set was imported directly into Amira (version 4.1.1, Mercury Computer Systems, Chelmsford, Mass). The scans were superimposed by using skeletal structures unaffected by the surgeries: outer surfaces of the frontal and sphenoid bones, and the superior regions of the outer surfaces of the zygomas. After selecting these regions, the automatic affine registration tool of Amira was used for stepwise superimposition. This tool uses Hounsfield-value distribution to calculate a measurement describing a “distance” between 2 data sets to be superimposed. This measurement is automatically minimized during registration, and the original shape of the data is preserved with rigid transformation ( Figs 1 and 2 ).
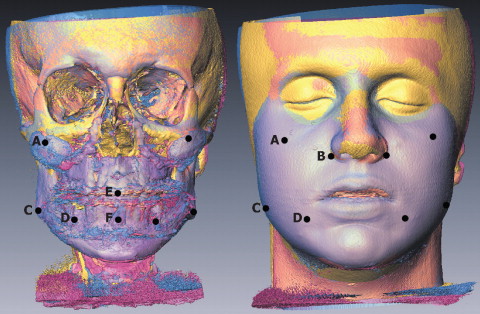
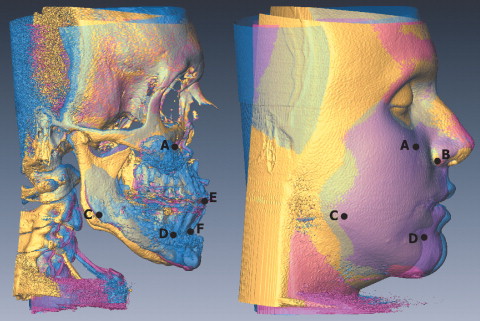
All data were acquired by using Amira. All hard-tissue changes were measured at 500 Hounsfield units (HU); soft-tissue changes were recorded at −900 HU. Cross-sectional reference planes were established to ensure that all measurements were recorded similarly for each patient ( Fig 3 ).
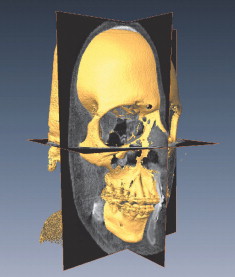
In the T0 image, the horizontal plane was created first and rotated until it was parallel with the Frankfort horizontal plane. Next, the sagittal plane was created, oriented perpendicular to the horizontal plane, and rotated until it was parallel to the midsagittal plane (determined by nasion and sella in this study). Last, the coronal plane was generated and oriented perpendicular to both of the other planes. The orientations of the planes were then locked, but the planes could still be moved in the third dimension, always remaining parallel to their initially established orientations. Planes were moved to each region of interest, and all measurements were recorded along the intersectionsof the planes to ensure consistency with the direction ofmeasurement.
Surgical advancement of the maxilla was determined by measuring the change between the T0 and T1 images at the mesio-incisal edge of the maxillary right central incisor. Although using A-point to measure maxillary advancement might have been more ideal, this point was unidentifiable on the CBCT scan because of an overlying fixation plate. Advancement of the mandible was measured at B-point. All soft-tissue changes were measured between the T0 and T2 images. Anteroposterior and transverse changes over malar implants were measured at the point of maximum anterior and transverse projection of the implant, respectively.
To measure the anteroposterior hard-tissue change of a malar implant, the horizontal and sagittal planes were placed over the point of maximum anterior projection of the implant, and a measurement was taken between the 2 images along the intersection of the 2 planes ( Fig 4 ).
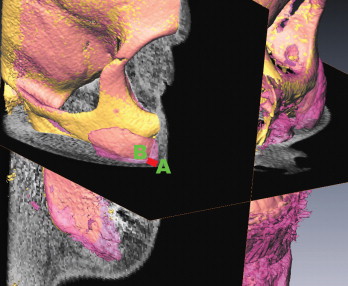
Then, without moving the planes, the Hounsfield units were adjusted to view the soft tissues, and a measurement was taken between the 2 soft-tissue images along the intersection of the 2 planes ( Fig 5 ). In this manner, soft-tissue changes were compared with the directly underlying hard-tissue changes. The soft-to-hard tissue movement ratios (percentages) were calculated by dividing the value of the soft-tissue change by the value of the hard-tissue change. Transverse changes at the malar implants were recorded in the same manner, but using the coronal plane in place of the sagittal plane and measuring at the point of maximum lateral projection of the implant.
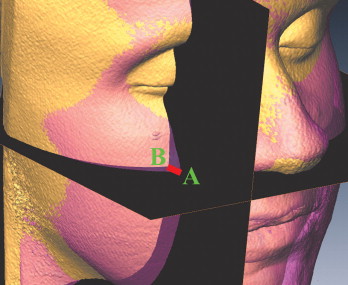
By using this same method, measurements were recorded for anteroposterior changes at pogonion, both anteroposterior and transverse changes at the subcommissural regions, and transverse changes at the gonial regions. Both anteroposterior and transverse measurements in the subcommissural regions were recorded from points just anterior to the rims of the mental foramina. The location of the transverse measurement in the gonial regions was constructed by setting the horizontal plane at the level of the maxillary central incisors, whereas the coronal plane was set at the level of the most inferior projection of the articular eminence.
Measurements were not recorded if the planes intersected over a fixation plate or screw on the T2 image because this might have produced a misleadingly large measurement of hard-tissue change. The right and left sides were not compared; all bilateral measurements were combined for all calculations.
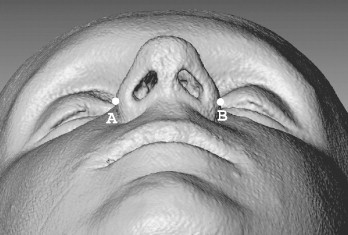
The only measurements not recorded parallel to the reference planes were the greatest interalar widths, because the greatest interalar width is unlikely to exist parallel to these planes. These measurements were first recorded while viewing the noses from the inferior aspect ( Fig 6 ) and then verified by rotating the images and viewing the noses from several angles.
Statistical analysis
Descriptive statistics were calculated for all soft-to-hard tissue movement ratios and for the changes in greatest interalar width. The Mann-Whitney test was used to test for significant differences in the greatest interalar width change between patients who received maxillary advancements less than 4.0 mm and those who received advancements greater than or equal to 4.0 mm. T tests for equality of means or Mann-Whitney tests (for calculations in groups with fewer than 20 patients) were also used to test for significant differences in all mandibular measurements between patients who received genioplasties and those who did not. Finally, t tests for equality of means or Mann-Whitney tests were used to test for significant differences in the mandibular measurements between patients who received mandibular advancements less than 10.0 mm and those who received advancements greater than or equal to 10.0 mm. Ten percent of the sample was remeasured to test for reliability with an intraclass correlation coefficient. All statistics were calculated by using SPSS software for Windows (version 14.0, SPSS, Chicago, Ill) on a personal computer.
Stay updated, free dental videos. Join our Telegram channel
VIDEdental - Online dental courses


