Introduction
The recent emphases on soft tissues as the limiting factor in treatment and on soft-tissue relationships in establishing the goals of treatment has made 3-dimensional (3D) analysis of soft tissues more important in diagnosis and treatment planning. It is equally important to be able to detect changes in the facial soft tissues produced by growth or treatment. This requires structures of reference for superimposition and a way to display the changes with quantitative information.
Methods
In this study, we outlined a technique for quantifying facial soft-tissue changes viewed in cone-beam computed tomography data, using fully automated voxel-wise registrations of the cranial base surface. The assessment of soft-tissue changes is done by calculation of the Euclidean surface distances between the 3D models. Color maps are used for visual assessment of the location and the quantification of changes.
Results
This methodology allows a detailed examination of soft-tissue changes with growth or treatment.
Conclusions
Because of the lack of stable references with 3D photogrammetry, 3D photography, and laser scanning, soft-tissue changes cannot be accurately quantified by these methods.
Soft tissues establish the limit to which the orthodontist can alter the dimensions of the dental arches and the position of the jaws from both esthetic and stability standpoints. Assessment of soft-tissue changes produced by growth or treatment requires 3-dimensional (3D) analysis and superimposition because of the complexity of soft-tissue behavior and the inability to measure asymmetries in 2-dimensional (2D) images. Recently, technologies such as 3D photogrammetry and laser scanning of the face have been used for 3D soft-tissue superimposition, but their major limitation has been the inability to standardize registration of the images over time. Current procedures to integrate 3D facial images had significant errors in head positioning, and potential errors in facial expression have not been assessed.
The variability of soft-tissue surface appearance has important consequences for the choice of approaches for adequate registration of longitudinal images. A stable reference for superimposition of images is required for a standardized record of the relationship between the facial soft tissues and the underlying skeletal and dental structures. Currently, cone-beam computed tomography (CBCT) allows the use of stable reference structures.
No soft-tissue structures are stable enough to allow registration between pretreatment and posttreatment images, because the soft tissues change with growth, treatment, head posture, weight gain or loss, aging, and facial expression. In 2D cephalometrics, the cranial base often is used for superimpositions to show both hard-tissue and soft-tissue profile changes because it has minimal changes after neural growth is completed. Although 2D landmark location is hampered by overlapping structures, locating 3D landmarks on complex curving structures is significantly more difficult and prone to identification errors. Even though landmark-based geometric morphometric methods have been increasingly applied to the study of human form over the last 2 decades, the use of landmarks is not sufficient because they cannot describe biologic forms and patterns. Craniofacial structural information is represented by surfaces, curves, and outlines. The sliding semilandmark method was proposed to analyze outlines extending the standard Procrustes superimposition procedure. In addition to translating, scaling, and rotating landmarks optimally, the semilandmark points are slid along the outline curve until they match as well as possible the positions of corresponding points along an outline in a reference configuration. However, semilandmarks do not include information from the whole curves and surfaces. A workable interpretive system of the biology of craniofacial growth demands the assessment of the complex cause-and-effect interactions among bones growing simultaneously, but with different timing.
Fortunately, 3D registration can be based on stable surfaces instead of landmarks. The purposes of this study were to determine whether 3D imaging technology can quantify soft-tissue changes, describe a method for cranial superimposition of CBCT data to accurately evaluate soft-tissue treatment outcomes, and put problems in combining other 3D imaging modalities with CBCT in perspective. We demonstrated the application of a fully automated voxel-wise rigid registration at the cranial base to evaluate 3D soft-tissue changes. Establishing this technology has been the focus of several previous studies, and our progress to date is described here.
Material and methods
The steps in the process of 3D image acquisition and analysis for evaluation of facial change are the following.
Images are acquired with CBCT equipment specialized for maxillofacial imaging with a relatively low dose of radiation and a convenient way to follow changes in facial morphology in 3 dimensions for both growing and nongrowing subjects. For studies of facial changes, the CBCT scans should be acquired with a large field of view so that the entire facial anatomy can be viewed. For the subjects of our study, either the iCat (16 × 22-cm field of view; Imaging Sciences, Hatfield, Pa) or the NewTom 3G (12-in field of view; AFP Imaging, Elmsford, NY) scanner was used. The images were reformatted to yield a voxel size of 0.5 mm and then cropped to facilitate image analysis. Experimental protocols were approved by the institutional review board and the radiation safety committee of the University of North Carolina.
The serial CBCT images to evaluate changes over time were analyzed in a sequence of 4 steps: (1) model construction, (2) image registration, (3) transparency overlay, and (4) quantitative measurement.
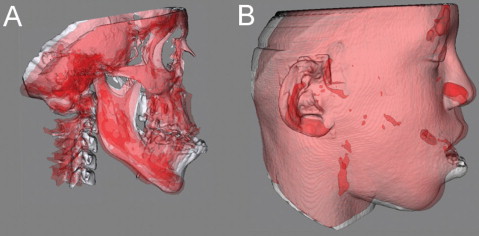
Surface 3D models were constructed by using open-source software (ITK-SNAP, National Library of Medicine and National Institutes of Health, Bethesda, Md; available for free). A surface model of the cranial base was created for the registration in our approach ( Fig 1 ). Construction of surface models requires the generation of an intermediate surface representation (triangular mesh) of the craniofacial structures that is different from the methods used in currently available commercial softwares that create a 3D projected view directly from the volume data (volume rendering). The surface-based method facilitates establishing boundaries between anatomic structures and assigning the proper color label and transparency values to obtain separate displays of the mandible, the maxilla, and the cranial base.
The IMAGINE software (National Institutes of Health, Bethesda, Md; available for free) was modified at the University of North Carolina and then used to mask facial structures displaced with growth or treatment, and to perform a fully automated, voxel-wise, rigid registration at the cranial base. The registration of the cranial base uses maximization of mutual information to avoid observer-dependent techniques based on overlap of anatomic landmarks. After the software masks the maxillary and mandibular structures, it compares the gray level intensity of each voxel in the cranial base to register the 2 CBCT images. These rotation and translation parameters are also applied to register the 3D models. After registration, we can assess the overlay of the 3D models.
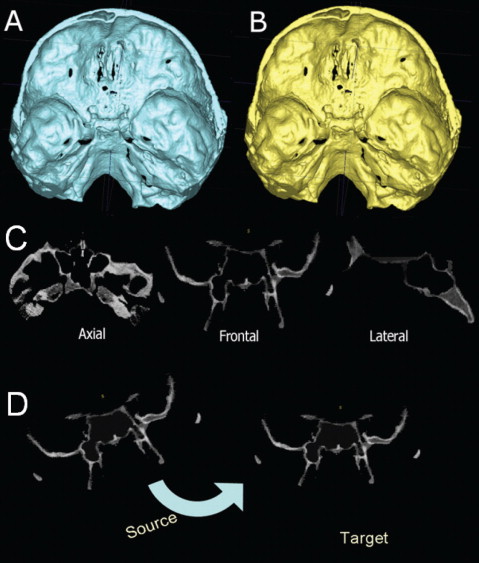
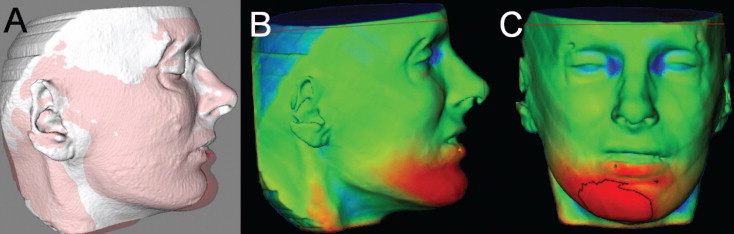
For subjects whose cranial base growth is complete, registration is done with the gray level CBCT data sets at the whole surface of the cranial base ( Figs 2 and 3 ). The larger the surface used, the more robust the registration. For this reason, for adults, the whole cranial base surface is used for registration. For growing patients, the registration requires 2 steps. First, an initial head alignment is done by using the whole cranial base, with a finer registration at the stable structure on the anterior cranial base.
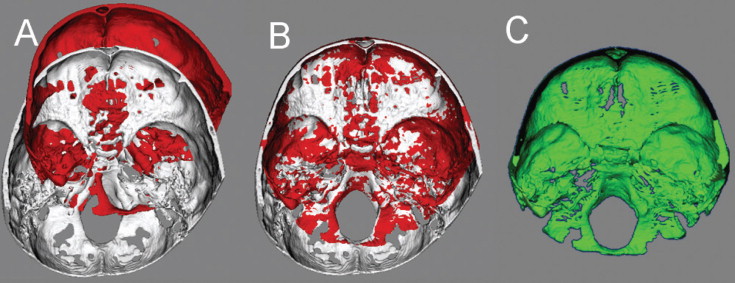
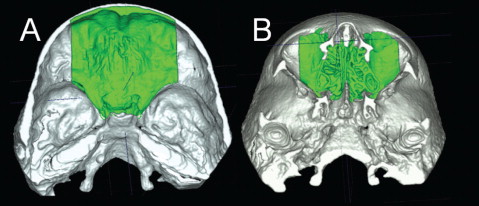
For growing subjects, there is still growth in the sphenooccipital synchondrosis, the lateral wall of the skull, and the frontal lobes and sinuses. For this reason, the registration of the before-and-after treatment CBCT images of growing subjects requires 2 steps. First, the head is aligned by using the whole cranial base, and then a finer registration with optimal alignment gray level CBCT data sets is performed with subvoxel accuracy at the stable structures on the anterior cranial base (IMAGINE software, Fig 3 ). This registration uses a smaller surface area that includes anterior cranial base structures that have completed growth by age 7: anterior wall of the sella, anterior clinoid processes, planum sphenoidale, lesser wings of the sphenoid, superior aspect of the ethmoid and cribriform plates, cortical ridges on the medial and superior surfaces of the orbital roofs, and inner cortical layer of the frontal bones ( Fig 4 ).
Validation studies of the registrations of growing and nongrowing subjects have shown that maximum registrations errors are smaller than the image spatial resolution of 0.5 mm.
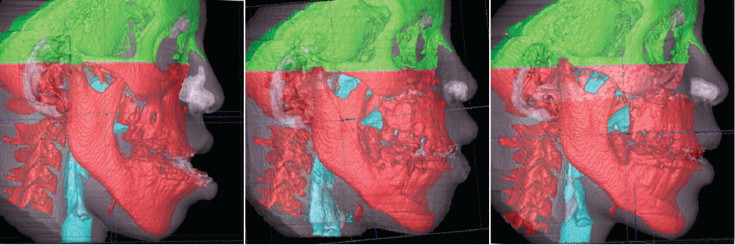
The next step in the analysis involves overlaying the 3D model surfaces that are registered in the same coordinate system. This is done with another tool, CMF software (Maurice Müller Institute, Bern, Switzerland). This tool allows different degrees of transparencies to assess visually the boundaries of the soft-tissue structures between superimposed models from 2 time points. This clearly identifies the location and direction of dental, bone, and soft-tissue displacements, and allows correlation of hard- and soft-tissue changes ( Fig 5 ).
The CMF software is then used to measure overall facial changes and display color maps generated from closest-point distances between the surfaces as proposed by Gerig et al. The CMF tool calculates thousands of color-coded surface distances in millimeters between before and after treatment 3D models by using surface triangles at 2 times, so that the difference between the 2 surfaces at any location can be quantified. Isolines (contour line tool) are used to delineate and quantify surface changes for specific regions of interest, such as the nose, cheeks, upper and lower lips, and chin ( Fig 6 ). Soft-tissue changes are described as displacements relative to the cranial base.
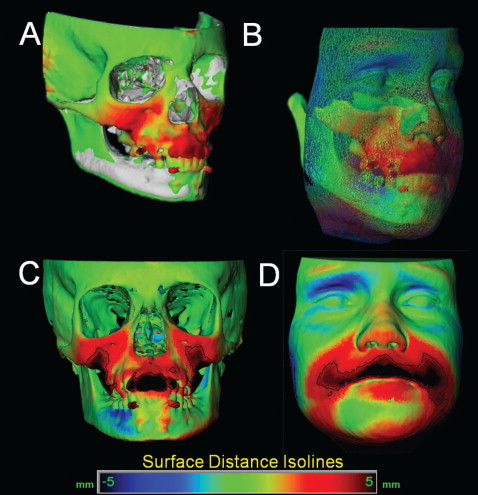
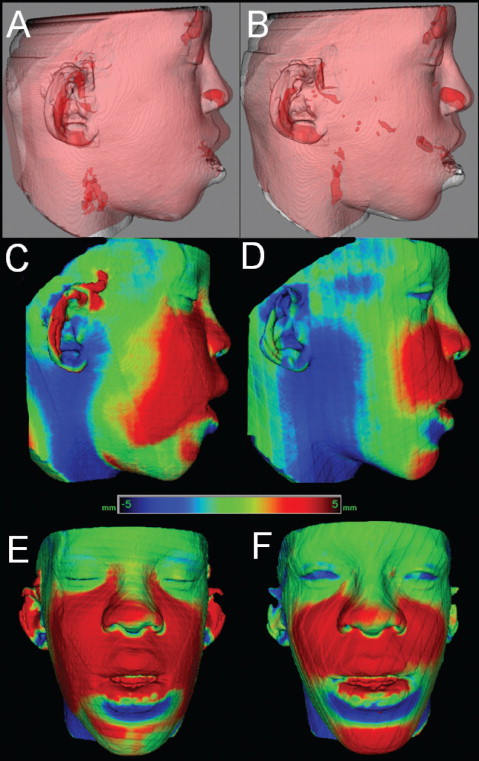
The quantitative changes are visualized by using color maps, which can be used to indicate inward ( blue ) or outward ( red ) displacement between overlaid structures, registered at the cranial base. An absence of changes is indicated by the green color code. For example, in mandibular advancement surgery, forward chin and lower lip displacement would be shown in a red color code; in mandibular setback surgery, lower lip and chin surfaces would be shown in the blue color code ( Figs 7 and 8 ). This method for showing quantitative changes at many locations has been validated and used since 2005.
Discussion
Image registration is a core technology for many imaging tasks. Research efforts over the past 20 years in dentistry, medicine, and anthropology have been directed to developing 3D registration tools for quantitative assessment of facial soft and hard tissues. According to the transformation applied to the images, registration procedures can be classified into 2 main groups: rigid and nonrigid. The transformation involved in a rigid registration procedure includes translation and rotation; that of a nonrigid registration includes translation, rotation, scale, and affine properties. Rigid registration can be based on landmarks, semilandmarks, curves, planes, surfaces, or voxels (mutual information). Nonrigid registration can be based on landmarks, elastic models, fluid models, splines, and finite element models. The 2 obstacles to widespread clinical use of nonrigid (elastic and deformable) registration are computational cost and quantification difficulties as the 3D models are deformed. Nonrigid registration would be required to create a composite of several jaw shapes to guide the construction of template or standard, normal 3D surface models. To evaluate longitudinal changes, rigid registration is acceptable, and we used voxel-based registration on the cranial base of the before-and-after treatment CBCT images.
Although CBCT images are lower in contrast than computed tomography (CT) images, the soft and hard tissues are well visualized. Diagnostic benefit and dose detriment tradeoffs are important considerations in choosing radiographic procedures. Concern has recently been raised about the increasing numbers of CT examinations in the United States and the increased cancer risks, especially in children, from these examinations. Dental CBCT can be recommended as a dose-sparing technique compared with alternative standard medical CT scans for common oral and maxillofacial radiographic imaging tasks. Until we have clear evidence for a threshold dose below which our patients are not at risk, we must assume that radiography involves a small, but real, risk to our patients. CBCT volumes also allow reconstruction of 2D panoramic, lateral, anteroposterior, and axial x-rays, eliminating the need for additional radiographic acquisitions.
Although CBCT images show the soft-tissue surfaces accurately and therefore are excellent for displaying changes from growth, aging, or treatment, 3D photographs provide additional information about color and surface texture, as well as higher resolution of soft-tissue surfaces. Because of the low radiation dose, the soft tissues visualized in CBCT can have a somewhat roughened texture. Currently available software programs have tools for superimposition of 3D photographs on landmarks or surface-based regions in the soft tissues, but these soft-tissue structures are not stable enough to serve as superimposition references. The result is an unknown amount of distortion. Even though the patient “wow” factor with morphed 3D photos might be advantageous from a marketing perspective, no data validate the accuracy of the changes that are displayed to quantify them over time. It seems a desirable goal to combine CBCT and 3D photography.
There are problems in registering 3D soft-tissue photographs to CBCT soft tissues ( Fig 9 ). For 3D photographs and CBCT images obtained at close but separate times, Maal et al reported that the registration errors between 3D photographs and CBCT images were relatively large at the lateral neck and mouth, and around the eyes, with 90% to 95% of the error in the ±1.9-mm range. Even after exclusion of artifact regions from the matching process, 90% to 95% of the error was within ±1.5 mm. An important step toward overcoming these problems would be simultaneous acquisition of CBCT and 3D photographs, but that is not possible now and might not be in the future. Problems that need to be overcome with 3D photograph superimposition include (1) inadequate use of fiducials, (2) head position in acquisition, (3) soft-tissue capture errors, and (4) current use of nonrigid registration deformation of soft-tissue contours to allow matching of 3D photographs to CBCT soft tissues.


