Introduction
White spots (WS) related to orthodontic treatment are severe cariologic and cosmetic complications, but they are shown to be partially reduced by remineralization or abrasion in short-term follow-ups. In this prospective study, we quantitatively analyzed changes in WS in general and in treatment-related white spot lesions (WSL) during orthodontic treatment and at a 12-year follow-up after treatment. In addition, we quantitatively compared the effects of an acrylic bonding material vs a glass ionomer cement (GIC) on WSL.
Methods
Sum areas of WS and WSL were calculated on scans of standardized photos of the vestibular surfaces of 4 teeth in consecutive orthodontic patients (median treatment time, 1.7 years) bonded with the 2 materials in a split-mouth design. Comparisons were made in 59 patients before treatment (BF), at debonding (T0), at 1 year (T1), and at 2 years (T2), and in 30 patients at a 12-year follow-up (T3) with the Friedman test followed by pairwise comparisons with the Wilcoxon matched-pairs signed rank test. Differences of the effects of acrylic vs GIC on the sum areas of WSL were tested for each observation period with the Mann-Whitney U test.
Results
Increases in the sum areas of WS and WSL from BF to T0 ( P <0.001) were followed by significant decreases at T1 ( P <0.001) and T2 ( P <0.01 for WS; P <0.001 for WSL). Significant changes were also found in the sum areas for WS at T3 compared with T2 ( P <0.01), but not for WSL ( P = 0.328). The sum areas of WS and WSL at T3 did not return to BF levels ( P <0.001). Sum areas of WSL were higher for surfaces bonded with acrylic compared with GIC for each observation period from BF to T2 ( P >0.001), and from T2 to T3 ( P >0.05).
Conclusions
Although significantly reduced during the 12-year follow-up and significantly lower with the GIC than the acrylic material at bonding, WSL are a cariologic and cosmetic problem for many orthodontic patients.
Areas of local decalcification of enamel without cavity formation are well-known complications of orthodontic treatment with a fixed appliance. Prevalence of these white spot lesions (WSL) in patients after orthodontic treatment varies from 15% to 85%, with most studies reporting 50% to 70%. This high prevalence is explained by difficulties in performing oral hygiene procedures on bonded dental arches along with long-time accumulation and easier retention of bacterial plaque on tooth surfaces around fixed orthodontic elements. The incidence and severity of WSL are lower if caries-preventive methods are used during orthodontic treatment, such as fluoride mouthwashes, but patients’ compliance in using them is often unsatisfactory. Some studies have shown that fluoride-releasing bonding materials, such as glass ionomer cements (GIC), can decrease the incidence of white spots (WS) after fixed appliance treatment when compared with acrylic-based materials, but results of long-term studies are lacking.
The term white spot lesion was defined by Fejerskov et al as “the first sign of a caries lesion on enamel that can be detected with the naked eye.” Depending on the oral environment, these spots can either develop into cavities, stay stable for a long time, or heal to a certain extent. Postorthodontic WSL were shown to decrease during the first and second years after debonding. The observed clinical reduction or healing of WSL after orthodontic treatment can be explained by removal of an etiologic factor (cariogenic plaque adhered to fixed orthodontic elements) combined with abrasion of the surface enamel during tooth brushing and also by remineralization. Årtun and Thylstrup attributed the decrease in WSL to be “primarily a result of surface abrasion in addition to some redisposition of minerals.” However, areas of demineralization will still remain on the teeth for up to 5 years after orthodontic treatment and thus be a cosmetic problem, but there is a shortage of conclusive long-term studies on changes in WSL after orthodontic treatment.
In addition to being caused by a cariologic process, white spots on the surface of enamel can have other origins—eg, a result of developmental disturbances during enamel formation. In 13-year-olds, these enamel defects are reported to have a prevalence of 63% and can cause similar cosmetic problems and thus be confused with WSL induced by orthodontic treatment. As shown earlier, a differentiation between them can and should be made.
To assess WSL in orthodontic practice, a method introduced by Gorelick et al has become the standard method of visual assessment. The major disadvantage of this qualitative method is that it is insensitive to small and moderate changes in WSL. Quantitative methods of assessment of demineralized spots, such as quantitative light-induced fluorescence, have been described, but they require special equipment and skills. Another approach to quantitative investigation of WS is to measure the area of demineralized enamel on photographic images of the teeth. The accuracy of such measurements is similar to the more sophisticated methods of enamel demineralization assessment.
In this study, we quantitatively analyzed changes in WS in general as well as treatment-related WSL during orthodontic treatment and at a 12-year follow-up after treatment: 14 years in all. Thus, we analyzed the risk of prolonged cosmetic and cariologic complications. We also quantitatively compared the effect of an acrylic bonding material vs a GIC on these lesions.
The first null hypothesis was that there were no differences in areas of WS and WSL between the examinations during 14 years. The second null hypothesis was that there are no differences in the areas of WSL related to the 2 bonding materials.
Material and methods
This was a prospective study of 60 consecutive orthodontic patients from the Department of Orthodontics, Umeå University clinic, in Sweden, examined when their fixed preadjusted appliances were placed, at debonding, and 1, 2, and 12 years after debonding. One patient declined to participate in the follow-up 1 year after debonding and another one at 2 years after debonding. Before the examinations at 12 years after debonding, a patient with incomplete documentation was excluded from the study, resulting in 59 participants, who were then traced in the Swedish Population Register. Forty-one patients, still living within 50 km of the clinic, were invited to participate in the examinaiton. Five of the 41 did not reply, and 6 declined to participate. Thus, 30 patients were examined at 12 years after debonding ( Table ).
| Examination | Participants (n) | Median age/minimum-maximum (decimal years) | Median time to debonding/minimum-maximum (decimal years) | ||
|---|---|---|---|---|---|
| Total | Female | Male | |||
| Before treatment | 59 | 38 | 21 | 13.6/10.8-19.1 | 1.7 (median treatment time)/1.34-2.76 |
| At debonding | 59 | 38 | 21 | 15.3/12.5-20.9 | – |
| 1-year follow-up | 58 | 37 | 21 | 16.5/13.7-21.9 | 1.0/0.83-1.31 |
| 2-year follow-up | 58 | 37 | 21 | 17.4/14.7-23.1 | 2.1/1.78-2.27 |
| 12-year follow-up | 30 | 18 | 12 | 27.9/25.0-34.5 | 12.4/11.29-13.16 |
Four teeth—maxillary left and right lateral incisors, and mandibular left and right canines —in each patient were evaluated. Teeth in the maxilla and the mandible were randomly allocated to be bonded with a no-mix acrylate (Unite, 3M Unitek, Monrovia, Calif) or a GIC (AquaCem, De Trey Division, Dentsply, Weybridge, Surrey, United Kingdom) in a split-mouth design.
The oral examination 12 years after debonding was supplemented by a questionnaire on dental treatment and caries prevention after orthodontic treatment. The questionnaire showed that no patient had received enamel bleaching, no examined teeth were treated, and no systematic fluoride supplement had been used after debonding.
Color photos of the studied teeth were taken actual size (1:1 scale) with a Nikon F4 camera and medical Nikkor lens 120-mm f/4.0 with incorporated ring flash (both, Nikon, Tokyo, Japan). Although it was impossible to use the same film type during the whole study period, positive films with the same characteristics were used.
To minimize reflection and glare on the enamel surface that could mask its original color, 2 photos of each air-dried tooth surface were taken: parallel to the center of tooth surface, and at an angle of 2° to 3°. Thus, a pair of slides of the same vestibular tooth surface of the each studied tooth at every examination was available for assessment, for a total of 1056 pairs of slides.
To choose the appropriate scanning resolution, the difference between resolutions of 2400 and 3200 dpi was tested in 25 slides scanned with the Epson Perfection 4990 Photo scanner (Seiko Epson, Nagano, Japan). High agreement was found between measurements of areas of spots on slides scanned at the 2 resolutions (ICC = 0.998), but scanning with 3200 dpi resolution was more time-consuming. Thus, all slides were scanned at 2400 dpi (24-bit color normal), named, and saved in tagged image file format (TIFF) on an external hard drive.
Both images from each pair were enlarged by 600% in the FACAD cephalometric software (version 2.2, Ilexis AB, Linköping, Sweden) and visually compared; the one without reflection and glare or with minimal reflections was chosen for further assessment.
To ensure blindness during the image-analysis stage, all selected images were renamed according to a table of random numbers, and the renaming key was sealed in an envelope and stored by an independent person until the end of all measurements. In this way, tooth surfaces from various subjects photographed at different examinations were mixed up, and the researchers were unaware of which image belonged to which patient at which examination.
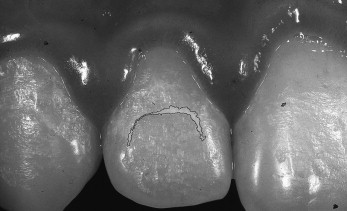
To calculate the area of WS, each image was enlarged by 600% in the FACAD 2.2 cephalometric software. The border of every WS on the tooth surface was hand-outlined by using a mouse (IBM MU29j, International Business Machines, Singapore, China) as shown in Figure 1 . The area within the WS’s border was automatically calculated in square pixels by the cephalometric software and transferred into the SPSS database (version 15.0, SPSS for Windows, SPSS, Chicago, Ill).

To analyze WSL of orthodontic origin, all images of tooth surfaces with hand-outlined WS were assessed a second time. All WS located in the incisal fourth of the crown were considered unlikely to be caused by orthodontic treatment; they were excluded from evaluation. WS reflecting the position of the brace ( Fig 1 ) or the position of the gingival margin (arch, banana, or kidney shaped) were considered treatment-related WSL and were included in the analysis. The data on their areas were again transferred to the SPSS software.
The repeatability of the WS and WSL area measurement technique, assessed on 25 slides with a time interval of 3 weeks, was high (ICC = 0.877).
Individuals rather than tooth surfaces were of particular interest in this study, the sum areas of all outlined WS and WSL on the 4 studied tooth surfaces were calculated for each patient at each examination (in square pixels). The sum area was used to compare WS and WSL at the several examinations.
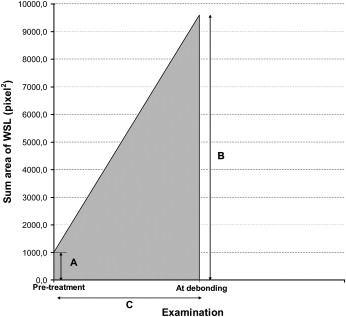
To adjust for possible differences in the between-examination times in different patients, the area under the curve (AUC) was used to compare the effects of GIC vs acrylic bonding materials on WSL ( Fig 2 ). The AUC was calculated as a trapezoidal area under the WSL curve, and comparisons of the AUC of the sum area of WSL between materials were performed for every studied period.

Statistical analysis
The Friedman analysis was used to test for differences in the sum areas of WS and WSL at the various examinations. The Wilcoxon matched-pairs signed rank test was used for pairwise comparison between these examinations. Results of the first 4 examinations were analyzed for 59 participants; all comparisons at the examination 12 years after debonding were performed for 30 patients. Differences in the AUC of sum areas of WSL for GIC vs acrylic bonding materials were tested with the Mann-Whitney U test.
The level of significance was set at 5%, and the Bonferroni adjustment was applied for multiple comparisons. The ICC was used to assess the agreement of hand-outlining of the spots on slides scanned at the 2 resolutions and the repeatability of hand-outlining the spots.
Results
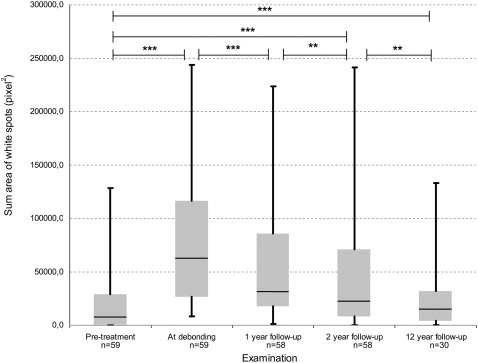
Statistically significant differences in the sum areas of WS between first 4 examinations in 59 patients were identified with the Friedman test ( P <0.001). When compared pairwise with the Wilcoxon matched-pairs signed rank test ( Fig 3 ), a significant increase in the sum area of WS from before treatment to debonding was found ( P <0.001). This was followed by a significant decrease in the sum area of WS after the 1-year follow-up from debonding ( P <0.001) and from the 1-year follow-up to the 2-year follow-up ( P <0.01). In addition, the sum areas of WS before treatment were significantly lower than 2 years after debonding ( P <0.01).


Stay updated, free dental videos. Join our Telegram channel

VIDEdental - Online dental courses


