Introduction
Patients undergoing orthognathic surgery show considerable changes in both hard and soft tissues. The purpose of this study was to use a 3-dimensional (3D) laser scanner to evaluate the soft-tissue changes after the correction of skeletal Class III malocclusions with orthognathic surgery.
Methods
The subjects consisted of 20 Korean patients with skeletal Class III malocclusion who underwent LeFort I osteotomy with maxillary advancement and posterior nasal spine impaction, along with bilateral intraoral vertical ramus osteotomy for mandibular setback. Ten patients (group 1) had 2-jaw surgery with genioplasty, and the other 10 (group 2) had 2-jaw surgery without genioplasty. Three-dimensional images of the patients were acquired with a 3D laser scanner. The ratios of soft-tissue changes to hard-tissue movements were analyzed and compared between the 2 groups. In addition, the changes in the soft-tissue landmarks in the 3D coordinates and the 3D linear, angular, and proportional changes were measured preoperatively and postoperatively, and compared.
Results
There was no significant difference between the groups in the horizontal ratios of the soft-tissue to hard-tissue changes. In both groups, the ratios of the horizontal changes in the paranasal area were higher than in the subnasale area. There were more changes in the subalar area than in the supracommissural area, and more changes in the chin and labiomental areas than in the subcommissural area. Ala moved anterolaterally, and cheilion moved posteroinferiorly. The distance between upper-lip point and cheilion increased significantly ( P <0.05). In the 3D angles, transverse nasal prominence and transverse upper lip prominence increased significantly ( P <0.05).
Conclusions
The 3D analysis in this study can be used to estimate the soft-tissue changes in Class III patients who undergo orthognathic surgery.
The maxilla and the mandible are reoriented during orthognathic surgery. At the same time, the soft tissues are also changed 3 dimensionally. Generally, facial esthetics are improved after surgery, but these changes are judged mainly by the changes in the soft tissues. The facial soft-tissue changes after surgery have mainly been assessed by conventional 2-dimensional (2D) analysis of lateral cephalographs; this has limitations in analyzing the actual soft-tissue movements. Until now, many techniques for 3-dimensional (3D) soft-tissue analysis have been developed, including methods of moiré stripes, stereophotogrammetry, 3D computed tomography, and 3D laser scanning. Among these, 3D laser scanning does not pose a risk from ionizing radiation because it uses a nonhazardous laser, reproduces the color and texture of soft tissues well, and reconstructs 3D images immediately on related software. Therefore, 3D laser scanning is suitable for analysis and evaluation of the soft tissues in patients undergoing orthognathic surgery. The purpose of this study was to examine the soft-tissue changes in Class III orthognathic patients by using 3D laser scanning technology. The study was divided into 2 parts: (1) evaluating the amounts and ratios of the soft-tissue changes according to the hard-tissue movements, and (2) analyzing the changes in the 3D coordinate values of the soft-tissue landmarks and the linear, angular, and proportional changes of the 3D measurements after surgery.
Material and methods
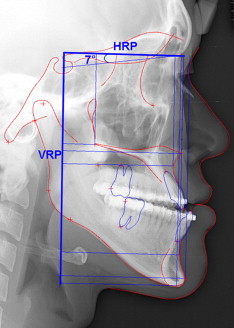
Twenty skeletal Class III patients who underwent LeFort I osteotomy with maxillary advancement, posterior nasal spine impaction, and bilateral intraoral vertical ramus osteotomy with mandibular set back were enrolled in this study. Ten patients (group 1) underwent 2-jaw surgery with genioplasty, and the other 10 (group 2) had 2-jaw surgery without genioplasty. The amount of maxillary advancement and impaction was limited to 1.0 to 3.0 mm in each patient. No patient had severe facial asymmetry, cleft lip and palate, or other craniofacial disorder. All patients in both groups were aged 18 years and over. In the cephalometric skeletal analysis, a plane inclined at 7° relative to the sella-nasion horizontal plane was used as the horizontal reference plane. A line perpendicular to the horizontal plane and crossing through sella was used as the vertical reference plane ( Fig 1 ).
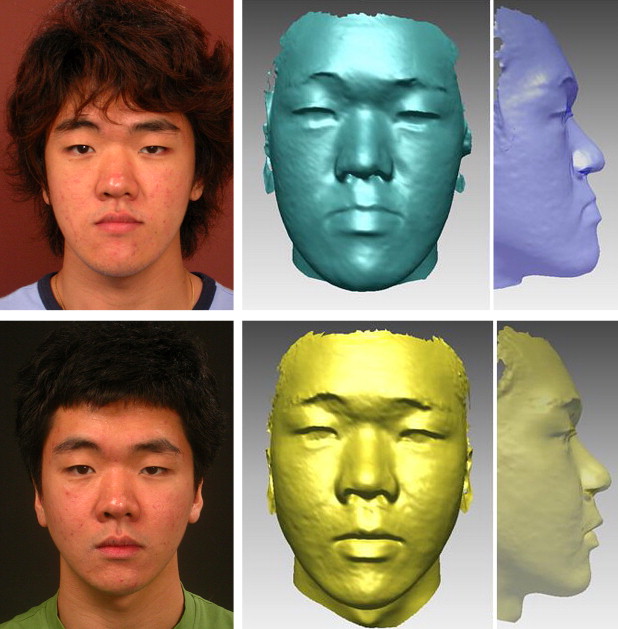
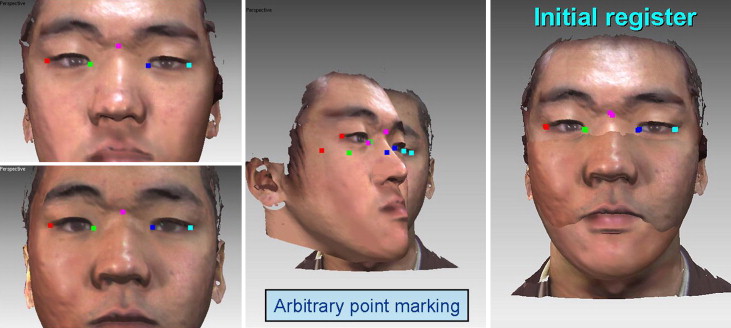
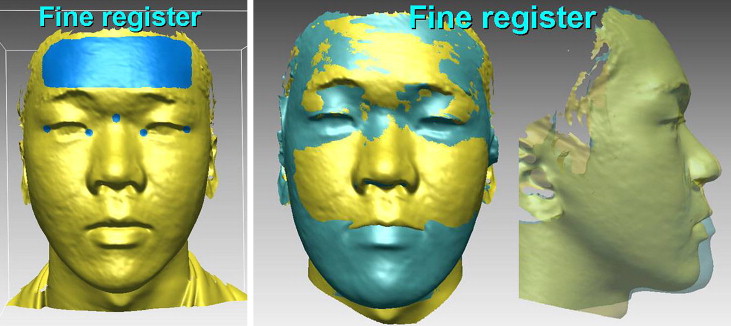
Three-dimensional images of the patients were acquired with a Vivid 900 laser scanner (Minolta, Tokyo, Japan) 1 month before surgery and at least 6 months after surgery. The several points known to be difficult to designate, such as fronto-temporal point, zygomatic point, and soft-tissue gonion, were premarked before scanning for better localization of the points in the 3D program. Technical experts took all scans, and each scanned image was saved on a personal computer and reconstructed into 3D images by using Rapidform (version 2006, Inus Technology, Seoul, Korea), a 3D reverse-engineering software program ( Fig 2 ). For an initial register, 5 arbitrary markers on the right and left exocanthions, right and left endocanthions, and soft-tissue nasion were used as reference points to superimpose the images first ( Fig 3 ). Subsequently, with the 5 reference points and the wide surface on the forehead that would not be influenced by surgery, 1 superimposed 3D image with the same coordinate system was obtained from the preoperative and postoperative images through a fine register ( Fig 4 ).
The color map shows the areas and magnitudes of the soft-tissue changes by color. The face was divided into 10 regions in the color maps according to the horizontal plane parallel to the axial reference planes passing through the dorsum of the nose (1 mm superior to nasal tip), subnasale, upper lip, lower lip, chin, and the vertical plane parallel to the sagittal reference planes passing through right and left exocanthions,and right and left endocanthion as follows: (1) Pn, (2) Sn, (3) subalar, (4) Ls, (5) Li, (6) labiomental fold (B′), (7) Pog′ (8) paranasal, (9) supracommissural, and (10) subcommissural (see Fig 5 for definitions). The soft-tissue changes in the medial part of the face, such as N, Sn, Ls, Li, labiomental fold, chin area, could be measured by the changes in the corresponding landmarks, such as Pn, Sn, Ls, Li, B′, Pog′. The changes in the lateral part of the face, such as paranasal, supracommissural, subcommissural, and subalar areas, were measured from the changes in each facial region by the perpendicular distance between the preoperative and postoperative image surfaces.
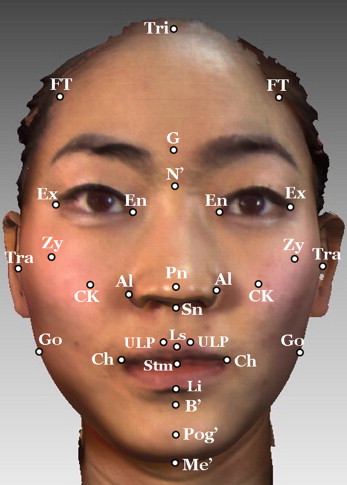
The 31 soft-tissue landmarks were assigned on the 3D facial images by 1 investigator using the Rapidform software ( Fig 5 ). They were represented by a coordinate system (x, y, and z). The landmark points and measurements were selected according to those of Baik et al. The changes in the 31 coordinate values and in the 69 linear, 8 angular, and 13 proportional measurements were calculated, and the data were transferred directly to Excel (Microsoft, Redmond, Wash).
Statistical analysis
The images from 3 subjects (1 man, 2 women) were selected randomly, and 1 investigator remeasured several landmarks such as G, Me′, Al(Rt), Tra(Lt), Zy(Rt), Go′(Lt), and Ch(Rt), 3 times in 2 sessions, 2 weeks apart. A paired t test between the 2 sessions was carried out by using SAS software (version 8.2, SAS, Cary, NC); there was no significant intraexaminer error between the 2 sessions ( P >0.05).
The measurements of the soft-tissue changes according to the 2D cephalographs were evaluated as the controls and compared with the results from the 3D analysis. Although the soft-tissue changes were indicated by 3D values, the hard-tissue changes were determined by the cephalometric values. Therefore, we determined whether it was suitable to combine the results from the 2 methods. The horizontal and vertical changes in the coincident soft-tissue landmarks in the midsagittal plane of the face that could be measured in both the 2D and 3D methods were compared by using an independent t test. There were no significant differences in the soft-tissue changes between the 2 methods ( P >0.05).
An independent t test was used to compare the soft-tissue and hard-tissue changes in groups 1 and 2. The correlations between the soft-tissue and hard-tissue movements in the horizontal and vertical planes were examined by Pearson correlation analysis. The horizontal ratios of the soft-tissue to hard-tissue changes in the groups were also compared. A paired t test was performed to analyze the changes of 3D coordinate values and measurements between presurgery and postsurgery.
Results
Table I shows the hard-tissue and soft-tissue changes in the horizontal plane in groups 1 and 2. The amounts of Pog and Me movement in group 1 were relatively smaller than those in group 2 because of the genioplasty advancement. In the vertical changes, Ls and Li moved downward, even though almost all soft-tissue and hard-tissue landmarks moved upward ( Table II ). There were more changes in the subalar area than in the supracommissural area, and more changes in the chin and labiomental areas than in the subcommissural area. There was no significant difference between the groups when comparing the horizontal percentage ratios of soft-tissue with hard-tissue movement ( Table III ). In the vertical changes, there was no correlation between the soft and hard tissues in most categories except for Pn-A point, Ls-U1 (maxillary incisor), and Me′-Me in group 1, and Ls-L1 (mandibular incisor), Li-L1, and B′-B in group 2. The 3D coordinate values of the landmarks (x, y, and z) were acquired by using the coordinate system, with soft-tissue nasion used as the zero point (0, 0, and 0). The x-coordinate value of Al, y-coordinate values of Ch, Stm, and Go′, and z-coordinate values of Al, Stm, Li, B′, Pog′, and Go′ showed significant changes between presurgery and postsurgery ( Table IV ). There was a significant increase in the 3D linear measurements of Al(Rt)-Al(Lt), Tra-Al, and Ch-ULP in both groups ( Table V ). In the 3D angles, there was a significant increase in the transverse nasal prominence and transverse upper lip prominence ( Table VI ). The 3D ratio of the interendocanthion distance-nasal width and the lower face height upper third (Sn-Stm)-lower face height lower two thirds (Stm-Me’) decreased significantly in the groups ( Table VII ).
| Group 1 | Group 2 | ||||
|---|---|---|---|---|---|
| Variable (mm) | Mean | SD | Mean | SD | Significance |
| Hard tissues, 2D cephalograph | |||||
| PNS | 1.06 | 1.11 | 1.05 | 2.00 | |
| ANS | 0.96 | 2.04 | 0.94 | 1.38 | |
| A | 2.61 | 0.88 | 2.01 | 0.91 | |
| U1 | 0.58 | 1.86 | 0.74 | 3.42 | |
| L1 | −6.92 | 5.03 | −8.31 | 5.44 | |
| B | −10.16 | 6.59 | −9.96 | 7.05 | |
| Pog | −4.76 | 7.36 | −10.57 | 7.42 | ∗ |
| Me | −5.29 | 7.51 | −10.61 | 8.27 | ∗ |
| Soft tissues, 3D laser scan | |||||
| Pn | 0.80 | 0.93 | 0.60 | 0.77 | |
| Sn | 1.40 | 1.15 | 1.15 | 1.27 | |
| Ls | 0.88 | 1.77 | 0.67 | 2.59 | |
| Li | −6.39 | 5.20 | −5.95 | 5.43 | |
| B′ | −8.28 | 5.94 | −8.47 | 6.02 | |
| Pog′ | −4.79 | 5.26 | −9.45 | 6.60 | ∗ |
| Me′ | −4.09 | 7.03 | −10.40 | 7.26 | ∗ |
| Paranasal | 1.76 | 0.72 | 1.48 | 0.63 | |
| Subalar | 1.78 | 0.89 | 1.19 | 1.78 | |
| Supracommissural | 1.16 | 1.10 | 0.77 | 1.57 | |
| Subcommissural | −5.87 | 3.04 | −6.62 | 3.79 | |
∗ Statistically significant difference between groups ( P <0.05).
| Group 1 | Group 2 | ||||
|---|---|---|---|---|---|
| Variable (mm) | Mean | SD | Mean | SD | Significance |
| Hard tissues, 2D cephalograph | |||||
| PNS | 3.71 | 2.59 | 2.48 | 2.39 | |
| ANS | 1.10 | 2.02 | 0.40 | 1.16 | |
| A | 0.58 | 2.30 | 0.02 | 1.32 | |
| U1 | 0.27 | 2.22 | 0.34 | 1.89 | |
| L1 | 1.52 | 4.50 | 3.80 | 2.82 | |
| B | 1.46 | 4.55 | 2.64 | 3.72 | |
| Pog | 4.64 | 6.91 | 2.83 | 1.91 | |
| Me | 3.68 | 4.88 | 2.99 | 2.11 | |
| Soft tissues, 3D laser scan | |||||
| Pn | 0.24 | 1.36 | 0.20 | 1.91 | |
| Sn | 0.53 | 1.28 | 0.07 | 1.61 | |
| Ls | −1.16 | 1.38 | −0.92 | 1.84 | |
| Li | −1.37 | 3.06 | −1.27 | 1.79 | |
| B′ | 1.48 | 3.79 | 0.44 | 2.00 | |
| Pog′ | 2.26 | 5.66 | 0.98 | 4.73 | |
| Me′ | 4.75 | 3.81 | 1.56 | 3.24 | ∗ |
∗ Statistically significant difference between groups ( P <0.05).
| Present study | ||||||
|---|---|---|---|---|---|---|
| Group 1 | Group 2 | Comparison of groups 1 and 2 | Soncul and Bamber 10 | |||
| Facial region | Movement (%) | Significance § | Movement (%) | Significance § | Significance ¶ | Movement (%) |
| Pn | 31 | NS | 30 | NS | NS | 29 |
| Sn | 54 | ∗ | 57 | ∗ | NS | 88 |
| Subalar | 68 | ∗ | 59 | ∗ | NS | 79 |
| Ls | 34 | ∗ | 33 | ∗ | NS | 66 |
| Li | 63 | ‡ | 60 | ‡ | NS | 64 |
| B′ | 81 | ‡ | 85 | ‡ | NS | 90 |
| Pog′ | 101 | † | 89 | † | NS | 97 |
| Paranasal | 67 | NS | 74 | ∗ | NS | 79 |
| Supracommissural | 44 | NS | 38 | † | NS | 45 |
| Subcommissural | 70 | ∗ | 66 | ‡ | NS | 46 |
| X | Y | Z | ||||||||||||||||
|---|---|---|---|---|---|---|---|---|---|---|---|---|---|---|---|---|---|---|
| Group 1 | Group 2 | Group 1 | Group 2 | Group 1 | Group 2 | |||||||||||||
| Variable (mm) | Mean | SD | Sig | Mean | SD | Sig | Mean | SD | Sig | Mean | SD | Sig | Mean | SD | Sig | Mean | SD | Sig |
| Tri | 0.01 | 2.34 | −0.09 | 1.93 | −1.06 | 5.12 | 1.83 | 4.30 | 0.76 | 4.04 | −0.27 | 4.46 | ||||||
| G | 0.05 | 0.83 | 0.09 | 1.34 | −0.56 | 2.26 | −0.29 | 1.88 | 0.00 | 0.20 | 0.09 | 0.25 | ||||||
| N′ | −0.24 | 0.64 | 0.31 | 0.86 | −0.32 | 1.15 | −0.44 | 1.29 | 0.17 | 0.47 | 0.01 | 0.34 | ||||||
| Ex(Rt) | −0.10 | 1.72 | 0.03 | 1.01 | 0.41 | 1.59 | −0.24 | 1.64 | −0.46 | 1.36 | 0.14 | 1.12 | ||||||
| Ex(Lt) | 0.03 | 2.13 | −0.25 | 1.53 | −0.74 | 0.85 | −0.22 | 1.19 | −0.30 | 1.19 | −0.65 | 1.41 | ||||||
| En(Rt) | −0.17 | 1.18 | 0.26 | 0.83 | −0.12 | 1.44 | −1.08 | 2.08 | 0.04 | 0.58 | −0.20 | 0.87 | ||||||
| En(Lt) | −0.04 | 1.03 | 0.41 | 1.13 | −0.39 | 1.42 | −0.97 | 1.56 | 0.20 | 0.64 | −0.27 | 0.70 | ||||||
| Al(Rt) | −1.44 | 2.22 | ∗ | −1.05 | 1.15 | ∗ | 0.09 | 2.10 | 0.46 | 1.49 | 2.54 | 1.71 | † | 2.18 | 1.39 | ‡ | ||
| Al(Lt) | 1.32 | 1.21 | † | 1.54 | 1.70 | ∗ | 0.10 | 1.77 | −0.56 | 1.43 | 2.40 | 1.52 | ‡ | 2.02 | 0.98 | ‡ | ||
| Pn | −0.30 | 1.41 | 0.15 | 1.03 | 0.24 | 1.36 | 0.20 | 1.89 | 0.80 | 1.10 | ∗ | 0.60 | 1.07 | ∗ | ||||
| Sn | 0.08 | 1.47 | 0.21 | 1.10 | 0.53 | 1.28 | 0.07 | 1.59 | 1.40 | 1.59 | ∗ | 1.15 | 1.52 | |||||
| ULP(Rt) | 0.35 | 2.55 | 0.22 | 1.82 | −0.60 | 1.27 | −0.77 | 1.05 | 1.84 | 1.77 | ∗ | 0.67 | 3.20 | |||||
| ULP(Lt) | −0.12 | 2.34 | −0.13 | 1.54 | −0.80 | 1.62 | −0.56 | 0.99 | 1.72 | 1.67 | ∗ | 0.56 | 2.87 | |||||
| Ls | −0.22 | 1.95 | 0.14 | 1.38 | −1.16 | 1.38 | ∗ | −0.92 | 1.85 | 0.88 | 1.41 | ∗ | 0.67 | 3.27 | ||||
| Ch(Rt) | −0.03 | 3.00 | 0.29 | 2.87 | −1.53 | 1.90 | ∗ | −1.58 | 1.59 | ∗ | −1.74 | 2.35 | ∗ | −2.60 | 3.95 | |||
| Ch(Lt) | 0.46 | 3.67 | −0.34 | 1.80 | −1.39 | 2.80 | ∗ | −1.54 | 1.26 | † | −2.24 | 2.26 | ∗ | −2.59 | 3.78 | |||
| Stm | −0.35 | 2.11 | 0.32 | 1.38 | −2.39 | 2.79 | ∗ | −2.41 | 1.50 | ‡ | −2.87 | 2.82 | ∗ | −3.35 | 3.59 | ∗ | ||
| Li | −0.22 | 2.70 | 0.17 | 1.56 | −1.37 | 3.06 | −1.27 | 1.87 | ∗ | −5.06 | 3.21 | ‡ | −5.50 | 5.92 | ∗ | |||
| B′ | −0.24 | 3.34 | 0.22 | 1.75 | 1.48 | 3.79 | 0.44 | 2.03 | −8.28 | 4.06 | ‡ | −8.47 | 6.14 | † | ||||
| Pog′ | −1.46 | 5.24 | 0.82 | 2.15 | 2.26 | 5.66 | 0.98 | 4.73 | −4.79 | 4.49 | ∗ | −9.45 | 6.33 | † | ||||
| Me′ | −0.02 | 3.62 | 0.48 | 2.37 | 4.75 | 3.81 | † | 1.56 | 3.23 | −4.09 | 5.13 | −10.40 | 6.65 | † | ||||
| FT(Rt) | 1.40 | 2.76 | 1.78 | 5.02 | −0.15 | 4.29 | −0.04 | 3.68 | 1.19 | 4.29 | 3.25 | 5.29 | ||||||
| FT(Lt) | 1.80 | 6.67 | −0.17 | 2.82 | −0.03 | 3.83 | 0.08 | 4.28 | −1.44 | 7.36 | −0.39 | 3.26 | ||||||
| Tra(Rt) | 0.45 | 3.12 | −0.23 | 1.28 | 0.50 | 2.10 | 0.00 | 1.88 | −0.71 | 3.09 | −0.28 | 1.73 | ||||||
| Tra(Lt) | −0.61 | 3.20 | 0.13 | 0.60 | 0.69 | 1.57 | 0.21 | 1.98 | −0.43 | 4.90 | −0.31 | 1.65 | ||||||
| CK(Rt) | −1.37 | 3.33 | −1.99 | 2.80 | −0.33 | 1.82 | 0.15 | 1.48 | 0.85 | 1.59 | 0.93 | 2.12 | ||||||
| CK(Lt) | 2.29 | 2.31 | 2.18 | 2.96 | −0.07 | 2.60 | 0.49 | 2.63 | 0.42 | 1.47 | 0.42 | 2.04 | ||||||
| Zy(Rt) | 0.04 | 3.32 | −0.06 | 2.26 | 0.21 | 2.03 | −0.93 | 2.72 | −0.17 | 3.55 | 0.36 | 2.66 | ||||||
| Zy(Lt) | −0.24 | 2.11 | −0.01 | 2.18 | 0.10 | 1.57 | −0.60 | 2.63 | −0.21 | 2.06 | −0.03 | 2.09 | ||||||
| Go′(Rt) | −2.26 | 3.89 | −1.04 | 1.53 | 7.47 | 5.12 | ‡ | 4.02 | 5.01 | ∗ | −1.88 | 6.50 | ∗ | −2.52 | 6.54 | ∗ | ||
| Go′(Lt) | 1.44 | 3.18 | 1.84 | 3.02 | 6.48 | 4.17 | ‡ | 4.46 | 7.02 | ∗ | −2.30 | 2.68 | † | −2.14 | 5.77 | ∗ | ||
∗ Statistically significant difference between preoperative and postoperative states ( P <0.05).
† Statistically significant difference between preoperative and postoperative states ( P <0.01).
‡ Statistically significant difference between preoperative and postoperative states ( P <0.001).
| Group 1 | Group 2 | ||||||||||||||
|---|---|---|---|---|---|---|---|---|---|---|---|---|---|---|---|
| Preop (T1) | Postop (T2) | △T(T2-T1) | Preop (T1) | Postop (T2) | △T(T2–T1) | ||||||||||
| Variables (mm) | Mean | SD | Mean | SD | Mean | SD | Sig | Mean | SD | Mean | SD | Mean | SD | Sig | |
| Total anterior face height | Tri-Me′ | 201.78 | 9.42 | 144.28 | 5.32 | −6.23 | 4.84 | † | 203.00 | 7.83 | 201.54 | 7.29 | −1.46 | 5.35 | |
| Anterior face height | N′-Me′ | 126.10 | 8.01 | 121.27 | 5.89 | −4.83 | 4.48 | † | 123.63 | 6.82 | 120.16 | 7.64 | −1.47 | 5.92 | |
| Anterior face height (vertical) | N′-Me′-v | 125.76 | 7.94 | 121.39 | 5.79 | −4.37 | 4.28 | † | 122.93 | 6.73 | 120.99 | 5.70 | −1.97 | 4.13 | ∗ |
| Forehead height | Tri-N′ | 77.88 | 6.27 | 77.08 | 6.86 | −0.79 | 5.54 | 81.86 | 8.13 | 81.25 | 8.78 | −0.61 | 5.24 | ||
| Forehead height (vertical) | Tri-N′-v | 75.33 | 6.86 | 74.41 | 6.61 | −0.92 | 4.99 | 78.30 | 8.94 | 78.01 | 7.28 | −0.29 | 4.63 | ||
| Upper face height | N′-Sn | 53.50 | 5.37 | 52.96 | 4.88 | −0.54 | 1.71 | 49.67 | 1.88 | 49.72 | 2.57 | 0.05 | 1.45 | ||
| Upper face height (vertical) | N′-Sn-v | 52.67 | 5.13 | 51.98 | 4.89 | −0.69 | 1.74 | 49.16 | 1.92 | 49.33 | 2.54 | 0.16 | 1.66 | ||
| Lower face height | Sn-Me′ | 74.74 | 6.14 | 70.49 | 5.17 | −4.26 | 4.61 | ∗ | 74.86 | 6.51 | 73.72 | 9.22 | −1.14 | 7.47 | |
| Lower face height (vertical) | Sn-Me′-v | 73.09 | 6.30 | 68.41 | 4.44 | −4.68 | 3.85 | † | 73.77 | 6.49 | 70.13 | 5.38 | −3.63 | 4.48 | ∗ |
| LFH lower 1/3 | Sn-Stm | 21.33 | 2.48 | 23.81 | 3.75 | 2.48 | 2.59 | ∗ | 22.18 | 2.55 | 23.80 | 1.60 | 1.62 | 2.09 | ∗ |
| LFH lower 2/3 | Stm-Me′ | 55.07 | 7.00 | 47.37 | 4.69 | −7.70 | 6.82 | † | 54.49 | 4.80 | 51.62 | 10.19 | −2.88 | 9.60 | |
| Right Mn ramus height | Tra(Rt)-Go′(Rt) | 53.22 | 6.78 | 45.64 | 7.93 | −7.58 | 7.79 | ∗ | 54.27 | 5.19 | 49.88 | 3.96 | −4.39 | 5.85 | ∗ |
| Left Mn ramus height | Tra(Lt)-Go′(Lt) | 51.78 | 5.31 | 45.74 | 7.96 | −6.05 | 6.27 | ∗ | 54.13 | 6.21 | 48.83 | 3.13 | −5.30 | 6.31 | ∗ |
| Mn ramus height | Tra-Go′(mean) | 52.50 | 5.45 | 45.69 | 7.39 | −6.81 | 5.98 | † | 54.20 | 5.21 | 48.36 | 3.06 | −5.85 | 6.09 | ∗ |
| Right Mn body length | Go′(Rt)-Me′ | 99.34 | 14.36 | 102.45 | 10.25 | 3.11 | 9.61 | 97.11 | 5.41 | 95.92 | 6.09 | −1.19 | 6.92 | ||
| Left Mn body length | Go′(Lt)-Me′ | 98.81 | 10.88 | 101.98 | 8.55 | 3.17 | 6.90 | 96.34 | 6.26 | 96.15 | 6.17 | −0.19 | 7.75 | ||
| Mn body length | Go′ Me′ (mean) | 99.08 | 12.28 | 102.21 | 8.84 | 3.14 | 7.77 | 96.72 | 5.55 | 95.49 | 5.92 | −1.23 | 7.12 | ||
| Upper face width | Ex(Rt)-Ex(Lt) | 102.31 | 6.82 | 102.47 | 6.50 | 0.15 | 3.44 | 101.83 | 3.46 | 101.81 | 3.75 | −0.02 | 1.84 | ||
| Middle face width | Tra(Rt)-Tra(Lt) | 150.00 | 11.84 | 148.91 | 9.03 | −1.09 | 6.12 | 148.73 | 4.78 | 149.25 | 4.53 | 0.51 | 1.34 | ||
| Lower face width | Go′(Rt)-Go′(Lt) | 119.89 | 11.95 | 124.02 | 8.88 | 4.14 | 5.55 | ∗ | 117.47 | 4.84 | 120.77 | 5.86 | 3.30 | 3.14 | † |
| Nasal width | Al(Rt)-Al(Lt) | 38.68 | 3.48 | 41.42 | 3.47 | 2.74 | 2.05 | † | 38.15 | 3.10 | 40.76 | 2.60 | 2.61 | 1.98 | † |
| Mouth width | Ch(Rt)-Ch(Lt) | 49.15 | 3.12 | 49.55 | 3.50 | 0.40 | 3.33 | 48.53 | 3.67 | 48.24 | 4.23 | −0.29 | 2.90 | ||
| Philtrum width | ULP(Rt)-ULP(Lt) | 14.23 | 2.08 | 13.85 | 1.64 | −0.38 | 2.38 | 13.31 | 1.41 | 13.38 | 1.51 | 0.08 | 1.28 | ||
| Zygoma width | Zy(Rt)-Zy(Lt) | 116.96 | 7.62 | 116.68 | 8.27 | −0.28 | 4.77 | 118.02 | 5.39 | 119.37 | 3.75 | 1.34 | 3.71 | ||
| Mentolabial sulcus | Li-Pog′-B′ | 2.69 | 1.20 | 5.33 | 1.19 | 2.64 | 1.56 | ‡ | 2.80 | 1.02 | 4.60 | 1.01 | 1.80 | 0.51 | ‡ |
| Upper lip protrusion | Pn-Pog′-Ls | 4.66 | 2.26 | 2.89 | 1.48 | −1.77 | 2.13 | ∗ | 5.93 | 2.32 | 2.67 | 1.50 | −3.26 | 1.84 | ‡ |
| Lower lip protrusion | Pn-Pog′-Li | 4.02 | 2.81 | 2.41 | 1.77 | −1.61 | 2.63 | 2.10 | 2.27 | 2.24 | 2.53 | 0.14 | 1.32 | ||
| Tri-G | 60.64 | 6.06 | 59.95 | 6.91 | −0.70 | 6.29 | 63.90 | 7.92 | 63.74 | 7.64 | −0.16 | 7.64 | |||
| G-N | 19.24 | 2.50 | 18.96 | 1.92 | −0.27 | 2.29 | 20.39 | 2.52 | 20.57 | 1.98 | 0.18 | 1.89 | |||
| N′-Pn | 47.31 | 4.55 | 47.16 | 4.25 | −0.14 | 1.69 | 44.65 | 2.00 | 44.52 | 2.34 | −0.13 | 2.29 | |||
| Pn-Sn | 16.00 | 1.99 | 15.96 | 1.41 | −0.04 | 1.84 | 16.63 | 1.67 | 16.62 | 1.82 | −0.01 | 1.25 | |||
| Li-B′ | 11.29 | 4.08 | 10.36 | 2.70 | −0.94 | 2.37 | 9.92 | 2.44 | 10.06 | 1.51 | 0.14 | 1.74 | |||
| B′-Pog′ | 17.68 | 5.44 | 15.21 | 2.39 | −2.47 | 5.08 | 17.93 | 4.09 | 16.07 | 2.56 | −1.86 | 4.37 | |||
| Pog′-Me′ | 18.65 | 6.01 | 16.32 | 5.61 | −2.33 | 4.70 | 19.23 | 3.92 | 19.89 | 12.56 | 0.66 | 10.87 | |||
| Tri-FT(Rt) | 61.68 | 2.76 | 60.02 | 4.55 | −1.66 | 4.34 | 61.86 | 5.62 | 62.78 | 4.80 | 0.91 | 3.66 | |||
| Tri-FT(Lt) | 58.68 | 3.39 | 60.59 | 6.32 | 1.92 | 7.28 | 61.84 | 5.41 | 64.11 | 5.24 | 2.27 | 4.17 | |||
| Tri-Ex(Rt) | 94.71 | 5.19 | 93.68 | 6.76 | −1.03 | 4.39 | 95.21 | 5.54 | 96.57 | 5.14 | 1.36 | 3.15 | |||
| Tri-Ex(Lt) | 94.31 | 5.16 | 94.08 | 7.51 | −0.23 | 4.30 | 96.10 | 6.39 | 97.26 | 5.38 | 1.16 | 3.82 | |||
| Tri-Tra(Rt) | 149.90 | 6.09 | 148.50 | 7.02 | −1.40 | 2.85 | 147.78 | 5.49 | 148.38 | 4.41 | 0.59 | 1.35 | |||
| Tri-Tra(Lt) | 148.34 | 6.79 | 148.17 | 7.93 | −0.17 | 2.26 | 147.69 | 6.21 | 148.28 | 5.38 | 0.59 | 1.52 | |||
| FT(Rt)-N′ | 78.10 | 4.38 | 76.74 | 4.74 | −1.37 | 4.34 | 78.27 | 7.27 | 77.55 | 7.26 | −0.72 | 5.04 | |||
| FT(Lt)-N′ | 73.45 | 4.54 | 74.68 | 6.71 | 1.23 | 7.51 | 77.67 | 6.68 | 77.90 | 6.30 | 0.24 | 4.09 | |||
| FT(Rt)-Tra(Rt) | 102.96 | 5.62 | 102.94 | 6.24 | −0.02 | 3.13 | 101.70 | 4.27 | 101.71 | 4.44 | 0.01 | 3.96 | |||
| FT(Lt)-Tra(Lt) | 104.51 | 8.65 | 102.77 | 6.37 | −1.74 | 6.22 | 101.69 | 3.65 | 100.27 | 3.02 | −1.42 | 3.29 | |||
| N′-Al(Rt) | 49.73 | 3.50 | 49.87 | 4.10 | 0.14 | 1.34 | 48.09 | 2.81 | 48.47 | 2.44 | 0.37 | 1.90 | |||
| N′-Al(Lt) | 48.79 | 4.26 | 48.99 | 4.24 | 0.21 | 2.16 | 46.99 | 1.89 | 48.01 | 2.10 | 1.02 | 1.52 | |||
| N′-Go′(Rt) | 123.27 | 7.33 | 119.99 | 6.67 | −2.28 | 2.86 | † | 119.14 | 4.55 | 118.55 | 3.96 | −0.59 | 2.64 | ||
| N′-Go′(Lt) | 121.87 | 8.52 | 120.41 | 8.25 | −1.46 | 1.67 | ∗ | 119.10 | 4.49 | 117.53 | 3.78 | −1.57 | 3.20 | ||
| N′-Go′ (mean) | 122.57 | 7.74 | 120.70 | 7.43 | −1.87 | 1.61 | † | 119.12 | 4.26 | 118.04 | 3.56 | −1.08 | 2.62 | ||
| Ex(Rt)-Al(Rt) | 54.68 | 2.93 | 55.01 | 3.52 | 0.33 | 2.46 | 54.81 | 2.24 | 54.28 | 1.73 | −0.53 | 1.51 | |||
| Ex(Lt)-Al(Lt) | 53.61 | 2.87 | 53.09 | 3.14 | −0.52 | 1.61 | 53.07 | 2.24 | 53.03 | 2.04 | −0.04 | 1.63 | |||
| Ex(Rt)-Ch(Rt) | 77.55 | 5.85 | 78.00 | 5.27 | 0.45 | 1.98 | 77.75 | 2.89 | 78.06 | 2.54 | 0.30 | 1.78 | |||
| Ex(Lt)-Ch(Lt) | 77.68 | 3.75 | 77.94 | 4.70 | 0.26 | 2.57 | 77.16 | 3.39 | 77.98 | 2.65 | 0.82 | 1.75 | |||
| Tra(Rt)-Al(Rt) | 103.41 | 6.81 | 105.29 | 7.13 | 1.88 | 0.86 | ‡ | 100.23 | 3.83 | 101.80 | 3.97 | 1.57 | 2.09 | ∗ | |
| Tra(Lt)-Al(Lt) | 102.10 | 7.72 | 104.26 | 8.30 | 2.16 | 2.79 | † | 99.64 | 3.88 | 101.16 | 4.31 | 1.53 | 1.48 | † | |
| Tra(Rt)-Ch(Rt) | 110.46 | 10.05 | 110.63 | 9.60 | 0.17 | 1.87 | 108.77 | 4.29 | 107.61 | 4.65 | −1.16 | 3.31 | |||
| Tra(Lt)-Ch(Lt) | 109.58 | 8.91 | 110.04 | 11.38 | 0.46 | 4.23 | 108.53 | 5.33 | 108.03 | 5.31 | −0.51 | 3.35 | |||
| Al(Rt)-Ch(Rt) | 30.02 | 2.56 | 30.99 | 2.42 | 0.97 | 2.21 | 29.55 | 1.99 | 30.44 | 1.57 | 0.89 | 1.74 | |||
| Al(Lt)-Ch(Lt) | 30.41 | 2.16 | 31.80 | 2.90 | 1.39 | 1.59 | 30.37 | 2.08 | 30.68 | 1.59 | 0.30 | 1.12 | |||
| Al(Rt)-Pn | 30.77 | 3.40 | 30.32 | 3.29 | −0.45 | 0.95 | 30.39 | 2.57 | 30.07 | 2.16 | −0.32 | 1.55 | |||
| Al(Lt)-Pn | 29.34 | 2.51 | 29.19 | 2.46 | −0.15 | 0.87 | 29.04 | 2.28 | 29.22 | 2.15 | 0.18 | 0.94 | |||
| Al(Rt)-Sn | 23.78 | 3.02 | 24.18 | 2.43 | 0.40 | 1.78 | 22.15 | 1.96 | 22.76 | 1.78 | 0.61 | 1.66 | |||
| Al(Lt)-Sn | 23.14 | 2.18 | 23.34 | 2.38 | 0.20 | 1.38 | 21.72 | 1.59 | 22.25 | 1.40 | 0.53 | 0.82 | |||
| Ch(Rt)-ULP(Rt) | 21.56 | 1.72 | 23.66 | 1.82 | 2.10 | 1.71 | † | 21.50 | 2.10 | 23.25 | 2.23 | 1.75 | 1.51 | † | |
| Ch(Lt)-ULP(Lt) | 20.69 | 2.51 | 22.92 | 2.80 | 2.24 | 2.23 | ∗ | 20.63 | 2.24 | 22.09 | 2.63 | 1.47 | 1.57 | ∗ | |
| Ch(Rt)-Li | 31.39 | 2.35 | 29.81 | 2.39 | −1.59 | 2.01 | ∗ | 30.43 | 2.63 | 29.51 | 2.36 | −0.92 | 2.16 | ||
| Ch(Lt)-Li | 29.76 | 2.08 | 28.81 | 2.54 | −0.95 | 2.22 | 28.82 | 2.73 | 27.12 | 2.15 | −1.70 | 1.30 | † | ||
| Ch(Rt)-Go′(Rt) | 79.82 | 12.49 | 80.92 | 9.85 | 1.10 | 6.74 | 76.20 | 5.96 | 76.22 | 4.90 | 0.01 | 4.23 | |||
| Ch(Lt)-Go′(Lt) | 80.04 | 10.51 | 81.50 | 9.78 | 1.46 | 4.36 | 76.96 | 6.94 | 78.61 | 5.29 | 1.66 | 4.70 | |||
Stay updated, free dental videos. Join our Telegram channel
VIDEdental - Online dental courses


