Introduction
This study was conducted to measure the dimensional changes in the cranial base and the mandible in patients with facial asymmetry and mandibular prognathism, and to examine the morphologic relationship between asymmetries of the cranial base and the mandible.
Methods
The patients were 60 adults with mandibular prognathism, divided into a symmetry group (menton deviation, <2 mm; n = 30) and an asymmetry group (menton deviation, >4 mm; n = 30) according to the degree of menton deviation. Three-dimensional computed tomography scans were obtained with a spiral scanner. Landmarks were designated on the reconstructed 3-dimensional surface models. Linear, angular, and volumetric measurements of the cranial base and mandibular variables were made.
Results
In the asymmetry group, the hemi-base, anterior cranial base, and middle cranial base volumes were significantly larger ( P <0.01), and crista galli to sphenoid, sphenoid to petrous ridge, anterior clinoid process to petrous ridge, and vomer to petrous ridge lengths were significantly longer ( P <0.05) on the nondeviated side than on the deviated side. Menton deviation was significantly correlated with the difference in hemi-base volume, and ramal volume was significantly correlated with the difference in hemi-base and middle cranial base volumes between the nondeviated and deviated sides ( P <0.05).
Conclusions
In patients with facial asymmetry and mandibular prognathism, cranial base volume increased on the nondeviated side and was also correlated with mandibular asymmetry.
Facial asymmetry is a complex problem that manifests in inconsistent size, form, and arrangement of the facial features on either side of the median sagittal plane. Hereditary and environmental factors during the fetal, infant, or adolescent periods are known to contribute to the expression of craniofacial asymmetry. Various etiologic factors have been proposed concerning facial asymmetry, including unilateral condylar hyperactivity, functional disharmony of the masticatory muscles, hemisphere dominance of the brain, plagiocephaly caused by head posture during early infancy, and unilateral craniosynostosis.
Severt and Proffit reported that in a group with facial asymmetry, asymmetry of the upper face was seen in only 5% of the patients, whereas 36% showed middle third asymmetry and 75% had deviation of the chin. Cheon and Suhr and Haraguchi et al also reported that asymmetry was found most obviously in the lower part of the face in the posteroanterior cephalometric radiographs. For these reasons, most studies regarding facial asymmetry have analyzed mandibular asymmetry using 3-dimensional computed tomography, but there are few studies regarding cranial base asymmetry.
Facial asymmetry is often accompanied by varying degrees of cranial base asymmetry as well as mandibular asymmetry, but cranial base asymmetry is also observed in patients with no notable facial asymmetry. Additionally, Hayashi reported that the morphology of the cranial base has an effect on the positions of the maxilla and the mandible, and that temporomandibular joint position and mandibular shape can also be altered in those with plagiocephaly and an asymmetric cranial vault and cranial base. However, most previous studies regarding cranial base asymmetry analyzed plagiocephaly in subjects at early ages, and the effect of cranial base asymmetry on mandibular asymmetry is still uncertain in adults with facial asymmetries. The purposes of this study were to measure the dimensions of the cranial base and the mandible using 3-dimensional computed tomography images of skeletal Class III adults with mandibular prognathism and to examine the morphologic relationship between asymmetries of the cranial base and the mandible.
Material and methods
Clinical and 2-dimensional radiographic examinations were carried out on patients who visited Yonsei University Dental Hospital, Seoul, Korea, between 2005 and 2012. The patients included 60 adults with skeletal Class III malocclusion with mandibular prognathism (ANB, <0° Pog to nasion perpendicular, >5.0 mm), no systemic disease, and no degenerative disease of the temporomandibular joint. Since the chin can greatly influence the perception of facial asymmetry, facial asymmetry was defined as menton deviation (MD) from the midsagittal reference line. The midsagittal reference line was defined as the line passing through the crista galli and anterior nasal spine, as recommended by Grummons and Kappeyne van de Coppello. The symmetry group included 30 adults (15 men, 15 women) with an MD from the midsagittal line less than 2 mm; the asymmetry group included 30 adults (15 men, 15 women) with an MD from the midsagittal line of more than 4 mm (Haraguchi et al ). The patients’ characteristics in the 2 groups are shown in Table I .
| Variable | Mean | SD | Minimum | Maximum |
|---|---|---|---|---|
| Symmetry group | ||||
| Age (y) | 20.8 | 3.4 | 18.0 | 29.0 |
| ANB (°) | −3.6 | 2.5 | −9.9 | −0.5 |
| Pog to nasion perpendicular (mm) | 11.7 | 6.7 | 5.1 | 31.4 |
| MD (mm) | 1.0 | 0.7 | 0.2 | 2.0 |
| Asymmetry group | ||||
| Age (y) | 20.9 | 2.6 | 18.0 | 29.0 |
| ANB (°) | −2.6 | 2.4 | −8.4 | −0.1 |
| Pog to nasion perpendicular (mm) | 9.7 | 4.5 | 5.1 | 21.7 |
| MD (mm) | 8.5 | 3.4 | 4.1 | 16.8 |
The 3-dimensional computed tomography scans were obtained before orthognathic surgery using a spiral scanner (SOMATOM Sensation 64; Siemens, Erlangen, Germany) with the following settings: gantry angle of 0°, 512 × 512 matrix, 120 kV, 150 mA, 1.0 mm thickness, and rotation time of 0.5 second. The patients were positioned with the Frankfort horizontal plane perpendicular to the floor and the facial midline coinciding with the long axis of the computed tomography machine. The digital imaging and communication in medicine (DICOM) images were created in 1.0-mm slice thicknesses after scanning. The DICOM data were reconstructed into 3-dimensional images (176 HU threshold value) using the InVivoDental software program (version 5.1; Anatomage, San Jose, Calif).
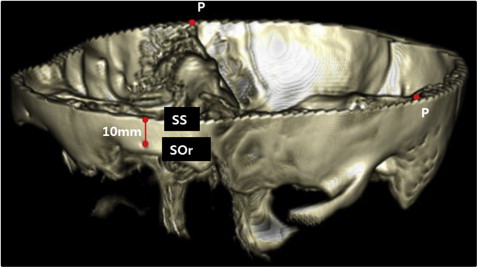
According to the method of You et al, the mandible was separated from the reconstructed image, and the teeth above the alveolar bone were removed. Then, as outlined by Enlow, the frontal, ethmoid, sphenoid, temporal, and occipital bones were all included in the cranial base, which was separated from the reconstructed image by removing the facial bones (maxilla, palatine bone, mandible, nasal bone, vomer, lacrimal bone, inferior nasal concha, and zygomatic bone) and cervical bones. The nasal bone was separated from the frontal bone at the frontonasal suture, and the zygomatic bone was separated at the frontozygomatic suture. The maxilla was separated from the sphenoid bone at the pterygomaxillary fissure, and the zygomatic bone was separated at the sphenozygomatic suture. In the case of the ethmoid bone, only the cribriform plate and the perpendicular plate were included while the ethmoid labyrinth was removed. After removal of the facial and cervical bones, the calvaria and the cranial base were separated into a plane connecting the superior point os supraorbitale and both petrous ridge points ( Fig 1 , Table II ).
| Landmark | Description |
|---|---|
| Cranial base | |
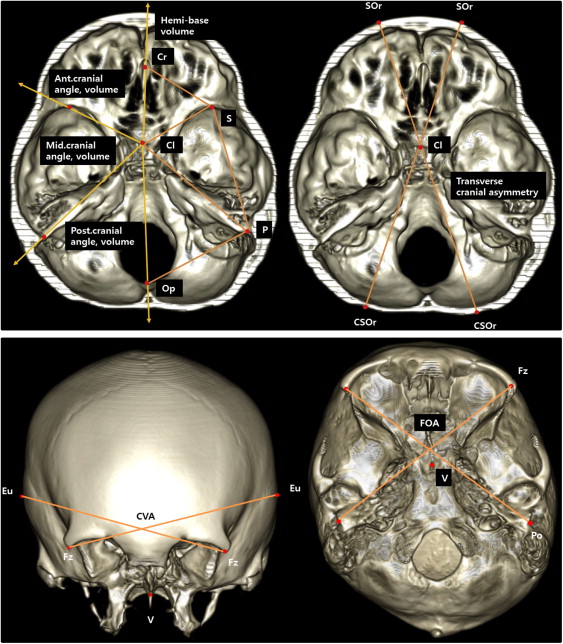
| Cr (crista galli) | The most superior edge of the crista galli |
| Cl (anterior clinoid process) | Midpoint between the anterior clinoid processes |
| P (petrous ridge) | Junction of the superior ridge of the petrous pyramid of the temporal bone and the inner surface of the parietal bone |
| S (sphenoid) | The most anterior point of the posterior edge of the lesser wing of the sphenoid |
| Op (opisthion) | Midpoint of the posterior arch of foramen magnum |
| V (vomer) | The most posterior point of the junction of the sphenoid bone and vomer |
| SOr (supraorbitale) | The most superior point of the supraorbital foramen |
| SS (superior point of supraorbitale) | The point 10 mm superior to the left supraorbitale |
| Fz (frontozygomatic suture) | The most anterior point of the frontozygomatic suture |
| Po (porion) | The most superior point of the external auditory meatus |
| Eu (euryon) | The most lateral point on either side of the greatest transverse diameter of the head |
| CSOr (contralateral point of SOr) | The point where the extension line of SOr-Cl meets the contralateral occipital area |
| Mandible | |
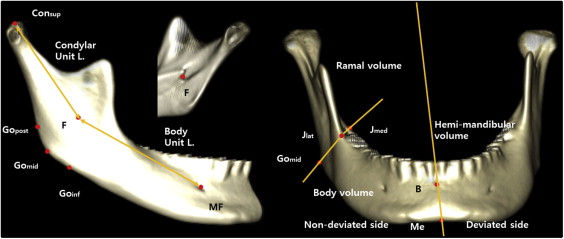
| Con sup (condylion superius) | The most superior point of the condylar head |
| F (fossa of mandibular foramen) | The most inferior point of the fossa of the mandibular foramen |
| J lat | The most lateral and deepest point of the curvature formed at the junction of the mandibular ramus and body |
| J med | The most medial and deepest point of the curvature formed at the junction of the mandibular ramus and body |
| Go post (gonion posterius) | The most posterior point of the mandibular angle |
| Go mid (gonion midpoint) | The midpoint between Go post and Go inf on the mandibular angle |
| Go inf (gonion inferius) | The most inferior point of the mandibular angle |
| MF (mental foramen) | The entrance of the mental foramen |
| Me (menton) | The most inferior midpoint of the symphysis |
| Pog (pogonion) | The most anterior midpoint of the symphysis |
| B (supramentale) | The midpoint of the greatest concavity of the anterior border of the symphysis |
| G (genial tubercle) | The midpoint of the genial tubercle |
Landmarks were designated on the reconstructed 3-dimensional surface model, and their positions were verified on the axial, coronal, and sagittal slices. Landmarks of the cranial base were selected by referring to the studies of Captier et al, Kwon et al, Mulliken et al, Moss, and Lee et al, and mandibular landmarks were selected according to the study of You et al. Landmarks and measurements are given in Tables II and III , and Figs 1–3 . The data were measured in increments of 0.01 mm for linear, 0.01° for angular, and 1 mm 3 for volumetric measurements.
| Measurement | Description |
|---|---|
| Cranial base | |
| Volume | |
| Hemi-base volume | The cranial base volume was divided into 2 hemi-base volumes by the plane connecting Cr-Cl-Op |
| Anterior cranial, middle cranial, and posterior cranial volumes | The hemi-base volume was divided into anterior, middle, and posterior cranial by the planes connecting Cl-S-V and Cl-P-V |
| Angle | |
| Anterior cranial angle | The angle formed by the intersection of Cr-Cl and Cl-S (∠Cr-Cl-S) |
| Middle cranial angle | The angle formed by the intersection of S-Cl and Cl-P (∠S-Cl-P) |
| Postcranial angle | The angle formed by the intersection of P-Cl and Cl-Op (∠P-Cl-Op) |
| Petrous ridge angle | The angle formed by the intersection of Cr-Cl and Cl-P (∠Cr-Cl-P) |
| Length | |
| Cr-S length | Distance between Cr and S |
| S-P length | Distance between S and P |
| P-Op length | Distance between P and Op |
| Cl-S length | Distance between Cl and S |
| Cl-P length | Distance between Cl and P |
| V-S length | Distance between V and S |
| V-P length | Distance between V and P |
| Transverse cranial asymmetry | SOr (non)-CSOr (dev) length – SOr (dev)-CSOr (non) length |
| CVA (cranial vault asymmetry) | Fz (non)-Eu( dev) length – Fz (dev)-Eu (non) length |
| FOA (fronto-orbital asymmetry) | Fz (non)-Po (dev) length – Fz (dev)-Po (non) length |
| Mandible | |
| Volume | |
| Hemi-mandibular volume | The mandibular volume was divided into 2 hemi-mandibular volumes by the plane connecting Me-B-G |
| Ramal volume and body volume | The hemi-mandibular volume was divided into ramal and body volumes by the plane connecting Go mid -J lat -J med |
| Length | |
| Condylar unit length | Distance between Con sup and F |
| Body unit length | Distance between F and MF |
Statistical analysis
To account for intraobserver and interobserver errors, the procedure—removing the facial bones and cervical bones and taking measurements—was repeated twice. The initial assessment and the reassessment were done 2 weeks apart by 3 observers (graduate students). The 2 assessments by each observer were analyzed with the intraclass correlation for intraobserver reliability, and the first and second assessments of the 3 observers were compared for interobserver reliability. The paired t test was conducted on measurements performed twice with a 2-week interval to examine their reproducibility. The method errors were calculated using Dahlberg’s formula (Se = √(d 2 /2n) ( d , difference between measurements; n , number of measurement pairs). Because the 2-sample t test showed that the MD and differences in the measurements between the male and female subjects were not significantly different, no differentiation was made for sex. The 2-sample t test was used to compare the measurements between the symmetry and asymmetry groups, and the paired t test was also used to compare the measurements between the nondeviated and the deviated sides. The Pearson correlation analysis was used to determine correlations between MD and the measurements. Statistical evaluations were performed at the 5% level of significance with SPSS for Windows software (version 18.0; SPSS, Chicago, Ill).
Results
Intraclass correlation coefficients were .908 to .964 for intraobserver reliability and 0.902 to 0.919 for interobserver reliability, indicating high reliability of these measurements. The paired t test showed no statistically significant difference between the measurements made 2 weeks later. Among the measurements of the cranial base, the method errors were 0.56 to 1.68 mm for linear measurements, 0.85° to 1.95° for angular measurements, and 123.57 and 385.25 mm 3 for volumetric measurements. Among the mandibular measurements, the method errors were 0.45 to 1.03 mm for linear measurements and 56.70 to 130.58 mm 3 for volumetric measurements.
The asymmetry group showed significantly greater differences in hemi-base volume ( P <0.01), anterior cranial base volume ( P <0.05), and middle cranial base volume ( P <0.05) between the nondeviated and deviated sides compared with the symmetry group. There was no statistically significant difference in other measurements of the cranial base ( Table IV ).
| Measurement | Symmetry group | Asymmetry group | P value | ||
|---|---|---|---|---|---|
| Mean | SD | Mean | SD | ||
| Volume difference (×10 3 mm 3 ) | |||||
| Hemi-base volume | 0.22 | 2.66 | 2.50 | 2.50 | 0.001 † |
| Anterior cranial base volume | 0.23 | 1.30 | 0.98 | 1.41 | 0.036 ∗ |
| Middle cranial base volume | −0.08 | 2.93 | 1.55 | 2.48 | 0.024 ∗ |
| Posterior cranial base volume | 0.07 | 2.81 | −0.03 | 2.44 | 0.884 |
| Angle difference (°) | |||||
| Anterior cranial angle | −0.13 | 3.01 | 1.00 | 3.30 | 0.170 |
| Middle cranial angle | 0.18 | 3.22 | −0.37 | 3.58 | 0.534 |
| Posterior cranial angle | −0.01 | 2.17 | −0.32 | 2.23 | 0.596 |
| Petrous ridge angle | −0.02 | 2.74 | 0.62 | 3.08 | 0.400 |
| Length difference (mm) | |||||
| Cr-S length | −0.17 | 2.08 | 0.92 | 2.24 | 0.055 |
| S-P length | 0.57 | 3.24 | 1.17 | 2.70 | 0.441 |
| P-Op length | 0.29 | 2.44 | 0.31 | 2.89 | 0.983 |
| Cl-S length | −0.12 | 1.94 | 0.65 | 3.19 | 0.265 |
| Cl-P length | 0.53 | 3.61 | 1.56 | 3.19 | 0.248 |
| V-S length | −0.79 | 1.22 | −0.09 | 2.16 | 0.130 |
| V-P length | 0.73 | 3.85 | 1.61 | 3.19 | 0.343 |
| Transverse cranial asymmetry | −0.90 | 3.66 | −0.31 | 3.98 | 0.552 |
| CVA | −1.33 | 5.47 | −2.33 | 5.98 | 0.500 |
| FOA | −0.80 | 2.59 | −0.68 | 3.70 | 0.880 |
In the asymmetry group, the hemi-base, anterior cranial base, and middle cranial base volume measurements were significantly greater on the nondeviated side than on the deviated side ( P <0.01). The Cr-S, S-P, Cl-P, and V-P lengths were significantly longer on the nondeviated side than on the deviated side ( P <0.05). There was no statistically significant difference in angular measurements of the cranial base ( Table V ).
| Measurement | Nondeviated side | Deviated side | Difference | Correlation with MD ( P value) | ||||
|---|---|---|---|---|---|---|---|---|
| Mean | SD | Mean | SD | Mean | SD | P value | ||
| Volume (×10 3 mm 3 ) | ||||||||
| Hemi-base volume | 79.64 | 12.76 | 77.14 | 12.78 | 2.50 | 2.50 | <0.001 † | 0.393 ∗ (0.031) |
| Anterior cranial base volume | 16.96 | 3.44 | 15.98 | 3.34 | 0.98 | 1.41 | 0.001 † | 0.246 (0.190) |
| Middle cranial base volume | 33.05 | 6.52 | 31.50 | 6.20 | 1.55 | 2.48 | 0.002 † | −0.069 (0.718) |
| Posterior cranial base volume | 29.63 | 5.30 | 29.66 | 5.45 | −0.03 | 2.44 | 0.945 | 0.331 (0.074) |
| Angle (°) | ||||||||
| Anterior cranial angle | 61.58 | 4.38 | 60.58 | 3.55 | 1.00 | 3.30 | 0.108 | 0.042 (0.827) |
| Middle cranial angle | 69.94 | 4.31 | 70.31 | 4.01 | −0.37 | 3.58 | 0.573 | −0.293 (0.116) |
| Posterior cranial angle | 52.23 | 3.49 | 52.55 | 2.89 | −0.32 | 2.23 | 0.442 | 0.234 (0.213) |
| Petrous ridge angle | 131.03 | 3.80 | 130.41 | 2.93 | 0.62 | 3.08 | 0.280 | −0.283 (0.130) |
| Length (mm) | ||||||||
| Cr-S length | 45.60 | 2.63 | 44.67 | 2.15 | 0.92 | 2.24 | 0.032 ∗ | 0.175 (0.356) |
| S-P length | 74.92 | 4.73 | 73.75 | 5.37 | 1.17 | 2.70 | 0.024 ∗ | −0.107 (0.573) |
| P-Op length | 67.39 | 3.61 | 67.08 | 3.83 | 0.31 | 2.89 | 0.563 | 0.254 (0.175) |
| Cl-S length | 43.75 | 4.05 | 43.10 | 2.90 | 0.65 | 3.19 | 0.271 | 0.206 (0.275) |
| Cl-P length | 77.53 | 3.83 | 75.96 | 4.56 | 1.56 | 3.19 | 0.012 ∗ | 0.108 (0.570) |
| V-S length | 57.62 | 3.92 | 56.92 | 3.64 | −0.09 | 2.16 | 0.071 | 0.139 (0.463) |
| V-P length | 83.29 | 3.53 | 81.69 | 4.79 | 1.61 | 3.19 | 0.010 ∗ | 0.023 (0.903) |
| Transverse cranial asymmetry | 161.07 | 9.69 | 161.38 | 8.90 | −0.31 | 3.98 | 0.671 | −0.171 (0.365) |
| CVA | 147.64 | 7.68 | 149.97 | 6.49 | −2.33 | 5.98 | 0.041 ∗ | −0.048 (0.802) |
| FOA | 128.69 | 6.86 | 129.37 | 7.16 | −0.68 | 3.70 | 0.324 | −0.171 (0.048) |
The asymmetry group showed significantly greater differences in condylar unit length ( P <0.01), body unit length ( P <0.01), hemi-mandibular volume ( P <0.05), and ramal volume ( P <0.01), but there was no statistically significant difference in body volume ( Table VI ). In the asymmetry group, hemi-mandibular volume and ramal volume were greater on the nondeviated side ( P <0.01), and condylar unit length and body unit length were longer on the nondeviated side ( P <0.01). MD was significantly correlated with the differences in condylar unit length ( P <0.01), body unit length ( P <0.01), hemi-mandibular volume ( P <0.05), and ramal volume ( P <0.01; Table VII ).


