Introduction
The purpose of this study was to use cone-beam computed tomography to compare mandibular dimensions in subjects with asymmetric skeletal Class III malocclusion and those with normal occlusion.
Methods
Cone-beam computed tomography scans of 38 subjects with normal occlusion and 28 patients with facial asymmetry were evaluated and digitized with Invivo software (Anatomage, San Jose, Calif). Three midsagittal and 13 right and left measurements were taken. The paired t test was used to compare the right and left sides in each group. The Mann-Whitney U test was used to compare the midsagittal variables and the differences between the 2 sides of the group with normal occlusion with those of asymmetry patients.
Results
The posterior part of the mandibular body showed significant differences between the deviated and nondeviated sides in asymmetric Class III patients. The difference of the asymmetry group was significantly greater than that of the normal occlusion group for the mediolateral ramal and the anteroposterior condylar inclinations ( P = 0.007 and P = 0.019, respectively).
Conclusions
The asymmetric skeletal Class III group showed significant differences in condylar height, ramus height, and posterior part of the mandibular body compared with the subjects with normal occlusion. These results might be useful for diagnosis and treatment planning of asymmetric Class III patients.
Lack of harmony between the constituents of the craniofacial complex is considered to be asymmetry. With the increasing interest in facial appearance, asymmetry poses a great concern to those who want to improve their facial esthetics.
In the evaluation of facial asymmetry, various diagnostic indexes are available for assessing severity and identifying those in need of treatment. Posteroanterior cephalograms have been widely used to quantify the amount of deviation. However, the reliability of postero-anterior cephalometric measurements is limited because of superimposition of important structures and diffi-culties in landmark identification. Subsequently, various attempts have been made to overcome the limits in 2-dimensional (2D) analysis.
Three-dimensional (3D) computed tomography imaging has been proposed to resolve such problems, since it can be effective for diagnosis and treatment planning of patients with maxillofacial deformities. Recently, Gateno et al examined the impact of facial asymmetry on the accuracy of both 2D and 3D cephalometric measurements. They concluded that 3D measurements also can be distorted by changes in shape, size, position, and orientation.
Hwang et al found that the difference in ramal inclination masked the difference in ramus length in the posteroanterior cephalograms and reported that 3D images might be useful in understanding asymmetrical structures. Also, other investigators have used 3D computed tomography scans to compare patients with symmetric and nonsymmetric mandibular prognathism and concluded that both condylar and body units contributed to the asymmetry. However, previous studies on facial morphologic asymmetry have mainly focused on the frontal and lateral planes. Also, no systematic 3D diagnostic method has been available for facial asymmetry, although the accuracy of 3D computed tomography measurements is sufficiently high.
Therefore, the purpose of this study was to compare the dimensions of mandibular morphology between asymmetric skeletal Class III patients and subjects with normal occlusion by using cone-beam computed tomography (CBCT).
Material and methods
The asymmetry group consisted of 28 Class III adults (14 men, 14 women; mean age, 24.85 years) with facial asymmetry who visited the orthodontic department in Seoul Saint Mary’s hospital in Korea. The inclusion criteria were Angle Class III molar and canine relationships with ANB angles less than –2° and apparent facial asymmetry with chin deviation of at least 3 mm from the facial midline perpendicular to the interpupillary line at soft-tissue nasion when the patient was seated upright with the Frankfort horizontal plane parallel to the floor. The exclusion criteria included apparent maxillary asymmetry and previous orthodontic or orthognathic treatment.
The control group included 38 adults (18 men, 20 women; mean age, 22.6 years; SD, 3.2 years) with normal occlusion and esthetically pleasing appearance who volunteered to participate in CBCT evaluations. The inclusion criteria were Angle Class I molar and canine relationships, ANB angle between 0° and 4°, normal overbite and overjet (>0 mm and <4 mm, respectively), minor arch length discrepancy (<3 mm of crowding, <1 mm of spacing), flat or slight curve of Spee (<2 mm), and full permanent dentition with normal tooth size and shape, except for the third molars. The exclusion criteria included deviations in the dental midline, crossbite, history of previous orthodontic or orthognathic treatment, restorations extending to contact areas, cusp tips, incisal edges, and missing teeth. CBCT scans were taken with the Alphard VEGA (Asahi Roentgen, Kyoto, Japan). The following settings were used: field of view, 200 × 179 mm; 80 kV; 5.00 mA; exposure time, 17 seconds; voxel size, 0.39 mm; and slice thickness, 1.00 mm. The volume render tab in Invivo (version 5.01; Anatomage, San Jose, Calif) was used to view, digitize, and measure the CBCT scans. First, reorientation of each scan was performed. Nasion was selected as the origin of the x, y, and z coordinates. The horizontal plane was defined through the right and left orbitale and the left porion, and the midsagittal plane was defined by passing through nasion, and the anterior and posterior nasal spines ( Fig ). Then, menton, gonion, condylion, sigmoid notch, and mesiobuccal cusp of the maxillary first molars were digitized. Also, a new reference point was constructed at the most convex point on the curvature of the mandibular body between menton and gonion, midway between the inner and outer borders of the mandibular body on each side ( Fig ). Table I gives the definitions of the cephalometric variables measured in this study. The side toward which the chin was shifted was called the deviated side, and the other side was called the nondeviated side.
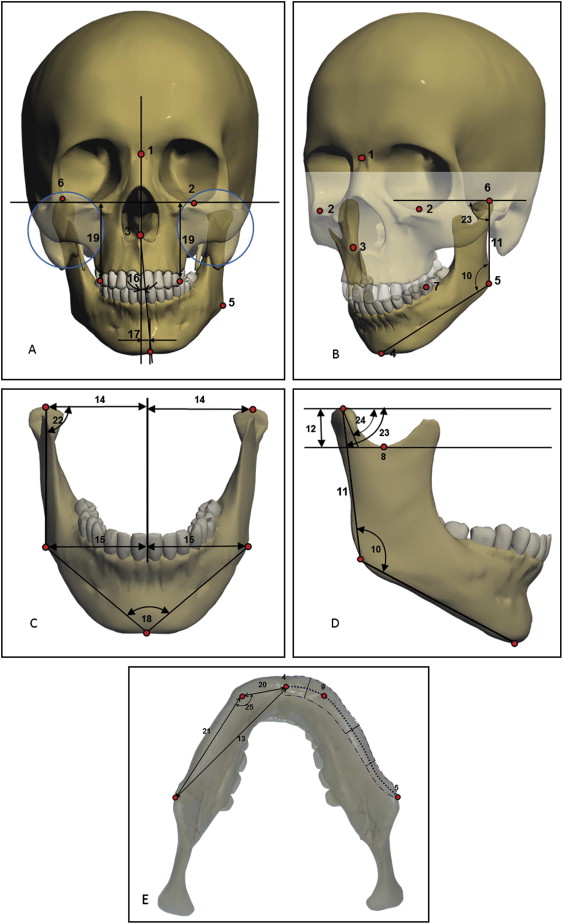
| Variable | Description |
|---|---|
| Gonial angle | Angle between the menton-gonion and condylion-gonion vectors of both sides |
| Ramus height | Distance between condylion and gonion of both sides |
| Condylar height | Vertical distance from condylion to the the mandibular body curve sigmoid plane |
| Mandibular body length | Distance between gonion of both sides and menton |
| Condyle to midsagittal plane | Perpendicular distance from right and left condylion to the midsagittal plane projected on the coronal plane |
| Gonion to midsagittal plane | Perpendicular distance from right and left gonion to the midsagittal plane projected on the coronal plane |
| Menton deviation angle | Angle between the midline and the menton-anterior nasal spine vector |
| Menton to midsagittal plane | Perpendicular distance from menton to the midsagittal plane projected on the coronal plane |
| Menton angle | Angle between the right and left gonion-menton vectors |
| Maxillary height | Perpendicular distance from each side mesiobuccal cusp of the first molar to the Frankfort horizontal plane projected on the coronal plane |
| Anterior part of mandibular body | Distance between menton and the mandibular body curve on each side |
| Posterior part of mandibular body | Distance between the mandibular body curve and gonion on each side |
| Mediolateral ramal inclination | Inner angle between the right and left condylion-gonion and the Frankfort plane projected on the frontal plane |
| Anteroposterior ramal inclination | Inner angle between the right and left condylion-gonion and the Frankfort plane projected on the midsagittal plane |
| Anteroposterior condylar inclination | Angle between the vector passing through the condyle parallel to the condyle neck and the Frankfort plane projected on the midsagittal plane |
| Mandibular body curve angle | Angle between the anterior and posterior mandibular body lines |
All digitizations were performed by 1 investigator (M.B.), who had much experience in 3D technology. To test intraexaminer reliability, 10 randomly selected CBCT scans were digitized 2 weeks later by the same operator. The results of the intraclass correlation coefficient test showed high reliability between the 2 assessments (>0.8).
Statistical analysis
Statistical analysis was performed with software (version 16.0.2.1; SPSS, Chicago, Ill). The right and left sides of the groups were compared by using paired t tests. Because the values of the midsagittal measurements in the normal occlusion group did not have a normal distribution when assessed with the Shapiro-Wilks test, the Mann-Whitney U test was used to compare the normal occlusion and the asymmetrical skeletal Class III groups. For the measurement of the pairs, the differences in each parameter between the right and left sides of the normal occlusion subjects were compared with those of the deviated and nondeviated sides of the asymmetry patients with the Mann-Whitney U test.
Results
Table II shows the differences between the asymmetric skeletal Class III and the normal occlusion groups for the linear variables. The posterior part of mandibular body was significantly larger on the nondeviated side than on the deviated side in the asymmetry group. The difference between the 2 sides of the asymmetry group was significantly greater than that of the normal occlusion group for condylar height, ramus height, and posterior part of the mandibular body ( P <0.001, P <0.001, and P = 0.006, respectively).
| Variable (mm) | Asymmetric skeletal Class III (n = 28) | Normal occlusion (n = 38) | P value † | ||||||||||||
|---|---|---|---|---|---|---|---|---|---|---|---|---|---|---|---|
| Deviated side | Nondeviated side | Absolute difference | P value ∗ | Left | Right | Absolute difference | P value ∗ | ||||||||
| Mean | SD | Mean | SD | Mean | SD | Mean | SD | Mean | SD | Mean | SD | ||||
| Ramus height | 53.23 | 5.52 | 54.77 | 6.80 | 5.11 | 3.42 | 0.20 | 57.69 | 5.9 | 57.6 | 5.82 | 1.40 | 1.43 | 0.78 | <0.001 |
| Mandibular body length | 88.87 | 6.67 | 89.87 | 5.81 | 2.47 | 1.85 | 0.09 | 87.88 | 5.03 | 88.09 | 4.99 | 1.55 | 1.09 | 0.48 | 0.061 |
| Anterior part of mandibular body | 14.35 | 1.96 | 13.99 | 2.49 | 2.05 | 1.71 | 0.49 | 16.84 | 2.93 | 16.74 | 3.4 | 1.75 | 1.14 | 0.78 | 0.744 |
| Posterior part of mandibular body | 79.06 | 7.39 | 80.56 | 6.61 | 3.29 | 2.17 | 0.04 | 75.42 | 4.94 | 75.82 | 5.16 | 1.84 | 1.41 | 0.29 | 0.006 |
| Condylion to midsagittal | 51.64 | 3.02 | 51.46 | 3.69 | 2.90 | 2.06 | 0.79 | 48.22 | 3.8 | 48.54 | 3.43 | 2.20 | 1.61 | 0.56 | 0.164 |
| Gonion to midsagittal | 48.47 | 4.64 | 47.97 | 4.75 | 3.91 | 3.30 | 0.62 | 52.08 | 3.29 | 52.82 | 3.42 | 2.07 | 1.50 | 0.07 | 0.263 |
| Maxillary height | 47.63 | 3.55 | 48.30 | 3.75 | 1.65 | 1.18 | 0.08 | 49.52 | 3.77 | 49.75 | 3.85 | 1.40 | 0.96 | 0.29 | 0.115 ‡ |
| Condylar height | 19.06 | 3.30 | 20.06 | 3.08 | 2.87 | 2.08 | 0.14 | 19.22 | 2.36 | 18.86 | 2.47 | 1.17 | 0.98 | 0.15 | <0.001 |
| Condylar head width | 16.56 | 2.52 | 16.94 | 2.79 | 2.51 | 1.79 | 0.52 | 17.68 | 2.10 | 18.29 | 2.63 | 1.60 | 1.01 | 0.05 | 0.059 |
∗ Paired t tests between the 2 sides in each group.
† Mann-Whitney U test between the absolute differences between the sides of both groups.
‡ Independent t test was used because the variables had normal distributions.
Table III presents the comparisons of the angular variables. In the asymmetric Class III group, there was a significant difference only in the mediolateral ramal inclination, with the deviated side showing a significantly greater value ( P <0.001). In the comparison of the 2 groups, there were significant differences in mediolateral ramal inclination and anteroposterior condylar inclination ( P = 0.007 and P = 0.019, respectively). Both variables showed greater differences between the 2 sides of the asymmetry group compared with the normal occlusion group.


