Introduction
The aims of this study were to calculate the volume of white spot lesions by using microcomputed tomography and to determine which clinical attribute of the white spot lesion could better predict its volume: the clinically visible white spot lesion surface area or its color intensity.
Methods
White spot lesions were induced in 8 patients in vivo on 23 healthy premolars destined for extraction during orthodontic treatment by using specially designed plaque-retaining orthodontic bands. After 7 weeks, the premolars were extracted. After extraction, the resulting white spot lesions were photographed and clinically graded. The teeth were analyzed with microcomputed tomography.
Results
After 7 weeks, 70% of the teeth developed clinical white spot lesions. Clinically, the size of the lesions varied from minor to severe. Their volumes varied from 0 to 1.2931 mm 3 . The traditional grades for white spot lesions correlated significantly with color intensity. A significant correlation was found between white spot lesion color intensity and lesion volume. This correlation was found to be better than that between the white spot lesion clinical score and lesion volume.
Conclusions
Our results indicate that white spot lesion color intensity might predict the depth of enamel demineralization as well as or better than traditional white spot lesion scoring. Therefore, the dentist could use this information when planning treatment for white spot lesions.
Esthetics is often a main reason that patients seek orthodontic treatment. However, treatment with fixed orthodontic appliances increases the probability of developing white spot lesions on the buccal and labial surfaces of the teeth, hence sometimes creating a new esthetic problem for the patient. The reported prevalences of white spot lesions after treatment are 2% to 97%, and the lesions tend to develop despite increased attention to oral hygiene during treatment. This is due to many factors including changes in plaque microbiota, increased plaque retention areas on buccal surfaces, increased difficulty in dental hygiene, and obstacles to natural cleansing mechanisms including saliva flow and buccal and labial musculature.
Since the dentist cannot clinically see the volume (depth of demineralization) of the white spot lesion but only its surface area, it is difficult to correctly inform the concerned patient about the outcome of his or her white spot lesions. The same is true when planning treatment, which can include observation, white spot lesion infiltration, various microabrasion techniques, composite restorations, or veneers or crowns in more serious cases.
The white spot lesion is an enamel subsurface lesion. The outer 10 to 30 μm of enamel is believed to stay relatively intact because of the supersaturation of fluorapatite. In addition, organic macromolecules such as salivary proline-rich proteins and statherin are known to inhibit demineralization. They cannot pass through the pores of the outer enamel and therefore can only protect the outer surface. Assuming no elective treatment is done and oral hygiene is satisfactory after removal of the orthodontic appliance, there are 4 possible outcomes: the superficial white spot lesions might disappear due to remineralization or toothbrush abrasion, some white spot lesions will become chronic, and, in more severe cases, chronic white spot lesions will change color from white to brown-black. In the worst case, the enamel lesion will cavitate and progress to the dentin. This usually happens on the mandibular premolars and molars where plaque retention is common.
Black was the first to study the time it took for dental plaque at areas of plaque stagnation to cause white spot lesions. After just 1 week, even though no clinical signs were present, histologically, one could see signs of increased enamel porosity. After 2 weeks, white spot lesions were clinically visible after careful air drying. Histologically, a subsurface lesion formed, with mineral loss most apparent under the outer enamel layer. After 3 and 4 weeks, air drying was not needed to see the white spot lesions.
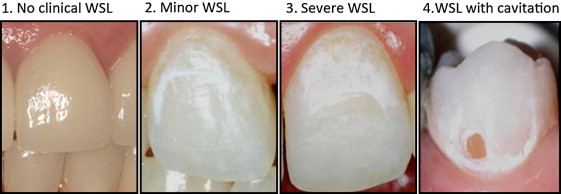
Gorelick et al developed a system for scoring clinically visible white spot lesions ( Fig 1 ). After drying the teeth with air, the lesions were given the following scores: 1, no clinical white spot lesions; 2, minor white spot lesions; 3, severe white spot lesions; and 4, white spot lesions with cavitation. This method is widely used, and the score is related to the area of the lesion.
In addition to the clinical size (area) of the white spot lesion, another easily assessed clinical property of the lesion is color. Some white spot lesions are only slightly whiter than the tooth’s natural color, and air drying is needed to detect them, whereas others are intensely white, easily seen even on a wet tooth. The refractive index of sound enamel is 1.62. White spot lesions become more apparent after air drying because this changes the refractive index from 1.33 to 1.0. This increased difference in the refractive index between enamel and the white spot lesion makes it easier to detect the lesion.
The aim of this study was to determine which clinical attribute of white spot lesions could better predict its volume (volume is related to the depth of enamel penetration): the clinically visible white spot lesion surface area or its color intensity. The difference in color between healthy enamel and the white spot lesion is called white spot lesion color intensity .
Material and methods
Our subjects were 8 patients who had lived their entire lives in Norway (5 boys, 3 girls; 10-14 years old; mean age, 12.25 years; SD, 1.58 years). They had either the first or second premolars scheduled to be extracted for orthodontic reasons ( Table I ). Twenty-three premolars were used in the study, none of which had a clinical white spot lesion at the baseline. The patients were chosen from an orthodontic clinic consecutively. Throughout the entire study, the patients brushed with a nonfluoride toothpaste (Solidox; Lilleborg, Oslo, Norway), and no fluoride or antimicrobials such as chlorhexidine or triclosane compounds were used. The study was approved by the regional ethical committee of Oslo, Norway. The subjects and their guardians signed an informed consent form.
| Patient | Sex | Age at baseline (y) | Teeth contributed (n) | Teeth |
|---|---|---|---|---|
| 1 | M | 13 | 3 | 14, 24, 35 |
| 2 | F | 10 | 2 | 14, 24 |
| 3 | M | 13 | 4 | 14, 24, 34, 44 |
| 4 | F | 10 | 2 | 14, 24 |
| 5 | M | 12 | 2 | 14, 24 |
| 6 | F | 14 | 4 | 14, 24, 34, 44 |
| 7 | M | 12 | 4 | 14, 24, 35, 45 |
| 8 | M | 14 | 2 | 35, 45 |
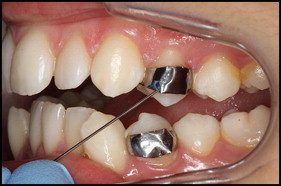
Orthodontic bands with 2 metal posts (0.8 mm thick) welded onto the inner buccal surface specifically designed for plaque accumulation ( Fig 2 ) were banded on the premolars. Temp Bond NE (Kerr, Orange, Calif) was used to cement the bands in place because of its lack of antimicrobial activity. Any residual cement between the buccal tooth surface and the band was removed. Seven weeks after banding, the bands were removed with care so as to not damage the buccal surface. The teeth were thereafter extracted by the examiner (L.T.), and the planned orthodontic treatment was initiated by the orthodontist. After extraction, the crown of the tooth was separated from the root with a diamond saw, and the saw was also used to split the crown into buccal and lingual halves. The buccal half was placed into a labeled, sealed tube containing a drop of water and thymol crystals to maintain moisture and prevent overgrowth of bacteria.
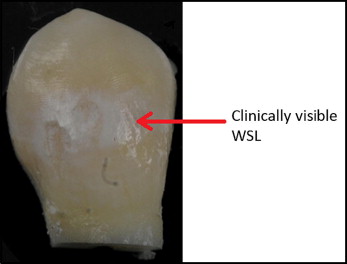
The buccal halves of the teeth were later removed from the tubes, and each tooth was glued to a glass slide ( Fig 3 ). The teeth were air dried and scored by using the system developed by Gorelick et al. All the teeth were scored by the same operator (L.T.). The teeth were then imaged in the same room and under the same controlled lighting conditions with a camera (D3X; Nikon, Melville, NY). The camera settings were shutter speed, 1/125 second; f-stop, f/16; aperture value, f/16; focal length, 200 mm; lens, 200.0 f/4.0; and no flash. The operator then used the selection tool in ImageJ to isolate the region of interest containing the white spot lesion, and the “histogram” function to determine the mean color value of this area of interest. Two regions surrounding the white spot lesion that were considered to represent healthy enamel (natural enamel color) were then isolated. The “histogram” function was used to determine the mean color values of these areas, and then the average was calculated. The color values of the white spot lesions were subtracted from the color values of the healthy enamel color to obtain a value for the color change caused by the white spot lesion. If the white spot lesion covered a large tooth surface area with varying color intensity, the most color intense region of the white spot lesion was chosen as the region of interest. If no white spot lesion was apparent, the color difference equalled zero.
A microcomputed tomography device (μCT40; Scanco Medical, Bruettisellen, Switzerland; lateral resolution, 8 μm; equipped with a microfocus x-ray source [70 kV, 114 mA]; model 1172; SkyScan, Kontich, Belgium; 100 kV, 100 mA, aluminum and copper filter) was used to determine the 3-dimensional structure of the white spot lesions. The images were scanned with a voxel size of 5.9 μm. The volume of the lesion and the relative mineral loss were calculated by using software (CTAn; SkyScan, Aartselaar, Belgium). Because of the similarity between the mineral density of dentin and white spot lesions (and hence their gray-scale values), our region of interest contained only enamel. The volume of the white spot lesions was calculated in this software by first isolating the demineralized enamel with the threshold operation (lower gray threshold, 80; upper gray threshold, 180). Then artefacts (isolated white pixels and a line at the enamel-air interface) were removed by using morphologic operations (type: opening [2-dimensional space]; kernel, square; radius, 2). Finally, the volume was determined by the 3-dimensional analysis operation. In the computed tomography images, the gray-scale value is proportional to the mineral density. The gray-scale values of white spot lesions were calculated by using the same values for threshold and morphologic operations followed by the “histogram (3-dimensional space) inside the volume of interest” operation. The same procedure was then used to calculate the gray-scale values of intact enamel; however, the threshold values were 180 (lower gray threshold; upper gray threshold is 253).
Statistical analysis
The SPSS statistical program (version 11.0.1 for Windows; SPSS, Chicago, Ill) was used to look for possible correlations between white spot lesion volumes, difference in mean color values, and white spot lesion clinical scores. An intraclass correlation coefficient analysis was carried out for the white spot lesion scoring (Cronbach’s alpha = 0.963) and the histogram color difference measurements (Cronbach’s alpha = 0.989) by using the 1-way random model in the SPSS software, comparing repeated measurements with a 1-week interval. A normal Q-Q plot was used to check whether the data were normally distributed. The Spearman correlation coefficient was used to calculate the correlation between the 2 continuous variables, white spot lesion volume and white spot lesion histogram color difference. The correlation coefficient “gamma” was used when comparing the ordinal white spot lesion clinical score with white spot lesion volume and color difference. A power calculation (arctangh transformation; significance level, 0.05; 2-sided) was performed with the statistical program R for each correlation analysis. The program R was also used to run a mixed linear model, and we found no variability between patients and teeth.
Stay updated, free dental videos. Join our Telegram channel
VIDEdental - Online dental courses


