5
Local Anesthetics
Local anesthetics differ from most other drugs in that they are applied very close to the site where they are intended to act. Consequently, they travel across very short distances and their effects are felt in a matter of minutes. Their action consists of reversibly blocking the transmission of peripheral nerve impulses, an essential feature in local anesthesia.
Local anesthetics are weak bases in the form of oily liquids or low melting point solids. They are scantly water soluble and highly soluble in lipids and organic solvents. They are very unstable, readily decomposing when exposed to heat, light, or oxidation. When anesthetics are combined with strong acids such as hydrochloric acid, they form hydrochloride salts: white, crystalline, water‐soluble powders that are very stable and compatible with epinephrine (Bonica 1959). The local anesthetics most commonly used in dentistry are listed in Table 5.1, together with the molecular weights of their bases and salts.
Chemical Structure
The chemical structure of the local anesthetics presently used in dentistry, which is always basically the same, consists of the following three components (Löfgren and Lundquist 1946; Löfgren 1948; de Jong 1977) (Figure 5.1):
- Aromatic ring. This is the lipid‐soluble portion of the molecule that governs local anesthetic penetration into cell membranes. It may also help block nerve impulse transmission (Ritchie and Ritchie 1968). While the ring is normally a benzene, it may also be a thiophene, as in articaine.
- Intermediate aliphatic chain. This is what determines the type of biotransformation and metabolic breakdown of the anesthetic. There are two types (Figure 5.2):
- Ester or amino‐ester chains are rapidly broken down via plasma cholinesterase (also known as plasma pseudocholinesterase, plasma esterase, or butyrylcholinesterase)‐mediated hydrolysis.
- Amide or amino‐amide bonds are broken down more slowly in the liver, first via N‐dealkylation of their tertiary amino terminus and subsequently by other mechanisms.
- Amino terminus. This is the hydrophilic component and active principle in anesthetics. It exists in two forms (Figure 5.1):
- The cationic, ionized (positive electric charge: BH+), quaternary amine (the amino terminus has four bonds) or acid form is water‐soluble and binds to the transmembrane protein receptor. It blocks the sodium channels and subsequently prevents depolarization of the neuron and the eventual transmission of the nerve impulse (Ritchie et al. 1965a, b; Wildsmith 1986; Butterworth and Strichartz 1990), intensifying the effect of the aromatic ring (Ritchie and Ritchie 1968).
- The free, nonionized or uncharged and consequently electrically neutral (free neutral base: B) or tertiary amine (the amino terminus has three bonds) is lipid soluble and drives diffusion of the local anesthesia across the cell membranes and even to the protein receptor (Ritchie et al. 1965a, b). This form also blocks the transmission of nerve impulses, although less effectively than the cationic form (Ritchie and Ritchie 1968; Wildsmith 1986; Butterworth and Strichartz 1990).
Physical‐chemical Characteristics of Local Anesthetics
As local anesthetics act on a transmembrane receptor located in the sodium channel within the cell membrane, their effectiveness depends on the four main physical‐chemical properties that govern their anesthetic activity.
Table 5.1 Molecular weight (in International Units) of local anesthetics: bases and salts (hydrochlorides).
| Local anesthetic | Base | Salt | |
|---|---|---|---|
| Esters | Benzocaine | 165.2 | — |
| Procaine | 236.3 | 272.8 | |
| Tetracaine | 264.4 | 300.8 | |
| Cocaine | 303.4 | 339.8 | |
| Amides | Prilocaine | 220.3 | 256.8 |
| Lidocaine | 234.3 | 270.8 | |
| Mepivacaine | 246.2 | 282.8 | |
| Ropivacaine | 274.4 | 310.8 | |
| Etidocaine | 276.0 | 312.9 | |
| Articaine | 284.4 | 320.9 | |
| Bupivacaine | 288.0 | 324.9 | |
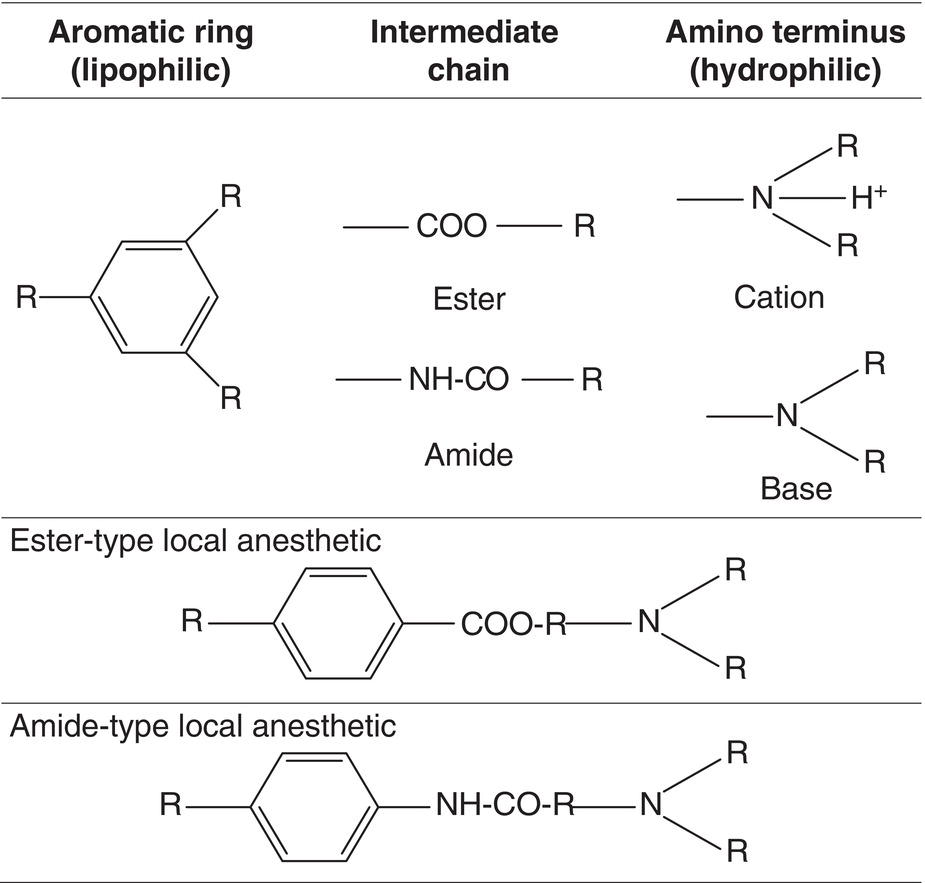
Figure 5.1 Three components of the chemical structure of local anesthetics and basic or cationic amino terminus.
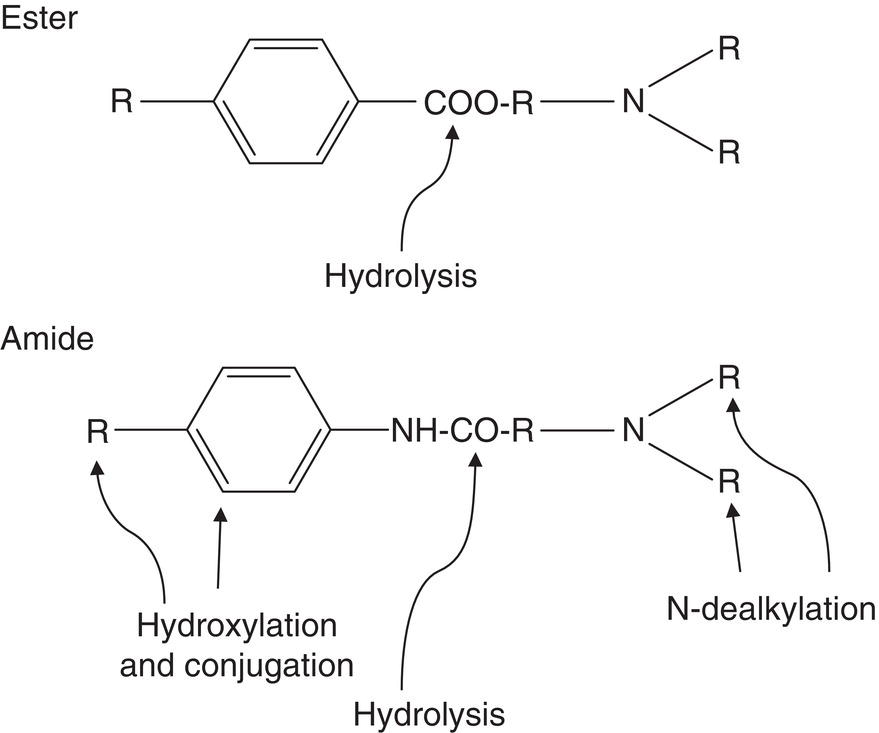
Figure 5.2 Standard metabolism of ester‐ and amide‐type local anesthetics, catabolic action.
Source: Redrawn from Jastak et al. (1995).
Table 5.2 pKa, proportions of cationic (BH+), and free base (B) forms at physiological pH (7.4) and 25 °C, and relative onset for 10 local anesthetics.
| pKa | BH+/B ratio | %BH+ | %B | Anesthetic | Onset |
|---|---|---|---|---|---|
| 7.6 | 1.6/1 | 61 | 39 | — | Early |
| 7.7 | 2/1 | 65 | 35 | Mepivacaine Etidocaine |
|
| 7.8 | 2.5/1 | 71 | 29 | Articaine | |
| 7.9 | 3.2/1 | 76 | 24 | Lidocaine Prilocaine |
|
| 8.0 | 4/1 | 80 | 20 | — | Intermediate |
| 8.1 | 4.8/1 | 83 | 17 | Bupivacaine Ropivacaine |
|
| 8.5 | 6.3/1 | 92 | 8 | Tetracaine | Late |
| 8.8 | 25/1 | 96 | 4 | Cocaine | |
| 9.0 | 40/1 | 97 | 3 | Procaine |
pKa values as in Annex 6.
Dissociation Constant or pKa
The dissociation constant or pKa, also known as the ionization constant, is related to the amino terminus. As noted above the N‐terminus has two forms, cationic (BH+) and free base (B), that are in equilibrium, although the proportion of one and the other depends on the following two factors (Covino 1972).
- The dissociation constant or pKa specific to each anesthetic is defined as the pH at which 50% of the molecules in the local anesthetic adopt the BH+ form and the other 50% the B form (Table 5.2).
- The pH of the tissues because this modifies the proportion of the dissociated forms in keeping with the Henderson–Hasselbalch equation (Henderson 1908; Hasselbalch 1917):
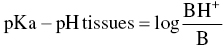
whereby
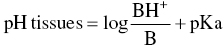
Although the physiological pH is 7.4, the pH in tissues may drop to 6 or lower in the presence of inflammation or pus (Schade et al. 1921; De Jong and Cullen 1963). The proportion of the B form, which diffuses across cell membranes, consequently declines, rendering the anesthetic less effective since a smaller amount reaches the axon interior.
The pKa value effects two properties of local anesthetics: the onset of action and anesthetic potency.
- Onset of local anesthetic action. The lower the pKa, the greater the proportion of free base (B) in the anesthetic in tissues at physiological pH (7.4) and the speedier its diffusion inside the axon after crossing the cell membrane. In the axon interior (axoplasm) it reaches a new B ↔ BH+ equilibrium, enabling the cationic form (BH+) to act on the protein receptor (Ritchie et al. 1965a, b), blocking the sodium channels and with them the nerve impulse. This is the property that pKa affects most significantly.
- Anesthetic potency. The lower the pKa, the higher the potency of the local anesthetic, as more anesthetic penetrates the membrane more quickly, leaving less outside to be captured by the bloodstream (Courtney 1980; Wildsmith et al. 1987). The effect of pKa is minor here, acting merely as a coadjutant. As discussed below, other factors such as lipid solubility have a heavier impact on the potency of local anesthetics.
Partition Coefficient or Lipid Solubility
The partition coefficient or lipid solubility, also known as the diffusion coefficient, a measure of the relative penetration of drugs in biological membranes, is closely related to drug–cell membrane component binding. While the partition coefficient is actually a measure of lipid solubility, in practice the two terms are used indistinctly (Tucker et al. 1970). The two best‐known methods for determining lipid solubility yield very different values, although as the data in Table 5.3 shows, they exhibit a consistent pattern.
Table 5.3 Relationship between lipid solubility (calculated with two methods) and properties of local anesthetics.
| Lipid solubility | Anesthetic property | ||||
|---|---|---|---|---|---|
| Anesthetic | N‐heptane | N‐octanol | Topical anesthesia | Relative potency | Relative toxicity |
| Procaine | 0.02 | 2 | No | 1 | 1 |
| Articaine | 0.7 | 15 | No | 2 | 2 |
| Mepivacaine | 0.8 | 20 | No | 2 | 2 |
| Prilocaine | 0.9 | 25 | No | 1.5 | 1.5 |
| Lidocaine | 2.9 | 45 | Yes | 2 | 2 |
| Benzocaine | 3.1 | 80 | Yes | — | — |
| Ropivacaine | 3.4 | 115 | Yes | — | — |
| Tetracaine | 4.1 | 220 | Yes | 8 | 8 |
| Bupivacaine | 27.5 | 350 | Yes | 8 | 8 |
| Etidocaine | 141.0 | 800 | Yes | 6 | 6 |
Lipid solubility as in Annex 7; relative toxicity as in Annex 8.
Lipid solubility affects a number of properties of local anesthetics, as discussed below.
- Relative anesthetic potency. The higher the lipid solubility, the higher the anesthetic potency. Although it is the single most important factor in anesthetic potency (Courtney 1980; Wildsmith et al. 1987), others act as coadjutants: (i) as noted earlier, pKa impacts potency, which is greater at lower pKa values; (ii) binding to blood plasma proteins also plays a role, for the more strongly the anesthetic binds, the higher is it potency (Truant and Takman 1959; Tucker et al. 1970); and (iii) the larger the size of the drug molecule, the higher the potency (Courtney 1980; Butterworth and Strichartz 1990). The reference for anesthetic potency, procaine, is assigned a value of 1 and all other anesthetics are measured against that standard.
- Relative toxicity. Lipid solubility is closely related to toxicity (Covino 1987; Garfield and Grugino 1987), such that the higher the former the higher the latter (Covino 1972; Gangorosa 1981). Procaine, which is also the reference for toxicity, is assigned a value of 1 and all other anesthetics are measured against that standard.
- Topical anesthetic effectiveness (Gangorosa 1981). Although topical anesthesia depends on both the lipid solubility and anesthetic concentration, a certain level of lipid solubility can be defined that ensures good topical anesthetic action with no need to increase the concentration to intolerably high proportions (Table 5.3).
Protein Binding
The ability of local anesthetics to bind to plasma proteins has been studied primarily for α1‐acid glycoprotein (Routledge et al. 1980; Meunier et al. 2001) and to a lesser extent, albumin (Mather et al. 1971; Meunier et al. 2001). An equilibrium between the fraction of anesthetic bound to proteins and the free portion is reached in a matter of microseconds (Widman 1975), the latter being the pharmacologically active fraction (Tucker et al. 1970; Tucker and Mather 1975).
Anesthetic binding to proteins conditions the duration of their effect: the more strongly they bind, the longer the duration (Covino 1981; Milam and Giovannitti Jr. 1984). That is because the transmembrane receptors for local anesthetics are also proteins (Covino 1981). These considerations are summarized in Table 5.4.
Vasodilation
Nearly all local anesthetics generate vasodilation in two ways: (i) they cause the smooth muscle cells lining the vessels to relax (Aps and Reynolds 1976; Covino and Giddon 1981) and (ii) they block sympathetic type B nerve fibers that control vasoconstriction. However, exceptions exist.
- Cocaine has an indirect vasoconstrictive effect because it blocks mono‐amine‐oxidase (MAO), an enzyme, preventing the recapture of nerve ending norepinephrine, which is a vasoconstrictor (Muscholl 1961; Covino and Giddon 1981).
- Mepivacaine is slightly vasoconstrictive (Du Mesnil de Rochemont and Hensel 1960; Lindorf et al. 1974; Lindorf 1979; Vongsavan et al. 2000), as is ropivacaine (Iida et al. 2001; Timponi et al. 2006), although the effect is less widely acknowledged in the latter (De Oliveira et al. 2014).
Table 5.4 Percentage of local anesthetics bound to proteins and duration of anesthetic effect.
| Anesthetic | Binding to proteins (%) | Duration of anesthetic |
|---|---|---|
| Procaine | 5 | Short |
| Prilocaine | 55 | Medium |
| Articaine | 60 | |
| Lidocaine | 65 | |
| Mepivacaine | 75 | |
| Tetracaine | 85 | Long |
| Ropivacaine | 95 | |
| Etidocaine | 95 | |
| Bupivacaine | 95 |
Data on protein bonds as in Annex 9.
Vasodilation increases blood flow and with it, anesthetic transport, which in turn lowers anesthetic potency and duration (Widman 1975; Aps and Reynolds 1976). One curious effect is that the higher the concentration of the drug, the greater is its vasodilatory effect, partially offsetting the increase in potency afforded by higher concentrations (Aps and Reynolds 1976; Reynolds et al. 1976). The clinical conclusion is that the greater the vasodilatory effect of an anesthetic, the greater the benefit to be administered with a vasoconstrictor, which enhances anesthetic potency and duration, hindering vascular absorption of the local anesthetic and thereby lowering the risk of systemic toxicity. Further to the data listed in Table 5.5, in amide‐type anesthetics, the vasodilatory effect rises with anesthetic potency (Covino and Giddon 1981).
Assessment of Anesthesia and the Anesthetic Parameter
A number of methods have been deployed to assess the efficacy of local anesthetic solutions. The earliest involved in vitro trials with the sciatic nerves from frogs (Truant and Takman 1959; Bianchi and Strobel 1968) or the pneumogastric nerves from rabbits (Wildsmith et al. 1987). In humans, efficacy has been assessed via needle prick after dermal infiltration or (more sophisticated) ulnar nerve infiltration (Löfström 1975), in addition to evaluation using the various local anesthetic techniques.
Assessment of Local Anesthesia in Dentistry
Such methods are insufficient in dentistry, as the dental pulp is an organ not present in any other part of the body and which is very difficult to anesthetize. Unlike readily anesthetized soft tissues where the effect is long‐lasting, the duration of pulpal anesthesia is much shorter (Björn 1946; Björn and Huldt 1947) (Figure 5.3).
An effective assessment method was developed in 1946 by Hilding Björn (1907–1995), who used an electric pulp tester (EPT) to study the efficacy of anesthetic solutions. The device may be applied repeatedly to assess the duration of pulpal anesthesia, the criteria for which is if the tooth fails to respond to the maximum stimulus of the EPT. The reasoning behind this is that if the patient feels discomfort at less than the maximum stimulus, then there is a risk that the patient may respond to stimuli during the dental procedure (Björn 1946; Björn and Huldt 1947; Certosimo and Archer 1996). Moreover, successive electrical testing over a given time has been shown to induce no harm in the dental pulp (McDaniel et al. 1973). Recent research has found that the myelinated Aδ fibers in the pulp are stimulated by the EPT, whereas the unmyelinated polymodal C fibers are not (Lin and Chandler 2008; Sampaio et al. 2012).
Table 5.5 Vasodilatory effect of local anesthetics.
| Anesthetic | Type | Vasodilatory effect | Intensity of effect | Reference |
|---|---|---|---|---|
| Procaine | Ester | +++ | Very high | Du Mesnil de Rochemont and Hensel (1960), Lindorf et al. (1974), Lindorf (1979) |
| Tetracaine | Ester | ++ | High | Martindale (1982) |
| Bupivacaine | Amide | ++ | Aps and Reynolds (1976), Reynolds et al. (1976) | |
| Etidocaine | Amide | ++ | Eicholizer and Feldman (1976) | |
| Lidocaine | Amide | + | Moderate | Du Mesnil de Rochemont and Hensel (1960), Lindorf et al. (1974), Lindorf (1979), Muschaweck and Rippel (1974), Aps and Reynolds (1976), Reynolds et al. (1976) |
| Articaine | Amide | + | Muschaweck and Rippel (1974) | |
| Prilocaine | Amide | ± | Dilation, weak | Aström and Persson (1961), Akerman et al. (1966), Lindorf et al. (1974), Lindorf (1979), Reynolds et al. (1976), Chng et al. (1996) |
| Mepivacaine | Amide | − | Weak | Du Mesnil de Rochemont and Hensel (1960), Lindorf et al. (1974), Lindorf (1979), Vongsavan et al. (2000) |
| Ropivacaine | Amide | − | Iida et al. (2001), Timponi et al. (2006) | |
| Cocaine | Ester | − | High | Muscholl (1961) |
+ vasodilation; − vasoconstriction.
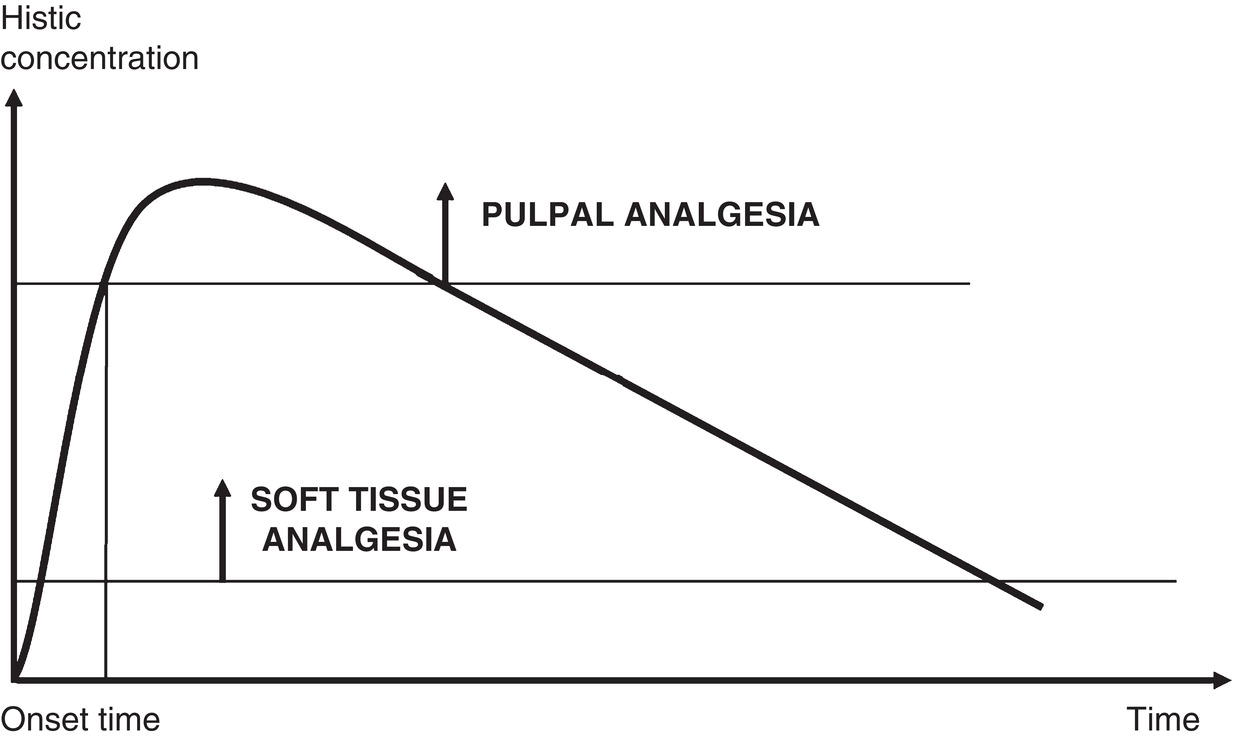
Figure 5.3 Concentration required to anesthetize soft tissue and pulp, showing much lower concentration and much longer duration in soft tissue.
Source: Redrawn from Haglund and Evers (1985).
Björn standardized the procedure by selecting the maxillary lateral incisor (LI) as the target, as this tooth exhibits scant anatomical variations and can be anesthetized with buccal infiltration, a simple technique which also limits individual variation. By injecting 1 ml of solution, Björn ensured that the experimental conditions were standardized and reproducible in all the series studied (Björn 1947; Björn and Huldt 1947). Such standardization is lacking in other methods (i.e. restorations, scaling, root canals, extractions) and uniform pain stimulus is difficult to attain and assess, and such methods furnish no information on the anesthetic effect in the pulp.
Mandibular block studies are useful for obtaining clinical information on that anesthetic technique and its limitations, but are of scant utility in assessing the effectiveness of local anesthetic solutions for a number of reasons.
- Technique sensitivity: As the technique is more difficult, failures due to technical errors are common. High interindividual variability, in turn, renders it more difficult to standardize.
- Accessory innervations: Despite a successful block indicated by an anesthetized lower lip, the patient may still have sensation in the pulp due to the high frequency of accessory innervation in the lower arch such as the buccal nerve and mylohyoid nerve (see Chapter 19).
- Anatomic variation: Anatomic variation in the mandible such as double mandibular foramen, accessory canals, high lingula, and variable gonial angle may result in anesthetic failure despite the use of correctly implemented standardized techniques to fail (see Chapter 19).
All the above‐mentioned variables are difficult to control and standardize, and thus reduce the utility of using mandibular block injections to assess local anesthetic solution efficacy.
Anesthetic Parameter
Certain variables, listed below, may be used as surrogate indicators of the clinical efficacy of anesthetic solutions, and these indicators may vary depending on the specific local anesthetic and vasoconstrictor, and their respective concentrations.
- Of the four variables selected here (Annexes 21 and 27), three are related to buccal infiltration of the maxillary lateral incisor (LI) with 1 ml of the local anesthetic solution (Annex 21):
- The percentage of LI pulpal anesthesia, i.e. the % of times the tooth is successfully anesthetized: 95%, for example.
- The mean duration in minutes of pulpal anesthesia in the LI: 45 minutes (written as 45′), for example.
- The mean duration in minutes of soft tissue anesthesia (upper lip anesthesia): 190 minutes (190′), for example.
- The fourth is related to mandibular block with 1.8 ml (equivalent to one cartridge) of the solution using the direct or conventional technique (Annex 27):
- The mean duration in minutes of lower lip anesthesia (soft tissue anesthesia): 200 minutes (200′), for example.
These four variables were used to build the anesthetic parameter, as follows: 95%‐45′/190′‐200′. This is the parameter for the standard solution, 2% lidocaine with 1:100 000 epinephrine (10 μg/ml) (L‐100) or 1:80 000 epinephrine (12.5 μg/ml) (L‐80). It means that injection of 1 ml of this solution in the maxillary lateral incisor ensures pulpal anesthesia in 95% of individuals that lasts on average for 45 minutes. In addition, soft tissue anesthesia lasts 190 minutes in the upper lip and 200 minutes in the lower, in the latter case after mandibular block with 1.8 ml of anesthetic solution. The first two values (% of anesthesia and duration in minutes of pulpal anesthesia) assess the potency and efficacy of the local anesthetic solution and the other two (duration of upper and lower lip anesthesia) provide information that can be conveyed to patients about the approximate post‐procedure duration of the perceivable effects (Figure 5.3).
The main advantage to this approach is that different solutions can be compared in a standard format, helping to choose the anesthetic solution best suited to the circumstances and to predict the expected results.
Anesthetic Concentration
Concentration is a factor particularly relevant to the efficacy and toxicity of local anesthetics, which are typically available in a number of dilutions.
Concentration and Volume
Medical practice often calls for anesthetizing large areas of (readily anesthetized) soft tissue, which in turn requires large volumes of anesthetic solution (20–30 ml for caudal or epidural block and up to 60 ml for intercostal or brachial plexus block). More diluted solutions are used under such conditions, with a lower concentration of anesthetic (Moore et al. 1972, 1977) and a standard epinephrine concentration of 1:200 000 (5 μg/ml) (Bonica 1959; Moore et al. 1972).
In dentistry, by contrast, the area involved is small and the target tissue is the dental pulp, which is very difficult to anesthetize. As a result, small volumes of more highly concentrated anesthetic solutions and vasoconstrictors are used (note: doses of over 5–7 ml per session, equivalent to three to four 1.8 ml cartridges, are rare) (Table 5.6). In dentistry, the standard epinephrine concentration is 1:100 000 (10 μg/ml), double the standard value applied in other areas of medical practice.
Table 5.6 Most commonly used concentrations of local anesthetics and epinephrine in medical and dental practice.
| Drug | Medicine | Dentistry |
|---|---|---|
| Lidocaine | 1–2% | 2% |
| Mepivacaine | 1–2% | 2–3% |
| Prilocaine | 2% | 3–4% |
| Epinephrine Standard concentration |
1:200 000 (5 μg/ml) |
1:100 000 (10 μg/ml) |
Concentration and Safety
In the early twentieth century the systemic toxicity of anesthetics was believed to rise exponentially with linear increases in their concentration, so that 1 ml of 2% procaine was deemed to be four times more toxic than 1 ml of a 1% solution (Waters 1933). That notion was accepted by the Council on Dental Therapeutics, which prohibited the use of 4% procaine (Council on Dental Therapeutics 1944).
Everett was the first to prove that in laboratory animals the median lethal dose, LD50, barely varied with concentration, but depended critically on the total dose administered (Everett 1949) (Table 5.7). Those findings were confirmed by clinical studies: the blood levels of local anesthetics are directly related to the amount administered and not to the concentration at which they are administered (Campbell and Adriani 1958; Braid and Scott 1965; Jebson 1971; Rood and Cannell 1978).
Concentration and Anesthetic Potency
Anesthetic potency has long been known to rise with concentration in animals (Gasser and Erlanger 1929; Campbell and Adriani 1958). In clinical dental studies 5% lidocaine was observed to yield better results than the 2% solution (Eldridge and Rood 1977; Rood and Sowray 1980; Lambrianidis et al. 1980). Clinical trials using the Björn EPT also proved that more highly concentrated solutions anesthetized dental pulp more effectively (Table 5.8).
Table 5.7 Lethal dose (LD50, mg/kg) of local anesthetics in animals.
| Anesthetic | Ad. | Animal | Concentration (%) | LD50 (mg/kg) | Reference |
|---|---|---|---|---|---|
| Procaine | SC | Mouse | 2 | 900 | Everett (1949) |
| 4 | ±890 | ||||
| IV | Rabbit | 2 | 50 | ||
| 4 | ±49 | ||||
| Mepivacaine | IV | Mouse | 2 | 31 | Luduena et al. (1960) |
| 3 | 32 | ||||
| IV | Rabbit | 2 | 21 | ||
| 3 | 22 | ||||
| IV | Guinea pig | 2 | 24.5 | ||
| 3 | 20.0 | ||||
| SC | Guinea pig | 2 | 93 | ||
| 3 | 94 |
Stay updated, free dental videos. Join our Telegram channel
VIDEdental - Online dental courses


