Introduction
Although the dentoalveolar and skeletal effects of rapid maxillary expansion are well documented, the condylar response to this procedure is not well understood. The purpose of this study was to test the following null hypothesis: rapid maxillary expansion promotes immediate changes of the position of the condyles in patients with Class I malocclusion.
Methods
Thirty-four subjects with Class I malocclusion underwent rapid maxillary expansion. Cone-beam computed tomography images were collected before activation of the expander and 3 weeks later, after screw stabilization. Using specific software functions, it was possible to determine and reproduce head positioning and landmarks during the different times of the study.
Results
The axial, coronal, and sagittal planes were examined, and no asymmetries in condylar positions were found at either time. However, statistically significant anterior and inferior displacements of these structures occurred, with respective average values of 0.52 and 0.49 mm. Lateral inclinations of both condyles were observed and confirmed by the coronal condylar angles.
Conclusions
The null hypothesis was rejected. Statistically significant anterior and inferior displacements of the condyles occurred. Lateral inclination of the condyles was observed.
The earliest report of maxillary expansion was in 1860 by Emerson Colon Angell, who claimed to have achieved opening of midpalatal suture and described a gap between the maxillary central incisors. Although the technique was discredited at that time, rapid maxillary expansion (RME) became commonly used only after the second half of the 20th century.
This procedure is recommended for increasing maxillary arch width deficiency (associated or not with posterior crossbite), modification of buccal root torque of the posterior teeth, correction of unilateral or bilateral crossbite, reducing nasal resistance to provide a normal breathing pattern, and mobilization of the maxillary sutures to facilitate correction of a Class II or Class III malocclusion.
The effects of maxillary expansion on mandibular posture have been elucidated in unilateral crossbite patients and recently discussed in patients with Class II malocclusions. Although the mandibular response to RME is well documented, little is known about its effects on the condyle and the glenoid fossa. As stated by many authors, some orthopedic interventions in growing patients can cause an alteration in mandibular position followed by bone remodeling in the glenoid fossa and condyle.
Clinical findings and finite element analysis suggest that rapid displacement of the maxillary lateral segments results in an extensive orthopedic intervention, causing occlusal changes that can lead to alterations in intercuspation and functional loading of the condyles. In these conditions, what would be the condylar response? This question was first introduced and evaluated by Arat et al, whose study was divided into 3 parts. These authors found a condylar response to RME by 18 weeks after expansion, and no signs of glenoid fossa remodeling were observed during this period. The results were based on magnetic resonance images of a sample of 18 subjects with Class I, Class II, and Class III malocclusions.
This study aimed to test the null hypothesis that RME does not induce immediate changes in the position of the condyles in Class I malocclusion patients without posterior crossbite.
Material and methods
To estimate sample size and considering a clinically significant difference between the 2 groups (Haas and hyrax) of 1 SD, 33 subjects would give 80% power to detect this difference at a significance level of 0.05. Thus, 34 adolescents from 5 high schools in Belo Horizonte, Brazil, with average ages of 12 years 10 months for girls and 13 years for boys, were selected for RME treatment. All patients had a Class I malocclusion and a clinical necessity for maxillary expansion without a posterior crossbite of more than 1 tooth. This necessity was confirmed by excessive palatal inclinations of the crowns of the posterior teeth, associated with a narrow smile and dark spaces of the buccal corridors larger than 20%, as described by Zange et al. Clinically healthy temporomandibular joints with a normal range of motion, no functional mandibular deviations, and no previous orthodontic treatment or clinical evidence of disc displacement, pain, or joint noises were necessary. Permanent dentition was present in both arches, except for the third molars (in some subjects, the permanent second molars were not totally erupted). Those with congenitally missing teeth, craniofacial deformity, or systemic illness were excluded. The subjects were randomly divided into 2 groups: Haas expander appliances (17 patients) and hyrax expander appliances (17 patients).
All appliances were manufactured by the same laboratory with 11-mm screws (Dental Morelli, São Paulo, Brazil) and stainless steel wires soldered on the palatal and vestibular surfaces of the bands of the maxillary first premolars and permanent first molars. During the first activation of the expanders, the screws were opened by 0.8 mm (a complete turn). The next activations were based on the same protocol adopted by several authors and consisted of a quarter turn (0.2 mm) in the morning and a quarter turn in the evening. The patients were instructed to return in 7 days for orthodontic evaluation, and the screws were stabilized when the tip of the palatal cusps of the maxillary permanent first molars contacted the tip of the buccal cusps of the mandibular permanent first molars, as determined by clinical inspection.
Cone-beam computed tomography images were obtained before cementation of the expanders (T0) and after screw stabilization (T1, approximately 3 weeks after T0). All patients remained in maximum dental intercuspation during the acquisition of these images, and their heads were oriented so that the Frankfort and midsagittal planes were parallel and perpendicular to the floor, respectively. The same cone-beam computed tomography machine (i-CAT, Imaging Sciences International, Hatfield, Pa) was used according to a standard protocol (120 kVp; 5 mA; field of view, 13 × 17 mm; voxel, 0.4 mm; and scan time, 20 seconds). The scanned data were exported in DICOM format and imported into Dolphin Imaging software (version 11.0; Dolphin Imaging & Management Solutions, Chatsworth, Calif) to reconstruct 3-dimensional images for further analysis. This project was approved by the ethics committee of the Collective Health Institute, Federal University of Rio de Janeiro in Brazil (number 35/2010, process number 62/2009). Informed consent was obtained from all patients’ parents or guardians.
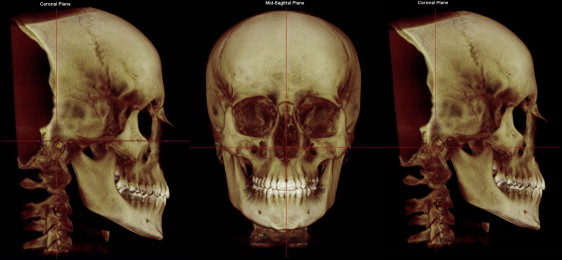
To make possible comparisons of the measurements at different times, head image position should be the same at T0 and T1. Using specific software functions, it was possible to standardize the head positions according to the Frankfort, coronal, axial, and sagittal planes. The Frankfort plane was oriented horizontally; the coronal and axial planes were positioned, respectively, tangentially to the posterior and inferior border of the external acoustic meatus, simultaneously at the right and left sides; and the sagittal plane was positioned passing through the internasal suture and anterior nasal spine. This head image position was called the original head orientation ( Fig 1 ).
After head standardization, it was possible to visualize the 3-dimensional head images with the reference planes. Based on original head orientation, the following landmarks were determined for the right and left sides.
- 1.
External acoustic meatus landmarks: the most lateral point of the posterior wall of the external acoustic meatus in the axial plane.
- 2.
Center of the condyles: first, the largest lateromedial and anteroposterior widths of the condyles were established. Next, based on the axial image, the intersection of the lines passing through these largest widths determined the center of the condyles.
- 3.
Laterosuperior condyle landmarks: using the coronal image slice showing the center of the condyles, this landmark was obtained by the intersection of 2 lines positioned, respectively, tangentially to the most lateral and superior border of the condyles ( Fig 2 ).
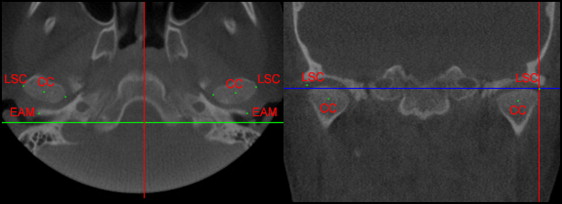
Fig 2 Landmarks in the axial and coronal views. CC , Center of the condyles; EAM , most lateral point of the posterior wall of the external acoustic meatus; LSC , laterosuperior condyle landmarks.
After landmark determinations, the original head orientation was again established, and the software symmetry caliper was used to obtain the following measurements on the right and left sides.
- 1.
The anteroposterior position of the condyles: the horizontal distance between the external acoustic meatus and the center of the condyle, based on the sagittal tomographic image.
- 2.
The vertical position of the condyles: using the same sagittal image, the vertical distance between the external acoustic meatus and the center of the condyle was obtained.
- 3.
The laterolateral position of the condyles: based on the axial tomographic image, the distance between the center of the condyles and the midsagittal plane was measured.
- 4.
The vertical difference of the condyles: considering the coronal tomographic image, the center of the condyle landmarks (right and left) were orthogonally projected on the midsagittal plane, and the vertical distances were measured.
- 5.
The anteroposterior difference of the condyles: considering the axial tomographic image, the anteroposterior distances of the orthogonal projection of the center of the condyles landmarks (right and left) on the midsagittal plane were measured.
- 6.
The axial condylar angle: the angle formed by the intersection of the line passing through the center of the condyle and the laterosuperior condyle landmarks with the midsagittal plane on the axial tomographic image.
- 7.
The coronal condylar angle: the angle formed by the intersection of the line connecting the center of the condyle and the laterosuperior condyle landmarks with the midsagittal plane on the coronal tomographic image ( Fig 3 ).
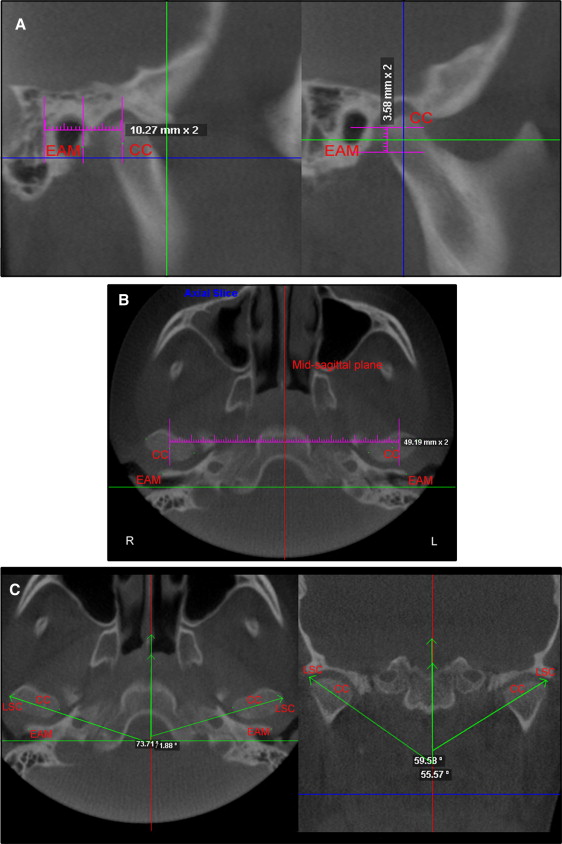
Fig 3 A, Vertical and anteroposterior displacements of the condyles measured with a symmetry caliper; B, the distance between center of the condyles and the midsagittal plane was measured with a symmetry caliper to determine the laterolateral position of the condyles; C, axial and coronal condylar angles. CC , Center of the condyles; EAM , most lateral point of the posterior wall of the external acoustic meatus; LSC , laterosuperior condyle landmarks.
To determine the reliability and reproducibility of the data, the same examiner (C.A.M.) performed all measurements for this study in 3 patients. These measurements were repeated 3 times with an interval of 1 week between measurements. Intraclass correlation coefficients were used to determine measurement consistency. A nonpaired Student t test was used to compare the differences between both expanders (Haas and hyrax), and a paired Student t test was used to compare the results at T0 and T1. A significance level of 5% was adopted.
Results
Considering all results described in this study, there were no statistically significant differences when the effects of the Haas and hyrax expanders were compared ( Tables I and II ). Thus, the total sample of 34 subjects was considered for all analyses. Likewise, no statistically significant differences were observed when the right and left sides were compared, indicating condylar symmetry at T0 and T1. The means, standard deviations, and differences between the right and left sides are shown in Table III .
| Haas (n = 17) | Hyrax (n = 17) | Haas × hyrax | |||||||||||
|---|---|---|---|---|---|---|---|---|---|---|---|---|---|
| Right side | Left side | Difference (right–left) | Right side | Left side | Difference (right–left) | Total difference | Significance ( P value) | ||||||
| Mean | SD | Mean | SD | Mean | SD | Mean | SD | Right | Left | ||||
| APPC (mm) | 7.78 | 1.63 | 7.71 | 1.56 | 0.07 | 7.88 | 1.72 | 7.85 | 1.66 | 0.03 | 0.1 | 0.14 | NS |
| VPC (mm) | 9.1 | 2.03 | 8.94 | 2.38 | 0.16 | 9.02 | 2.45 | 8.74 | 2.32 | 0.28 | 0.08 | 0.2 | NS |
| LLPC (mm) | 48.02 | 2.87 | 48.17 | 2.33 | −0.15 | 47.68 | 3.01 | 47.79 | 2.78 | −0.11 | 0.34 | 0.38 | NS |
| VDC (mm) ∗ | – | – | – | – | 0.10 | – | – | – | – | 0.14 | 0.04 | NS | |
| APDC (mm) ∗ | – | – | – | – | 0.08 | – | – | – | – | 0.04 | 0.04 | NS | |
| ACA (°) | 71.09 | 5.65 | 69.84 | 5.84 | 1.25 | 68.91 | 5.32 | 68.7 | 4.98 | 0.21 | 2.18 | 1.14 | NS |
| CCA (°) | 49.45 | 4.17 | 49.88 | 5.06 | 0.43 | 52.09 | 5.22 | 49.04 | 5.03 | 3.05 | 2.64 | 0.84 | NS |
∗ The values already represent the difference between right and left sides.
| Haas (n = 17) | Hyrax (n = 17) | Haas × hyrax | |||||||||||
|---|---|---|---|---|---|---|---|---|---|---|---|---|---|
| Right side | Left side | Difference (right–left) | Right side | Left side | Difference (right–left) | Total difference | Significance ( P value) | ||||||
| Mean | SD | Mean | SD | Mean | SD | Mean | SD | Right | Left | ||||
| APPC (mm) | 8.12 | 1.24 | 8.27 | 1.46 | −0.15 | 8.42 | 1.83 | 8.51 | 1.72 | −0.09 | 0.3 | 0.24 | NS |
| VPC (mm) | 9.72 | 2.73 | 9.53 | 2.39 | 0.19 | 9.34 | 1.95 | 9.17 | 2.18 | 0.17 | 0.38 | 0.36 | NS |
| LLPC (mm) | 48.33 | 2.55 | 47.93 | 2.78 | 0.4 | 47.93 | 2.77 | 47.49 | 2.63 | 0.44 | 0.4 | 0.44 | NS |
| VDC (mm) ∗ | – | – | – | – | 0.19 | – | – | – | – | 0.15 | 0.04 | NS | |
| APDC (mm) ∗ | – | – | – | – | −0.16 | – | – | – | – | −0.12 | 0.04 | NS | |
| ACA (°) | 69.18 | 4.78 | 67.89 | 5.02 | 1.29 | 71.04 | 4.98 | 69.85 | 5.64 | 1.19 | 1.86 | 1.96 | NS |
| CCA (°) | 53.28 | 4.82 | 51.92 | 5.23 | 1.86 | 51.78 | 5.13 | 51.02 | 5.73 | 0.26 | 1.5 | 0.9 | NS |
∗ The values already represent the difference between right and left sides.
| T0 | T1 | |||||||||||
|---|---|---|---|---|---|---|---|---|---|---|---|---|
| Right side | Left side | Difference (right–left) | Significance ( P value) | Right side | Left side | Difference (right–left) | Significance ( P value) | |||||
| Mean | SD | Mean | SD | Mean | SD | Mean | SD | |||||
| APPC (mm) | 7.83 | 1.5 | 7.78 | 1.58 | 0.05 | NS | 8.27 | 1.44 | 8.39 | 1.64 | −0.12 | NS |
| VPC (mm) | 9.06 | 2.19 | 8.84 | 2.38 | 0.22 | NS | 9.53 | 2.42 | 9.35 | 2.28 | 0.18 | NS |
| LLPC (mm) | 47.85 | 2.74 | 47.98 | 2.47 | −0.13 | NS | 48.13 | 2.83 | 47.71 | 2.71 | 0.42 | NS |
| VDC (mm) ∗ | – | – | – | – | 0.12 | NS | – | – | – | – | 0.17 | NS |
| APDC (mm) ∗ | – | – | – | – | 0.06 | NS | – | – | – | – | −0.14 | NS |
| ACA (°) | 70 | 5.45 | 69.27 | 5.32 | 0.73 | NS | 70.11 | 5.47 | 68.87 | 5.33 | 1.24 | NS |
| CCA (°) | 50.77 | 4.37 | 49.46 | 5.26 | 1.31 | NS | 52.53 | 4.91 | 51.47 | 5.48 | 1.06 | NS |
Stay updated, free dental videos. Join our Telegram channel
VIDEdental - Online dental courses


