Introduction
Attempts have been made to identify susceptibility genes of mandibular prognathism by genome-wide linkage studies, but the results of susceptibility loci are inconsistent. There has been no genome-wide association study of mandibular prognathism. Our objective was to perform a genome-wide association study using 23,465 microsatellite markers to detect mandibular prognathism susceptibility regions.
Methods
The study was based on the pooled DNA method, including 2 steps of screening on the whole genome and subsequent individual genotyping, with 240 experimental subjects and 360 control subjects from the Japanese population.
Results
Two suggestive associations on chromosomes 1q32.2 (D1S1358i: P = 4.22 × 10 −4 ) and 1p22.3 (D1S0411i: P = 6.66 × 10 −4 ) were shown, and PLXNA2 and SSX2IP were suggested to be candidate genes; 1p22.3 flanked the region indicated by previous linkage analysis.
Conclusions
The results of the genome-wide association study showed that 2 loci (1q32.2 and 1p22.3) are likely to be susceptibility regions of mandibular prognathism: 1p32.2 is a novel locus, and identification of 1p22.3 supports the results of previous linkage analysis.
Mandibular prognathism, skeletal Class III malocclusion in orthodontics, occurs in populations throughout the world but with a higher incidence in Asian populations. The prevalences are less than 1% in white people but about 10% in Japanese people.
In previous studies, this disease has been shown to be caused by various patterns of genetic inheritance and environmental factors. Although multiple models of inheritance of the disease, including polygenic inheritance, monogenic inheritance, autosomal-dominant inheritance, and autosomal-recessive inheritance, have been suggested, it is evident that mandibular prognathism is a complex disease to which both genetic and environmental factors contribute. Recent progress in molecular genetics has enabled examination of susceptibility genes.
At present, orthognathic surgery is frequently used to treat adults with mandibular prognathism. Young patients with mandibular prognathism who are treated at orthodontic clinics often receive orthopedic treatment with a chincap appliance for inhibiting mandibular bone growth in their growing period. Control of mandibular bone growth can improve the anteroposterior relationship of the maxilla and the mandible in many patients. However, despite growth control for many years, the mandible sometimes grows excessively, and mandibular prognathism appears again in the late growth period. Some patients will therefore need to undergo orthognathic surgery despite long-term use of a chincap appliance. If orthodontists could predict whether patients have strong factors for excessive mandibular growth, they could select strategies to treat mandibular prognathism more effectively.
An affected sibling pair analysis of mandibular prognathism in Japanese and Korean patients suggested that chromosomes 1p36, 6q25, and 19p13.2 were associated with the disease. Association studies of the 1p36 locus were also carried out and suggested that a cartilage matrix protein ( Matrilin-1 ) and erythrocyte membrane protein band 4.1 ( EPB41 ) were the susceptibility genes of the disease. On the other hand, a linkage study in Brazilian families showed that 1p36, 6q25, and 19p13.2 were not associated with the disease. Moreover, a linkage study of 4 Hispanic families with Colombian backgrounds demonstrated that 5 loci—1p22.1, 3q26.2, 11q22, 12q13.13, and 12q23—were related to mandibular prognathism. Tassopoulou-Fishell et al suggested that myosin 1H ( MYO1H ) located on 12q24.11, which is near 12q23, was a susceptibility gene of the disease. Additional studies would strengthen our knowledge. There have been 2 more linkage studies on candidate loci and genes of mandibular prognathism. Genome-wide association study (GWAS) has been proposed as an alternative strategy for linkage analysis. However, there has been no GWAS of mandibular prognathism.
Microsatellites and single nucleotide polymorphisms have been used for association studies. Microsatellites are highly polymorphic and show a high degree of heterozygosity (about 70% on average) and linkage disequilibrium lengths in the 100-kilobase (kb) range. Single nucleotide polymorphisms are thought to be genetically more stable because of a lower mutation rate, to be biallelic, and to show a low degree of heterozygosity and a short range of linkage disequilibrium (about 30 kb). Microsatellites are not likely to be evenly distributed across the genome, leaving some areas with no or little coverage. Therefore, most GWAS has been performed using single nucleotide polymorphisms. However, a microsatellite-based GWAS can be conducted with a small number of markers, and highly polymorphic microsatellites can provide greater power for detection of intermarker linkage disequilibrium than can single nucleotide polymorphisms. Loci have been identified in some diseases by association analysis with microsatellite markers.
To identify the susceptibility loci of mandibular prognathism, we carried out the first preliminary GWAS using microsatellites in Japanese subjects including 240 with mandibular prognathism and 360 who were healthy (controls).
Material and methods
For this study, 240 subjects with mandibular prognathism and 360 healthy controls, all of Japanese descent, were recruited. All subjects with mandibular prognathism were surgical orthodontic patients who underwent orthognathic surgery (distal bone fragment of the mandible being set back) at Hokkaido University Hospital, Hokkaido, Japan. Their ANB angles of sagittal jaw relationship were less than 0.0°, determined by cephalometric analysis, and they had an anterior crossbite. The criterion for choosing mandibular prognathism was almost the same as in previous studies. Patients who had severe undergrowth of the maxilla relative to normal maxillary length and a congenital disorder such as cleft palate or a general physical disease were excluded. The patients’ ages ranged from 17 to 53 years, with a mean age of 26 years. All control subjects were enrolled from Tokai University, Kanagawa, Japan, and were systemically healthy. The ethics committees of the School of Dentistry and Pharmaceutical Science of Hokkaido University and the School of Medicine of Tokai University approved the protocol of the study. All subjects gave written informed consent for participation in the study.
A QIAamp DNA Blood Maxi Kit (QIAGEN, Hilden, Germany) was used to extract genomic DNA from whole blood cells. Procedures were carried out under standardized conditions to prevent variations in DNA quality. Microsatellite typing was conducted by the pooled DNA method. Genomic DNA samples that had been quantitated accurately from each subject in both groups were used in the pooled method.
Polymerase chain reaction was performed in 20 μL of the reaction mixture containing pooled genomic DNA, deoxynucleotide triphosphate, 10× buffer (100 mmol/L Tris-HCl, pH 8.3; 500 mmol/L KCl; and 15 mmol/L MgCl 2 ), forward and reverse primers, and DNA polymerase (Ampli Taq Gold; Applied Biosystems Japan; Tokyo, Japan) in 96-well plates. Amplification was carried out using a thermal cycler (GeneAmp PCR system 9700; Applied Biosystems Japan) with initial denaturation for 9 minutes at 96°C and then for 30 cycles of 1 minute at 96°C, annealing for 45 seconds at 57°C, and extension for 45 seconds at 72°C.
Each polymerase chain reaction product was diluted to 1:10 or 1:40 with water, mixed with formamide and a size standard marker (GeneScan500LIZ; Applied Biosystems Japan), and denatured for 3 minutes at 96°C. Then the polymerase chain reaction products were analyzed by an automated DNA sequencer (ABI Prism 3730; Applied Biosystems Japan) and software (GeneScan; Applied Biosystems Japan).
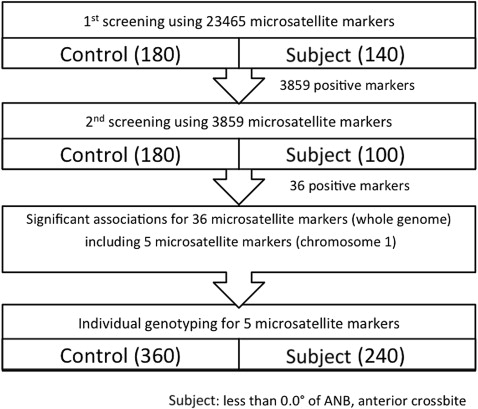
Two steps of screening were performed to sequentially replicate the results in each pooled sample, thereby reducing the number of pseudopositives resulting from type I errors. In the first screening, pooled DNA was screened using a dense panel of 23,465 microsatellites covering the whole genome. Allele frequency for pooled DNA typing was estimated by the height of each peak analyzed by the software (Multi peaks; Applied Biosystems Japan). Microsatellite markers showing statistical significance ( P <0.05) throughout the first screening were subjected to the second screening. The numbers of subjects and controls for the first screening were 140 and 180, and those for the second screening were 100 and 180, respectively. Independent samples were used for the first and second screenings ( Fig ).
The positive microsatellite markers that showed significant associations after pooled DNA typing were screened by using not pooled DNA, but individual DNA from the pooled DNA set (240 subjects and 360 controls) to confirm the significance of allele frequency ( Fig ). Polymerase chain reaction was performed in 10 μL of reaction mixture containing 2 ng of genomic DNA, deoxynucleotide triphosphate, 10× buffer (100 mmol/L Tris-HCl, pH 8.3; 500 mmol/L KCl; 15 mmol/L MgCl 2 ), forward and reverse primers, and DNA polymerase (Ampli Taq Gold; Applied Biosystems Japan) in 96-well plates. The amplification conditions and method for analyzing the polymerase chain reaction products were the same as those for the pooled DNA genotyping.
Statistical analysis
Statistical significance for the subject-control associations was determined by 2 types of the Fisher exact test for 2 × 2 contingency tables for each allele and 2 × m contingency tables (where m is the number of alleles for the marker) for each locus. Statistical significance was defined at the P <0.05 level.
The result from each genotyping was tested for departure from the Hardy-Weinberg equilibrium using an expectation-maximization approach as implemented in GENEPOP.
Results
The first screening was conducted with 23,465 microsatellite markers on the whole genome for 140 subjects and 180 controls. These markers were designed to chart the human genome with a mean interval of about 120 kb. Of the 23,465 microsatellites, 3859 showed a statistically significant ( P <0.05) association throughout the first screening ( Fig ). The significance of the association between allele frequencies of the subject and control pools in the screening was assessed by the Fisher exact test using 2 × 2 contingency tables for each marker.
To reduce type I error, a further screening step was performed using different subject and control pools. The same number of microsatellites (3859) was used in the second screening. The second screening was conducted in the same way as the first screening for 100 subjects and 180 controls. Furthermore, the markers that showed a different pattern of peaks between the first and the second screenings were excluded. Throughout the second screening, 36 markers showed statistically significant associations ( Fig ).
As the final step, we preliminarily confirmed each positive marker that passed the screenings by individual genotyping ( Table I ) using not pooled DNA but individual DNA from the pooled DNA set. Only 5 markers on chromosome 1 passed this ultimate test. We selectively investigated chromosome 1 because this is the region where susceptibility loci of mandibular prognathism were identified in 2 previous linkage analyses.
| MS marker | Cytoband | Physical position of amplicon ∗ | Primer sequence | ||
|---|---|---|---|---|---|
| From | To | Forward | Reverse | ||
| D1S1028i | 1p34.3 | 38575697 | 38576036 | TGACGTGATATTTGAAATCATA | CTATTGGCATTGCTAAGATTATAG |
| D1S0337i | 1p34.1 | 44738410 | 44738702 | GAGCTATTAGCAATGTCAGAAAAC | GGCTGAGCATGAGAATCAC |
| D1S411 | 1p31.1 | 70054757 | 70054960 | GAGGTCAGTTGATCCAGTGG | AAGGTTTCTGAGAACTTTTTGTG |
| D1S0411i | 1p22.3 | 85179329 | 85179616 | TGCTTGAACCTGATAGGTAGAG | GGCTTGTAGATGCTAGGAAAG |
| D1S1358i | 1q32.2 | 208365606 | 208365706 | AGTCACCACCTGCCATATG | TCCAGGGTTGTCTTGTCC |
∗ Physical position of amplicon refer to the GRCh build 37/hg19.
These 5 microsatellite markers were then typed in the full sample of 240 subjects and 360 controls ( Fig ). Two markers (D1S1358i and D1S0411i) showed significant differences between the allele frequencies of the subjects and controls: the first (D1S1358i; P = 4.22 × 10 −4 ) was located on chromosome 1q32.2, and the second (D1S0411i; P = 6.66 × 10 −4 ) was located on chromosome 1p22.3 (cytobands refer to the GRCh build 37/hg19) ( Table II ). D1S0411i (1p22.3) was located near (3.17 megabase [Mb]) the marker (D1S2865: 1p22.3) that suggested an association with mandibular prognathism in a previous linkage analysis ( Table III ). D1S2865 was previously located at 1p22.1 in linkage analysis by Frazier-Bowers et al ; however, the marker is located at 1p22.3 with reference to GRCh build 37/hg19.


