Introduction
In this study, we used liquid chromatography-mass spectrometry (LC-MS) to investigate the differences in the composition of gingival crevicular fluid between resorbing deciduous molars and nonresorbing permanent teeth. The main goal was to identify novel biomarkers associated with root resorption.
Methods
Eleven children (4 boys, 7 girls) in the mixed dentition were selected to participate in this split-mouth design study, in which a deciduous second molar with radiographic evidence of root resorption served as the experimental site, and the permanent first molar on the contralateral quadrant was the control site. Gingival crevicular fluid was collected using absorbing strips. A total of 22 samples (11 root resorption, 11 control) were each analyzed with 1-dimensional LC-MS. The remaining samples were then pooled across the 11 patients and analyzed by 2-dimensional LC-MS. The output files were converted to mascot generic format, which can be used to perform protein identification with conventional search engines.
Results
The 2-dimensional LC-MS protocol was able to identify 2789 and 2421 proteins in the control and resorption pooled samples, respectively. In this population, we detected significantly upregulated and downregulated proteins in the teeth with root resorption. Interestingly, many of these proteins are characteristically found in exosomes.
Conclusions
We identified novel proteins that might prove to be useful biomarkers of root resorption, individually or as part of a panel.
External root resorption is a universal term that describes the breakdown of cementum, a tissue that forms a protective barrier around the root, and the subsequent loss of the root structure, which is mainly formed by dentin. Many factors are involved in the etiology of external root resorption including trauma, periodontal disease, and orthodontic treatment. Generally, severe root resorption involves the loss of over one third of the root length. Histologically, root resorption is manifested as a congregation of osteoclastic cells and resorption lacunae along the root surface. Sections from orthodontically treated rats showed extensive root resorption lacunae with enzymatic reaction penetrating the dentin after 7 days of orthodontic appliance activation. In human teeth, histologic changes can be observed 3 to 5 weeks after initiation of an orthodontic force. Severe root resorption can lead to mobility and loss of permanent teeth; thus, early detection of root resorption is essential for identifying at-risk patients.
The most popular clinical method to identify root resorption is to use radiographs. Problems with technique, standardization, limited points of view, and radiation exposure are significant problems with this method. Most importantly, radiographs do not indicate whether the root resorption is active or inactive. Computerized tomography and cone-beam volumetric imaging have been shown to increase sensitivity; however, the cost and high radiation exposure make it difficult for routine use in dentistry. With these limitations, there is an indication for a more sensitive, safer, and more prognostic and diagnostic method for detecting root resorption.
Gingival crevicular fluid (GCF) is a serum transudate found in the gingival sulcus that can be collected at the gingival margin or in the crevice. The site-specific nature of GCF (as opposed to saliva) means that it has great potential in containing factors that are specific for actions at a given site and might have diagnostic value to detect early stages of root resorption. Previous studies have attempted to use traditional techniques such as Western blotting and enzyme-linked immunosorbent assay (ELISA) to identify dentin breakdown proteins in GCF as potential markers of root resorption. Although these studies have pointed to novel approaches, it is not yet possible to translate biomarkers of root resorption into clinical practice.
Evaluation of protein expression patterns in body fluids with proteomic technologies can be used to discover new biomarkers for the detection of various diseases. Dramatic improvements in the capabilities of mass analyzers have been demonstrated recently, resulting in the growing success and coverage of protein identification and quantitation techniques with mass spectrometry (MS) in biomedical studies. MS analysis consists of a molecule’s ionization and measuring its mass-to-charge ratio (m/z). This analysis permits determination of mass, composition, and, in many cases, the primary structure of the proteins in a sample. The mass measurement of intact proteins or peptides, referred to as single MS, typically cannot provide confident identification, since the masses of intact peptides are not unique. Additional information can be obtained by further fragmentation of peptides and proteins, followed by measurement of m/z values of the fragments, often referred to as tandem mass spectrometry (MS/MS). Recently, the combination of powerful protein separation techniques such as liquid chromatography (LC) and MS has significantly facilitated the challenging detection of biomarkers in body fluids.
Protein quantitation is a powerful tool for the identification of protein biomarkers among hundreds or thousands of other proteins that might be detected during proteomic analysis. Elevated or significantly reduced levels of some proteins can indicate their involvement in disease processes. High-abundance proteins (eg, albumin in serum samples) are not usually of interest in these studies. Proteins in low abundance, however, might contain biomarkers that are related to the differences between the study and control systems (ie, disease vs normal state). This category of biomarkers includes cell-surface receptors and peptides released by cells. In recent years, the characterization of exosomes has also emerged as an attractive option for the discovery of biomarkers. Exosomes are small vesicles released from the cell that can carry many signaling molecules. Their remarkable stability and easy accessibility from body fluids make exosomes a promising reservoir of biomarkers.
Only recently have MS techniques been used for the analysis of GCF composition, identifying 66 to 470 human protein components. The authors of these studies are trying to find proteins that can play roles as markers in gingivitis and periodontitis. To the best of our knowledge, no one has carried out a detailed proteomic analysis of GCF with external root resorption. Therefore, the main goal of this study was to use LC-MS to investigate the differences in the GCF composition between resorbing deciduous molars and nonresorbing permanent teeth. An additional goal included deep characterization of the protein content of GCF using 2-dimensional LC-MS protocols, which are yet to be applied to the studies of GCF composition. These findings might speed the translation of research into improved dental care by identifying novel combinations of biomarkers for the diagnosis of root resorption.
Material and methods
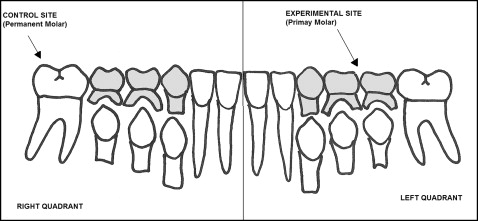
Eleven children (4 boys, 7 girls) were selected to participate in this study based on the following inclusion criteria: (1) mixed dentition with dental ages of 10 or 11 years, (2) no medical contraindications, (3) good oral hygiene, (4) periodontal values within the normal range, and (5) no associated pulpal pathology. Ethical clearance for the study was obtained from the Health Research Ethics Board at the University of Manitoba (reference number, H2011:289). Informed consent was obtained from each subject and responsible adult before enrollment. The split-mouth design that we used is summarized in Figure 1 . GCF samples were collected from a deciduous second molar with radiographic evidence of root resorption on 1 quadrant (experimental site) and from the permanent first molar on the contralateral quadrant (control site) in the same jaw. Exfoliation of deciduous molars involves extensive and complete root resorption; this makes these teeth ideal experimental sites. On the other hand, a dental age of 10 or 11 years is the time by which the roots of the permanent first molars are fully formed, making those teeth suitable control sites.
Each site was dried for 5 seconds with compressed air and isolated from saliva with a cotton roll. After that, GCF was collected using absorbing strips (Periopaper; Oraflow, Plainview, NY). Two strips were inserted for 40 seconds into the gingival sulcus at the lingual side of each selected tooth. Samples visibly contaminated with blood were discarded. The paper strips were then placed into sealed tubes and immediately frozen at −80°C for further processing.
Dithiothreitol, iodoacetamide, and trifluoroacetic and formic acids were obtained from Sigma-Aldrich Chemicals (St Louis, Mo). Sequencing grade modified trypsin (Promega, Madison, Wis) was used for digestion. The proteins were extracted from the absorbing strips by sonication in 100 μL of 100 mmol/L of ammonium bicarbonate. Protein extracts were reduced (10 mmol/L dithiothreitol, 30 minutes, 57°C) and alkylated (50 mmol/L iodoacetamide, 30 minutes in the dark at room temperature). The excess alkylating agent was removed by quenching with an equivalent amount of dithiothreitol (15 mmol/L). Trypsin digestion was performed using 1/50 enzyme/substrate ratio (12 hours, 37°C). The approximate amount of extracted proteins in each sample was determined using NanoDrop2000 (Thermo Fisher Scientific, Rockford, Ill), which measures the peptide content after digestion. We found that protein extraction from each absorbing strip generated approximately 4 to 9 μg of peptides. After digestion, the peptides were purified with C18 ZipTip (Waters, Milford, Mass) using a trifluoroacetic acid-based solvent system.
A splitless nano-flow nano-ULTRA LC system (Eksigent, Dublin, Calif) with a 10-μL sample injection via a 300 μm × 5 mm PepMap100 trap column (Thermo Fisher Scientific) and a 100 μm × 200 mm analytic column packed with 5 μm Luna C18(2) (Phenomenex, Torrance, Calif) was used for reversed phase LC fractionation before MS analysis. Approximately 2 μg of the digests were injected into each LC-MS run. Both eluents A (water) and B (acetonitrile) contained 0.1% formic acid as an ion-pairing modifier. A 0.33% acetonitrile per minute linear gradient (0%-30% B) was used for peptide elution in the 1-dimensional LC experiments, providing a total 2-hour run time per sample. The same system was used as a second dimension separation for the analysis of pooled peptide mixtures by 2-dimensional LC-MS. In this case, 20 fractions collected during the first dimension separation (described below) were analyzed independently by LC-MS with formic acid as the ion-pairing modifier. A 0.66% acetonitrile per minute linear gradient (0%-30% B) was used, providing approximately 1 hour of acquisition time for each fraction.
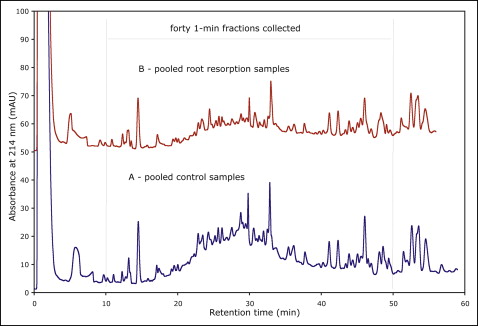
We used a novel 2-dimensional reversed phase–reversed phase separation protocol with pH 10 and pH 2 eluent conditions. In the first dimension, a 1 × 100 mm XTerra (Waters) column was used with the Agilent 1100 Series HPLC system (Agilent Technologies, Wilmington, Del) and a linear water-acetonitrile gradient (20 mmol/L ammonium formate, pH 10, in both eluents A and B, 1% acetonitrile per minute, 150 μL/min flow rate). Buffers A and B for first dimension separation were prepared by a 1/10 dilution of 200 mmol/L concentrated ammonium formate buffer with water and acetonitrile, respectively. Approximately 20 to 40 μg of the pooled protein digest was fractionated. Forty 1-minute fractions were collected, approximately 0.5 to 1 μg per fraction in each 10- to 50-minute elution window ( Fig 2 ). The fractions were concatenated pair-wise, providing 20 fractions for subsequent LC-MS analysis. Fractions were lyophilized and resuspended in 25 μL of buffer A solution (0.1% formic acid in water) for the second dimension separation. Therefore, the total analysis time for the 2-dimensional LC-MS procedures was approximately 20 hours.
The nano-flow LC system was coupled to a Triple TOF 5600 mass spectrometer (ABSciex, Toronto, Ontario, Canada), via an IonSpray III nano-source (ABSciex). Each measurement cycle consisted of a 250-ms MS measurement (m/z values of eluting peptides) and up to 20 MS/MS (100 ms each) performed on the most abundant peaks with charge states +2 to +5. The output files were converted to mascot generic format, which can be used for protein identification with conventional search engines. Mascot generic format files were searched against a database from the National Center for Biotechnology Information’s derived human protein database. Peptide identification was conducted with our in-house (Manitoba Center for Proteomics) graphics processing unit-based search engine, which uses identification strategies and peptide and protein scoring algorithms from X!Tandem with parent ion and fragment ion mass tolerances of 20 parts per million and ± 0.1 dalton, respectively. No amino acid posttranslational modifications or peptide truncations were permitted, aside from the standard fixed alkylation of cysteine with iodoacetamide (C + 57.021 dalton). Table I shows the search results conducted by the global proteome machine with the X!Tandem algorithm software ( thegpm.org ). Because of the identical times of MS/MS acquisition (100 ms), the sum of fragment intensities correlates with the abundance of a particular peptide. Therefore, the sum of peptide intensities can be used for the analysis of relative protein abundance. We also applied additional peptide retention time prediction filtering criteria to improve our confidence of identification.
∗ Global proteome machine ( GPM ) is a Web-based user interface for analyzing and displaying protein identification data.
A total of 22 samples (11 fluid samples of resorbing deciduous molars and 11 fluid samples of nonresorbing permanent molars) were each analyzed using 1-dimensional high-performance LC-MS. This analysis was performed in an attempt to identify proteins that are uniquely expressed in the GCF of resorbing deciduous molars. We used approximately 2 μg of peptides (about 1/3 of the total peptide content) from each digest in these analyses.
The remaining digests from the experimental and control sites were then pooled across the 11 patients, thereby providing pooled GCF samples from resorbing teeth and from nonresorbing controls. These pooled samples were analyzed by 2-dimensional high-performance MS/MS in an attempt to provide extended proteome coverage of GCF and confirm the findings from the 1-dimensional analyses. The resulting converted spectrum collections (mascot generic format files) contained approximately 214,000 MS/MS spectra entries for the controls and 181,000 MS/MS entries for the resorption sites. The mascot generic format spectra collections were searched against the same database using the same operational settings described above.
Results
Our initial goal behind the 1-dimensional LC-MS analysis was to identify unique biomarkers characteristic of the root resorption process—ie, proteins that were absent or observed in low quantities in the controls, while also occupying a large subset of the resorbing tooth samples. Table II shows the identification summary for these samples on the protein and peptide levels. The identification scores are expressed in the log(e) (expectation value) scale: the lower scores correspond to more confident identifications. Proteins with log(e) scores less than −3 are typically considered to be confident identifications. Lowering the cutoff value to −10 decreases the number of identifications but increases the confidence.
| Sample | Proteins log(e) ≤10 | Proteins log(e) ≤3 | Nonredundant peptides | Total peptides | Number of MS/MS |
|---|---|---|---|---|---|
| Patient 1 (C) | 485 | 782 | 1435 | 4474 | 35457 |
| Patient1 (RR) | 426 | 637 | 1187 | 3657 | 33830 |
| Patient 2 (C) | 335 | 552 | 1070 | 3359 | 33874 |
| Patient 2 (RR) | 396 | 685 | 1166 | 3872 | 34589 |
| Patient 3 (C) | 646 | 945 | 2456 | 7672 | 39734 |
| Patient 3 (RR) | 606 | 898 | 2295 | 7564 | 42004 |
| Patient 4 (C) | 404 | 603 | 1416 | 4970 | 39423 |
| Patient 4 (RR) | 421 | 621 | 1425 | 4717 | 35141 |
| Patient 5 (C) | 527 | 806 | 1615 | 6344 | 41576 |
| Patient 5 (RR) | 329 | 576 | 985 | 4468 | 33853 |
| Patient 6 (C) | 387 | 619 | 1259 | 5489 | 40087 |
| Patient 6 (RR) | 420 | 672 | 1311 | 5704 | 36622 |
| Patient 7 (C) | 16 | 17 | 18 | 507 | 1402 |
| Patient 7 (RR) | 337 | 553 | 1001 | 4295 | 32452 |
| Patient 8 (C) | 398 | 617 | 1091 | 4361 | 33081 |
| Patient 8 (RR) | 335 | 569 | 1152 | 5374 | 37129 |
| Patient 9 (C) | 329 | 511 | 1002 | 4633 | 34799 |
| Patient 9 (RR) | 339 | 518 | 933 | 3787 | 33388 |
| Patient 10 (C) | 479 | 755 | 1387 | 5644 | 37015 |
| Patient 10 (RR) | 459 | 720 | 1565 | 6322 | 41450 |
| Patient 11 (C) | 478 | 867 | 1401 | 5630 | 37218 |
| Patient 11 (RR) | 472 | 767 | 1333 | 5359 | 37333 |
| Pooled 2D-LC (C) | 1827 | 2789 | 5632 | 21345 | 214233 |
| Pooled 2D-LC (RR) | 1521 | 2421 | 4629 | 16613 | 181520 |
Unfortunately, the approach of pursuing peptides uniquely present in resorbing teeth samples was not successful, in this case because of significant variability in protein expression between subjects and the presence of major protein components. These resulted in significant variations in the number of peptide identifications in each patient set. At the extremes, the analyses of the GCF samples from patient number 9 identified about 1000 nonredundant peptides in both the control and resorbing teeth, whereas for patient number 3, approximately 2500 peptides were found. The control sample from patient number 7 was lost at the stage of sample collection and digestion ( Table II ). Overall, we found it difficult to attribute the presence or absence of particular proteins as the product of differences in sample amounts or from actual biologic processes. We have found in similar serum-based biomarker discovery studies that human serum albumin is a major source of tryptic peptides, masking identification of species that are not abundant. In this study, we found that albumin represents approximately 25% of the overall protein signal content, consistent with previously reported compositional studies of GCF.
We estimated that our GCF protein extraction procedure generated small amounts (4-9 μg) of protein, making it difficult to prevent sample losses from protein and peptide adsorption on the surfaces in the laboratory. To explore the differential protein expression levels between GCF samples taken from the resorbing and the control teeth at higher protein and peptide loads, we pooled the samples within a group. We also used a novel procedure for 2-dimensional peptide fractionation to increase detection sensitivity. Figure 2 shows chromatograms of the pooled control and resorption samples. The 2 separations show similar major peaks, indicating consistency of the digestion procedures and similarity of major proteins and peptide components in the pools of the control and resorption samples. Retention times in Figure 2 represent the identity of separated peptides, and peak heights (absorbance at 214 nm) indicate their quantity. Thus, the pooled control samples exhibit slightly higher peptide contents compared with the pooled root resorption samples.
Fractions from each chromatogram were analyzed individually by LC-MS, followed by protein identification and quantitation. Thus, we were able to create an overview of differential protein expression levels across the 2 samples (resorbing vs nonresorbing). The 2-dimensional LC-MS protocol yielded significant increases of identified proteins: 2789 and 2421 for the control and resorption pooled samples, respectively (log(e) < −3; Table II ). These also exceed the number of previously reported identifications because of our implementation of the second dimension of peptide separation.
For each identified protein, we computed its total ion count signal as the sum of the MS/MS fragment intensities of its member peptides and then converted the value into a log2 scale. Figure 3 , A , shows the correlation between the total ion count intensities of the 2 samples. Similar correlations for 2 identical samples will show a straight diagonal line. In our study, each data point below or above the diagonal indicates upregulation or downregulation of a protein in a pool of resorbing samples. The lone data point in the top right corner of the graph ( Fig 3 , A ) corresponds to the most abundant component of the mixtures—that is, serum albumin.
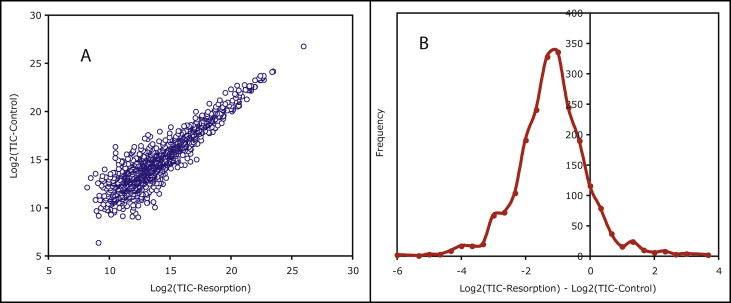
The difference between the log2 (root resorption) and log2 (control) protein total ion count values is mapped to an expression ratio histogram with a centroid of −1.01 (SD, 1.09) as shown in Figure 3 , B . This histogram was then used to map protein-level differences into Z-scores: ie, the distance from the population mean in units of standard deviation.
Within this population, we were able to detect upregulated and downregulated proteins in the root resorption teeth samples. Totals of 37 root resorption proteins with Z-scores greater than 1.65 (upregulated) and 59 root resorption proteins with Z-scores less than −1.65 (downregulated) were identified. About 54% of the common proteins detected in the GCF of resorbing and nonresorbing teeth were identified by ExoCarta, a comprehensive database of proteomic studies of exosomes. Exosomes are released from multiple cell types, contain protein and RNA species, and have been exploited as a novel reservoir for disease biomarker discovery. Tables III and IV show differentially expressed proteins in resorbing teeth and their respective relationships to exosomes.
| Peptides in root resorption (n) | Peptides in controls (n) | Z-score | GI number ∗ | Protein name | Exosome-related protein? (gene symbol) |
|---|---|---|---|---|---|
| 5 | 1 | 3.6358 | gi|21264616 | Epidermal growth factor receptor pathway substrate 8-like protein 2 | Yes (EPS8L2) |
| 2 | 1 | 3.2406 | gi|119703744 | Desmoglein 1 preproprotein | No (DSG1) |
| 3 | 3 | 2.8564 | gi|15100175 | 1-acylglycerol-3-phosphate O-acyltransferase 1 | No (AGPAT1) |
| 2 | 1 | 2.8015 | gi|5730023 | RuvB-like 2 | Yes (RUVBL2) |
| 5 | 2 | 2.7666 | gi|29568099 | p47 protein | No (P47) |
| 5 | 1 | 2.6568 | gi|41327741 | ETHE1 protein | No (ETHE1) |
| 31 | 6 | 2.5995 | gi|4557625 | Glutamate-cysteine ligase (GCL), catalytic subunit | No (GSHA) |
| 2 | 1 | 2.5727 | gi|5174529 | Methionine adenosyltransferase II, alpha | No (MAT2A) |
| 3 | 1 | 2.5041 | gi|41152086 | Serine (or cysteine) proteinase inhibitor, clade B (ovalbumin), member 6 | Yes (SERPINB6) |
| 3 | 3 | 2.4812 | gi|28559088 | Laminin alpha 2 subunit isoform a precursor | No (LAMA2) |
| 3 | 1 | 2.44 | gi|5453722 | Lysophospholipase 1 | No (LYPLA1) |
| 4 | 1 | 2.4355 | gi|5453690 | DnaJ (Hsp40) homolog, subfamily B, member 1 | Yes (DNAJB1) |
| 2 | 1 | 2.4081 | gi|73622130 | BolA-like protein 2 | No (BOLA2) |
| 3 | 1 | 2.3943 | gi|108936950 | Coiled-coil domain containing 25 | No (CCDC25) |
| 6 | 1 | 2.3577 | gi|4503057 | Crystallin, alpha B | Yes (CRYAB) |
| 4 | 3 | 2.3303 | gi|4507951 | Tyrosine 3-monooxygenase/tryptophan 5-monooxygenase activation protein | Yes (YWHAH) |
| 4 | 2 | 2.2983 | gi|4504715 | Poly A binding protein | No (PABP) |
| 2 | 1 | 2.2617 | gi|13378137 | TNFRSF1A-associated via death domain | No (TRADD) |
| 2 | 1 | 2.2525 | gi|221316630 | Coatomer protein complex, subunit beta 1 | Yes (COPB1) |
| 3 | 2 | 2.2205 | gi|41327712 | V-crk sarcoma virus CT10 oncogene homolog isoform a | No (CRK) |
| 5 | 2 | 2.1994 | gi|7705300 | Ubiquitin-fold modifier 1 | No (UFM1) |
| 2 | 1 | 2.1427 | gi|4757960 | Cadherin 1, type 1 preproprotein | Yes (CDH1) |
| 3 | 1 | 2.1198 | gi|192807292 | Keratin 24 | Yes (KRT24) |
| 4 | 3 | 2.065 | gi|106049528 | Pyruvate carboxylase precursor | No (PYC1) |
| 2 | 1 | 2.0238 | gi|169658378 | Trinucleotide repeat containing 18 | No (TNRC18) |
| 2 | 1 | 2.0146 | gi|157653329 | Procollagen C-endopeptidase enhancer | Yes (PCOLCE) |
| 2 | 1 | 1.9689 | gi|15431328 | Caspase 1 isoform | No (CASP1) |
| 18 | 11 | 1.8413 | gi|8659555 | Aconitase 1 | Yes (ACO1) |
| 3 | 2 | 1.8362 | gi|223718702 | Aflatoxin B1 aldehyde reductase 3 isoform 1 | No (AKR7A3) |
| 4 | 2 | 1.8317 | gi|15431290 | Ribosomal protein L11 | Yes (RPL11) |
| 3 | 1 | 1.827 | gi|5902122 | Spectrin, beta, nonerythrocytic 2 | No (SPTBN2) |
| 4 | 3 | 1.7722 | gi|145275213 | Coagulation factor XII | No (F12) |
| 5 | 2 | 1.7602 | gi|205277386 | Glucosamine-fructose-6-phosphate aminotransferase | Yes (GFPT1) |
| 2 | 1 | 1.7036 | gi|221316642 | Nuclear distribution gene E homolog 1 | No (NUDEL1) |
| 4 | 2 | 1.6944 | gi|28570172 | NADP-dependent leukotriene B4 12-hydroxydehydrogenase | No (PTGR1) |
| 13 | 9 | 1.6766 | gi|31377634 | Guanylate binding protein 4 | No (GBP4) |
| 4 | 2 | 1.6578 | gi|21361884 | RAB2B protein | No (RAB2B) |
Stay updated, free dental videos. Join our Telegram channel
VIDEdental - Online dental courses


