Introduction
The principal aim of this study was to investigate differences in perception of soft-tissue facial profiles and dental esthetics between young Chinese adults and orthodontists.
Methods
Eight hundred ninety-two subjects (444 male, 448 female), ages 16 to 24 years, chose 1 image from among 5 profile silhouettes and from among 10 ranked color photographs of the aesthetic component (AC) of the index of orthodontic treatment need that most closely resembled their own profile and dental esthetic appearance, respectively. A panel of 20 orthodontists then independently repeated the same image selection process. Each subject also completed the Eysenck personality questionnaire for psychoticism. We used the Mann-Whitney U test and the Spearman rank correlation test, with statistical significance set at α = 0.05.
Results
Only 37.0% of subjects had straight profiles by objective orthodontic assessment, but 85.0% chose straight profiles by subjective self-perception. About 17.5%, mainly females, chose the mild convex as the ideal profile. Only 2.5% of the subjects were ranked 1 on the AC by orthodontists, but 43.6% chose 1, or ideal, by self-perception. Male subjects scored significantly higher than did female subjects for self-perceived facial profiles (more protruded chins) and for the AC (more attractive dental appearance). Subjects with high psychoticism T scores (>50) scored significantly lower for self-perceived facial profiles (more retruded chins) and on the AC (less attractive dental appearance).
Conclusions
Young Chinese adults perceived their facial profiles and dental appearances to be significantly more straight and attractive, respectively, than did the orthodontists. A significant proportion of the young adults, mainly women, preferred a mild convex facial profile. High psychoticism scores might significantly affect the self-perception of orthodontic treatment needs.
Esthetics is a key motivational reason for patients seeking orthodontic treatment. The perceptions of facial profile and dental esthetics are essentially based on how subjects evaluate themselves. However, people vary in their emotions, thinking, and behavior, and these differences create individualism. Perceptions of esthetics also differ between laypersons and orthodontists. The professional opinions of orthodontists regarding dentofacial esthetics are made more objective by guidelines, norms, and ideal ratios and angles. But the perceptions of laypersons are largely motivated by subjective feelings such as the “beauty culture” in their peer groups and social norms in general. Some studies have found obvious differences in perceptions among groups of laypersons, dental students, and orthodontists.
During postpuberty and early adulthood, young adults are an integral part of orthodontic patients. During the period of transition from adolescence to adulthood, young adults possess the typical age characteristics for their psychological behavior. The most central concept in personality psychology is the trait, which can be used to predict and explain a significant fraction of a subject’s behavior. Eysenck claimed that personality could be described based on 3 fundamental dimensions or traits. Psychoticism, 1 of these traits, subsumed a variety of habitual behaviors: eg, aggressive, egocentric, creative, impulsive, and lacking empathy.
Because patients who receive orthodontic treatment need to gain satisfaction from improving their esthetics, the self-perceptions of young adults are important indicators when deciding to undertake treatment, and this might complement conventional clinical evaluation. Although some authors have concluded that the professional opinions of orthodontists are generally more critical than those of laypersons when assessing dentofacial esthetics, few authors have investigated the self-perceptions of facial profiles and dental esthetics among young adults. Some studies have found that psychological factors do have certain effects on the perception of facial profile and dental esthetics. But few studies have investigated the relationship between the personality traits of young adults and their potential perceptions of facial profiles and dental esthetics.
Therefore, in this study, we aimed to investigate the self-perceptions of facial profiles and dental esthetics among young adults, and to evaluate differences between self-perceptions and orthodontists’ assessments. We also examined whether the sex and personality traits of young adults might affect their esthetic perceptions. The null hypothesis was that in a selected group of young Chinese adults assessing their soft-tissue facial profiles and dental esthetics, there are no significant differences between their self-assessments and those of orthodontists, and that the self-assessments are not significantly affected by personality traits.
Material and methods
Students from 3 Chinese universities attended general health and oral health examinations at the Hospital of Nanjing Army Command College in 2011. Three universities were randomly selected from the 9 universities in the Pukou district in Nanjing, and the university classes were also randomly chosen. A total of 892 subjects gave their approval to participate in the study. Distributions by sex, geographic regions of the high schools attended, and ages are shown in Table I . Students were excluded if they had a history of orthodontic treatment or facial surgery, or a background of stomatology education. The study was approved by the ethics institutional review board of the Hospital of Nanjing Army Command College. All students received written information about the aims and procedures of the research and were told that participation was voluntary.
| Geographic region of the subjects’ high schools (n) | Age (y) | |||||
|---|---|---|---|---|---|---|
| Extra-large and large cities | Medium cities | Small cities and rural areas | Mean (SD) | Minimum | Maximum | |
| Male (444) | 167 | 147 | 130 | 18.74 (1.51) | 16 | 23 |
| Female (448) | 157 | 151 | 140 | 19.03 (1.64) | 16 | 24 |
| Total (892) | 324 | 298 | 270 | 18.81 (1.57) | 16 | 24 |
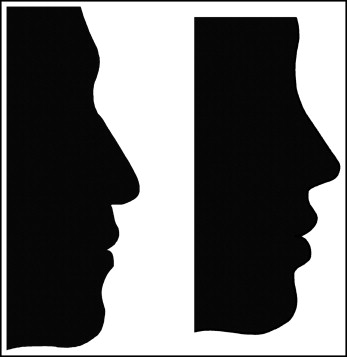
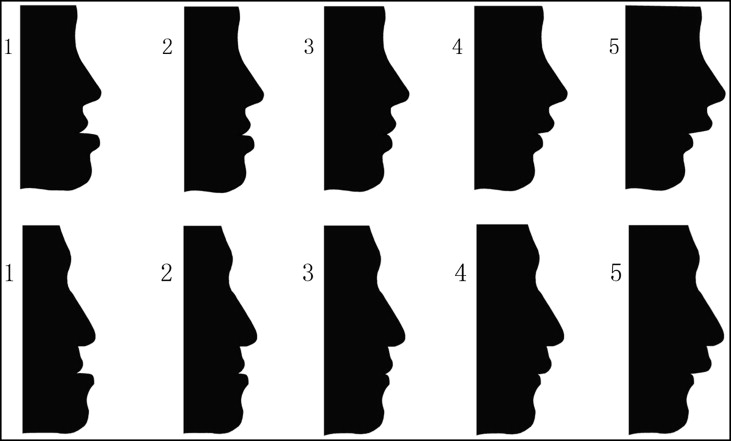
Soft-tissue facial profiles can be assessed by means of standardized silhouettes and photographs. However, to reduce subjectivity, facial silhouettes rather than facial profile photographs were viewed by the subjects when scoring their facial profiles. According to selected landmarks, based on currently accepted criteria of soft-tissue measurements, representative straight-profile silhouettes of male and female subjects ( Fig 1 ) were first drawn using Photoshop (CS 8.0.1; Adobe Systems, San Jose, Calif). A straight profile is generally considered to be the ideal for facial esthetics. Based on 2 straight profile silhouettes for males and females, an additional series of profile silhouettes was then generated by altering the original position of pogonion, which was protruded and then retruded by 6° and 12° from the straight profiles. The changes were artistically modified to maintain soft-tissue continuity and sex distinctions. The manipulated silhouettes formed 2 sets of male and female profile images. The scores for the profiles were the following: 1, severe concave; 2, mild concave; 3, straight; 4, mild convex; and 5, severe convex ( Fig 2 ).
The aesthetic component (AC) of the index of orthodontic treatment need is one dental appearance scale used to measure perceptions of dental esthetics. The AC consists of a scale of 10 color photographs showing different levels of dental attractiveness: 1 represents the most attractive, and 10 the least attractive arrangement of teeth in the AC, where 1 is identified with the ideal for dental esthetics.
Personality trait theorists have developed many questionnaires to assess personality. The Eysenck personality questionnaire, which is highly reliable with strong evidence of validity, is one of the best-known and the most widely used for personality assessment in China. A psychologist (MC.J.) assessed all subjects and then changed the raw scores into standard T scores.
The specially designed questionnaire comprised 4 sections: (1) sociodemographic information, (2) male and female images of facial profiles, (3) the AC, and (4) the Eysenck personality questionnaire. The first section of the questionnaire focused on the subjects’ sociodemographic data: sex, birth date, family income, and level of education. The image-based questionnaire of facial profile had 2 parts: “Select the image that you think has the most attractive facial profile” and “Select the image that you think most closely represents your facial profile.” The subjects were asked to use numbers 1 to 5 to select the images from the relevant profile silhouettes of the sexes. The AC also had 2 parts: “Select the image that you think has the most attractive teeth” and “Select the image that you think most closely represents your teeth.” The subjects were asked to use numbers 1 to 10 to select images from the AC. The Eysenck personality questionnaire was the last section. The subjects were given 20 minutes to complete anonymously the questionnaires, which were marked by numeric codes.
For each subject, we used a digital camera (EOS Rebel-D; Canon, Tokyo, Japan) to obtain 2 photographs of the right facial profile and frontal view of the teeth. The subjects’ photographs were marked with the same numeric codes as the questionnaires.
A professional panel of orthodontists was selected to assess the subjects’ photographs. This panel consisted of 20 orthodontists who practiced in the orthodontic departments at the Affiliated Hospital of Stomatology of Nanjing Medical University and the Hospital of Nanjing Army Command College. Their demographic information is included in Table II . The 2 professors instructed the other orthodontists in the evaluation of the soft-tissue facial profiles and the application of the AC over 2 weeks before this study started. Using the 2 sets of manipulated facial profile silhouettes and the AC, the professional panel scored the subjects’ facial profiles and dental esthetics. The mean scores of the panel were increased or decreased to the nearest whole number before being analyzed.
| n | Age (y) Mean (SD) |
Specialty experience (y) Mean (SD) |
||
|---|---|---|---|---|
| Male | Female | |||
| Professors | 1 | 1 | 46.75 (4.35) | 23.00 (4.69) |
| Associate professors | 1 | 1 | ||
| Associate clinical professors | 3 | 3 | 33.67 (4.50) | 11.83 (4.36) |
| Graduate students | 4 | 6 | 25.4 (1.43) | 3.56 (1.33) |
| Total | 9 | 11 | 32.15 (8.88) | 10.05 (8.15) |
Statistical analysis
All scores were entered into the SPSS statistical software package (version 13.0; SPSS, Chicago, Ill). Data distributions were presented as means and standard deviations and were analyzed using the nonparametric Mann-Whitney U test and the Spearman rank correlation test. The probability level for statistical significance was set at α = 0.05.
The scores for 50 subjects were repeated by the same panel after a 2-week interval. The panel’s kappa scores were 0.92 for the facial profiles and 0.86 for dental esthetics, indicating good agreement.
Results
Table III shows the distribution of the facial profile results, which were significantly different between the subjects and the orthodontists ( P <0.0001). Although the assessments by the orthodontists (37%) and the subjects (85%) favored the straight profile (score 3), these assessments were heavily skewed by the subjects who closely equated their own perceived facial profiles with the perceived ideal facial profile (78.5%). However, a significant proportion (17.5%) of subjects also selected the mild convex profile as ideal.
| Assessment | Profile Silhouettes | AC mean (SD) ∗ | ||||
|---|---|---|---|---|---|---|
| 1 | 2 | 3 | 4 | 5 | ||
| OAP | 46 (5.2%) | 188 (21.1%) | 330 (37.0%) | 254 (28.5%) | 74 (8.3%) | 3.14 (1.00) |
| SAP | 4 (0.4%) | 34 (3.8%) | 758 (85.0%) | 90 (10.1%) | 6 (0.7%) | 3.07 (0.42) |
| χ 2 = 466.5; df = 4; P <0.0001 | ||||||
| SIP | 2 (0.2%) | 18 (2.0%) | 700 (78.5%) | 156 (17.5%) | 16 (1.8%) | 3.19 (0.49) |
Table IV shows the distribution of the AC results, which were also significantly different between the subjects and the orthodontists ( P <0.001). Most of the orthodontists’ assessments were scores 3, 4, and 5 (22.1%, 21.1%, and 23.1%, respectively); this contrasted with the subjects’ own perceived dental esthetic assessments, where most photographic image scores were 1, 2, and 3 (43.6%, 27.5%, and 20.1%, respectively). The subjects’ perceived mean AC score (2.15 ± 1.65) was significantly more favorable than the orthodontists’ mean AC score (4.03 ± 1.64). Not surprisingly, most subjects selected score 1 (88.8%) as the ideal perceived dental appearance, with no scores greater than 4 selected.
| Assessment | Aesthetic Component | AC mean (SD) ∗ | |||||||||
|---|---|---|---|---|---|---|---|---|---|---|---|
| 1 | 2 | 3 | 4 | 5 | 6 | 7 | 8 | 9 | 10 | ||
| OAAC | 22 (2.5%) | 149 (16.7%) | 197 (22.1%) | 188 (21.1%) | 206 (23.1%) | 48 (5.4%) | 52 (5.8%) | 26 (2.9%) | 3 (3%) | 1 (1%) | 4.03 (1.64) |
| SAAC | 389 (43.6%) | 245 (27.5%) | 179 (20.1%) | 31 (3.8%) | 5 (6.0%) | 8 (9.0%) | 8 (9.0%) | 15 (1.7%) | 8 (9%) | 4 (4%) | 2.15 (1.65) |
| χ 2 = 1798; df = 18; P <0.001 | |||||||||||
| SIAC | 792 (88.8%) | 52 (5.8%) | 31 (3.8%) | 17 (1.9%) | 0 | 0 | 0 | 0 | 0 | 0 | 1.20 (0.67) |
Table V shows that there were significant differences between the male and female subjects when comparing the differences in scores between the orthodontists and the subjects. Male subjects had greater differences than did female subjects for their own perceived facial profiles (more protruded chins) and dental esthetics (more attractive), but fewer differences than female subjects for the perceived ideal facial profile and ideal dental appearance. Apart from 1 instance ( P = 0.97), significant differences were also present between the low and high T scores for psychoticism when comparing the differences between the orthodontists and the subjects. (The T scores were <50 for 692 subjects and >50 for 200 subjects.) Subjects with T scores greater than 50 had fewer differences than did those with scores less than 50 for their own perceived facial profiles (less protruded chins) and dental esthetics (less attractive), and also fewer differences than those with scores less than 50 for the perceived ideal facial profile. There were no significant differences between subjects with high and low T scores for their perceived ideal dental esthetics.


