Introduction
The purpose of this study was to determine whether Angle Class II subdivision malocclusions have skeletal or dental asymmetries between the Class II and Class I sides.
Methods
A sample of 54 untreated Angle Class II subdivision patients with pretreatment photos and cone-beam computed tomography (CBCT) scans was used. The photos were used to identify the Class II subdivision malocclusion and to record the amount of crowding per quadrant. Landmarks were plotted on each CBCT volume so that direct 3-dimensional measurements could be made to compare the positions and dimensions of the skeletal and dental structures on the Class II side vs the Class I side.
Results
Significant differences were found for 2 skeletal measurements: the position of the maxilla relative to the cranial base, and the mandibular dimension from the mandibular foramen to the mental foramen. Statistically significant dental differences were found for the position of the mandibular first molars and canines in relation to the maxilla and the mandible. Statistically significant differences were found for the maxillary first molars and canines in relation to the mandible.
Conclusions
There were significant skeletal and dental differences between the Class I and Class II sides. The dental asymmetries accounted for about two thirds of the total asymmetry.
Class II subdivision malocclusions can be extremely challenging for diagnosis and treatment planning because many clinicians have difficulty in identifying the cause of the malocclusion. Since Angle Class II subdivision malocclusions possess characteristics of both Class I and Class II malocclusions, there is asymmetry between the right and left sides of the dentition. This asymmetry often requires asymmetric extractions or mechanics during treatment, which can be very complicated. The etiology of the asymmetry can be quite complex. It could be dental related, skeletal related, or a combination of both.
Any time a dental midline deviation or an asymmetric occlusion is observed, the clinician must check for skeletal asymmetries, dental asymmetries, and functional shifts. Manipulating the patient into centric relation or using an occlusal splint to verify the position of the mandible is an important first step in correctly diagnosing any type of asymmetry.
Previous studies used 2-dimensional radiographs (posteroanterior cephalograms, submentovertex view, and corrected oblique cephalograms) to evaluate Class II subdivisions for dental and skeletal asymmetries between the Class II and Class I sides of the skull and the dentition. These studies showed that the differences between the 2 sides were primarily dentoalveolar. The main factor is the distal positioning of the mandibular first molar on the Class II side with a mandibular dental midline deviation toward the Class II side (type 1). A secondary factor is the mesial positioning of the maxillary first molar on the Class II side with a maxillary dental midline deviation away from the Class II side (type 2). These authors found no statistically significant skeletal differences between the 2 sides, but they mentioned a tendency for mild skeletal asymmetries in Class II subdivisions and recommended further research to investigate these minor asymmetries.
The purpose of this study was to analyze Class II subdivision malocclusions for skeletal and dental asymmetries by using cone-beam computed tomography (CBCT).
Material and methods
In this retrospective study, we evaluated 54 pretreatment records (photos and CBCT volumes) of patients from the Department of Orthodontics of Case Western Reserve University in Cleveland, Ohio. Initial pretreatment photographs of 300 Angle Class II malocclusion patients were examined to search for Class II subdivision malocclusions that met the following criteria: (1) erupted permanent dentition from first molar to first molar in both arches; (2) no missing teeth, excluding third molars; (3) no craniofacial syndromes that would cause severe skeletal asymmetries; (4) one side of the arch with an Angle Class I molar relationship and the other side with at least a half-step Angle Class II molar relationship or greater; and (5) clear pretreatment photographs and CBCT volumes.
Once the patients were identified, the amounts of crowding per quadrant were estimated by the principal investigator (C.M.M.) and recorded so that the role of dental crowding could also be evaluated in the Class II subdivision malocclusions. Two groups were created: a noncrowded group (no crowding or ≤2 mm of crowding in any quadrant), and a crowded group (≥3 mm of crowding in any quadrant). Patients with excess spacing were not included in either group.
The scans were made by using the CBCT unit (Hitachi, Tokyo, Japan) at Case Western Reserve University’s Craniofacial Imaging Center. All images were taken at settings of 2 mA, 120 kV, and 12-in field of view. The CBCT volumes were analyzed and measured by using Dolphin 3D software (version 11.0 premium software; Dolphin Imaging & Management Solutions, Chatsworth, Calif).
Establishing a consistent method of orientation ensured that the coordinate systems would be the same for each image so that the measurements for each subject could be reliably compared. This was done in the Dolphin 3D software by setting the x-, y-, and z-axes on reproducible anatomic landmarks that could be easily identified.
From the right lateral view, the z-axis was set to the Frankfort horizontal, a line passing through the right porion and right orbitale. Then the y-axis was set perpendicular to the z-axis through the middle of the sella turcica by clipping the image from the sagittal view to obtain a clear view of the sella.
From the frontal view, the x-axis was defined by a line passing through the right and left orbitales. From the superior view, the z-axis was constructed by drawing a line from the crista galli through the middle of the sella and perpendicular to the x-axis through the middle of the sella.
By establishing the x-, y-, and z-axes, 3 planes in space were created that intersected at the origin. The origin (0, 0, 0) was located along the midsagittal plane, just below the sella, and at the level of Frankfort horizontal. After the reconstructed model was oriented and the axes and planes were defined, landmarks could be plotted in precise anatomic locations by using sagittal, coronal, and axial slices of the CBCT volume.
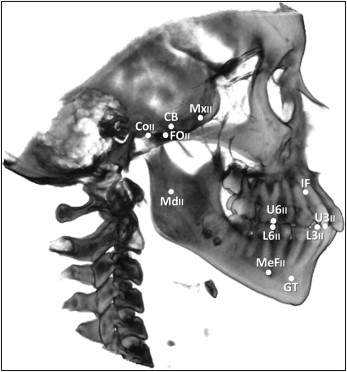
Twenty-one digital landmarks, skeletal and dental, were selected based on ease of identification and reproducibility ( Fig , Table I ). Three midline landmarks—origin, incisive foramen, and genial tubercles—were chosen to represent the middle of the cranial base, the maxilla, and the mandible, respectively. The other 18 landmarks were located on the right and left halves of the skull and dental arches.
| Landmark | Specific name | Generic name | Abbreviation |
|---|---|---|---|
| 1 | Origin (0, 0, 0) | Cranial base | CB |
| 2 | Class II side foramen rotundum | Maxilla II | MxII |
| 3 | Class I side foramen rotundum | Maxilla I | MxI |
| 4 | Class II side mandibular foramen | Mandible II | MdII |
| 5 | Class I side mandibular foramen | Mandible I | MdI |
| 6 | Class II side superior, posterior, lateral condyle | Condyle II | CoII |
| 7 | Class I side superior, posterior, lateral condyle | Condyle I | CoI |
| 8 | Class II side foramen ovale | Foramen ovale II | FOII |
| 9 | Class I side foramen ovale | Foramen ovale I | FOI |
| 10 | Class II side mental foramen | Mental foramen II | MeFII |
| 11 | Class I side mental foramen | Mental foramen I | MeFI |
| 12 | Incisive foramen | Incisive foramen | IF |
| 13 | Midpoint between genial tubercles | Genial tubercles | GT |
| 14 | Class II side mesial buccal cusp tip of upper 6 | Upper 6 II | U6II |
| 15 | Class I side mesial buccal cusp tip of upper 6 | Upper 6 I | U6I |
| 16 | Class II side mesial buccal cusp tip of lower 6 | Lower 6 II | L6II |
| 17 | Class I side mesial buccal cusp tip of lower 6 | Lower 6 I | L6I |
| 18 | Class II side cusp tip of upper 3 | Upper 3 II | U3II |
| 19 | Class I side cusp tip of upper 3 | Upper 3 I | U3I |
| 20 | Class II side cusp tip of lower 3 | Lower 3 II | L3II |
| 21 | Class I side cusp tip of lower 3 | Lower 3 I | L3I |
∗ The subdivision side is the Class II side, and the other side is the Class I side; the right side is always the Class II side in this study, and the left side is always the Class I side; therefore, “Class II side” and “right side” are used interchangeably in the study, as well as “Class I side” and “left side.”
Each landmark was assigned unique coordinates (x, y, z) when it was plotted in the Dolphin 3D software. These coordinates could then be copied and pasted into Excel (Microsoft, Redmond, Wash), with a spreadsheet designed so that the direct measurements in millimeters could be calculated between any 2 landmarks by using the distance formula. In 3-dimensional space, the distance between points (x 1 , y 1 , z 1 and x 2 , y 2 , z 2 ) is determined with this equation:
Measurements were also made in the Class II side of the maxilla and the mandible that were compared with the measurements in the Class I side of the maxilla and the mandible ( Table II ). These measurements were evaluated to determine whether there were any Class II side vs Class I side differences in the following.
- 1.
The positions of the maxilla or the mandible in relation to the cranial base (rotation of the maxilla or the mandible, when one side is ahead of or behind the other side).
- 2.
The positions of the maxilla and the mandible in relation to each other (intermaxillary measurement).
- 3.
Intramaxillary dimensions (one side larger or smaller than the other).
- 4.
Intramandibular dimensions.
- 5.
The intra-arch positions of the molars and canines relative to the maxilla (mesial or distal position of the teeth in the arch on 1 side).
- 6.
The intra-arch positions of the molars and canines relative to the mandible.
| Measurement pair | Mean | SD | Method error | |
|---|---|---|---|---|
| 1 | CB to MxII | 24.601 | 1.683 | 0.418 |
| CB to MxI | 24.219 | 1.965 | 0.723 | |
| 2 | CB to MdII | 52.531 | 3.038 | 0.741 |
| CB to MdI | 52.185 | 3.206 | 0.439 | |
| 3 | MxII to MdII | 46.004 | 3.857 | 0.694 |
| MxI to MdI | 45.855 | 3.668 | 0.427 | |
| 4 | MxII to IF | 61.726 | 4.625 | 0.852 |
| MxI to IF | 61.867 | 4.680 | 0.927 | |
| 5 | MdII to MeFII | 58.947 | 4.183 | 0.751 |
| MdI to MeFI | 59.569 | 3.925 | 1.097 | |
| 6 | MdII to GT | 72.259 | 4.321 | 0.737 |
| MdI to GT | 72.701 | 3.996 | 0.886 | |
| 7 | FOII to MdII | 33.238 | 3.726 | 0.687 |
| FOI to MdI | 33.024 | 3.413 | 0.613 | |
| 8 | CoII to MdII | 35.252 | 3.469 | 0.747 |
| CoI to MdI | 35.380 | 3.329 | 0.845 | |
| 9 | MxII to U6II | 55.265 | 5.066 | 0.366 |
| MxII to L6II | 55.585 | 5.252 | 0.352 | |
| 10 | MxII to U3II | 69.199 | 5.487 | 0.409 |
| MxII to L3II | 67.099 | 5.859 | 0.379 | |
| 11 | MxI to U6I | 54.767 | 5.052 | 0.542 |
| MxI to L6I | 56.616 | 5.330 | 0.434 | |
| 12 | MxI to U3I | 68.858 | 5.367 | 0.533 |
| MxI to L3I | 68.428 | 5.864 | 0.548 | |
| 13 | MdII to U6II | 45.083 | 3.640 | 0.776 |
| MdII to L6II | 44.435 | 3.689 | 0.794 | |
| 14 | MdII to U3II | 66.632 | 4.521 | 0.783 |
| MdII to L3II | 65.347 | 4.348 | 0.829 | |
| 15 | MdI to U6I | 43.141 | 3.233 | 0.713 |
| MdI to L6I | 45.714 | 3.409 | 0.647 | |
| 16 | MdI to U3I | 64.861 | 3.746 | 0.587 |
| MdI to L3I | 66.729 | 3.969 | 0.688 | |
∗ Each measurement for the Class II side is paired with its counterpart from the Class I side to give 16 measurement pairs and 32 measurements and variables; all measurements are in millimeters.
Each measurement was a straight-line distance between the 2 points.
Fifteen of the 54 subjects were randomly selected, and the CBCT orientations, landmark identifications, and measurements were repeated by the same examiner (C.M.M.) to test for reliability.
The method error ( ME ), or casual error, was calculated by using Dahlberg’s formula : ME=√(∑d2/2n),
ME = √ ( ∑ d 2 / 2 n ) ,
with d as the difference between the original and repeated measurements and n as 15 for the sample size that was repeated.
The method error tests for the reproducibility of each measurement and provides an estimate of the standard deviation around the mean of each measurement.
Statistical analysis
The null hypothesis was that no significant difference would exist between the Class II and Class I sides for the skeletal and dental measurements of Class II subdivision malocclusions. A second hypothesis was that there would be no significant difference in skeletal or dental measurements between the 2 sides when Class II subdivision malocclusions were separated into a noncrowded group with minimal or no dental crowding and a crowded group with moderate to severe dental crowding.
To test these hypotheses, descriptive statistics (means and standard deviations) were calculated for all 32 variables. Paired-samples correlations were used to determine whether there were relationships between the variables on the Class II side and the Class I side. Paired-samples t tests were run to evaluate any significant differences between the corresponding variables of the Class II and Class I sides. The alpha value was set at 0.05 for this study.
Statistical analyses were run by using SPSS software (version 15.0; SPSS, Chicago, Ill).
Stay updated, free dental videos. Join our Telegram channel
VIDEdental - Online dental courses


