Introduction
Gray level is the range of shades of gray in the pixels, representing the x-ray attenuation coefficient that allows for tissue density assessments in computed tomography (CT). An in-vitro study was performed to investigate the relationship between computed gray levels in 3 cone-beam CT (CBCT) scanners and 1 multislice spiral CT device using 5 software programs.
Methods
Six materials (air, water, wax, acrylic, plaster, and gutta-percha) were scanned with the CBCT and CT scanners, and the computed gray levels for each material at predetermined points were measured with OsiriX Medical Imaging software (Geneva, Switzerland), OnDemand3D (CyberMed International, Seoul, Korea), E-Film (Merge Healthcare, Milwaukee, Wis), Dolphin Imaging (Dolphin Imaging & Management Solutions, Chatsworth, Calif), and InVivo Dental Software (Anatomage, San Jose, Calif). The repeatability of these measurements was calculated with intraclass correlation coefficients, and the gray levels were averaged to represent each material. Repeated analysis of variance tests were used to assess the differences in gray levels among scanners and materials.
Results
There were no differences in mean gray levels with the different software programs. There were significant differences in gray levels between scanners for each material evaluated ( P <0.001).
Conclusions
The software programs were reliable and had no influence on the CT and CBCT gray level measurements. However, the gray levels might have discrepancies when different CT and CBCT scanners are used. Therefore, caution is essential when interpreting or evaluating CBCT images because of the significant differences in gray levels between different CBCT scanners, and between CBCT and CT values.
Cone-beam computed tomography (CBCT) was developed in the 1990s as an evolutionary process resulting from the demand for 3-dimensional (3D) information obtained by conventional computed tomography (CT) scans. A number of diagnostic tasks unique to dentistry are driving this development. Planning implant placements to replace teeth, securing dentures, and anchoring orthodontic appliances are frequent applications for 3D investigations of the jaws. Also, upper airway analysis, and orthodontic and orthognathic surgical planning for patients with significant facial asymmetry has been increasingly performed based on 3D volumes. CBCT has also been used to study the changes of the maxillary dentoskeletal complex with rapid palatal expansion. CBCT technology for dentistry has some advantages over medical CT, such as lower cost and radiation dose, shorter acquisition time, better resolution, and greater detail.
The CT images are stored using digital imaging and communications in medicine (DICOM), a revolutionary standard medical-image file format developed by the American College of Radiology and the National Electrical Manufacturers Association to facilitate interoperability and communication among different medical imaging devices. It was adopted in 1993 and became widely used in health care messaging over the world. A DICOM record consists of a DICOMDIR file, which includes patient information, specific data on image acquisition, a list of images that correspond to the axial slices forming the 3D image, and a number of sequentially coded images that correspond to the axial slices. When those axial slices are combined in the correct order, they form the 3D image. The CBCT manufacturers provide software to generate DICOM files of the examinations, but there is also a wide range of software packages and applications available, even freeware, dedicated to managing and analyzing DICOM images, working on them, and exporting sections of images in other formats. Therefore, those images can be used for various measurements.
Each slice of the CT image is composed of pixels, each of which has a number expressing the tissue density, referring to the CT number, pixel value, Hounsfield units, or gray levels. These numbers are related to the linear attenuation coefficients (μ) of the tissues that make up the slice and can be calculated as follows:
where μ t is the attenuation coefficient of the measured tissue, μ w is the attenuation coefficient of water, and K is a manufacturer’s scaling factor or contrast factor; in general, K = 1000. On most CT scanners, the CT numbers range from –1000 for air to +1000 for bone, with the CT number for water set at 0. In the Hounsfield scale, it is considered that water has a neutral density in the CT image (value, 0). Thus, higher-density tissues are decoded by the scanner with a positive number, and they are called hyper-dense, whereas tissues with lower density than water receive a negative number, and they are called hypo-dense. The CT numbers are converted into shades of gray (gray scale), with higher numbers assigned a white color, and lower numbers are shades of gray between black and white. This assignment is related to the attenuation characteristics of the tissues. Bone attenuates more radiation and therefore is assigned white, whereas air attenuates little radiation and appears black (the same appearance as on an x-ray film screen image).
Currently, understanding of gray levels is essential for dentists, especially for orthodontists and oral surgeons. Thresholding of gray levels is the basis of the segmentation process and the construction of 3D virtual surface models. Both are used for 3D diagnosis in orthodontics and maxillofacial surgery. Some of these applications are for orthognathic surgical planning, impacted tooth assessment, 3D cranial base superimposition for treatment evaluation, and upper airway analysis. Additionally, gray levels can be used for cortical bone density assessment for dental implants, bone graft evaluations, pathologic lesion diagnosis, and differentiation.
Several authors have reported the use of CBCT intensity values (gray levels) as a measurement of reference for bone density assessment with CBCT imaging, analogous to the Hounsfield units obtained with conventional multislice CT. However, scattering and image artifacts produced by CBCT scanners are much higher; consequently, the accuracy of CBCT gray levels can be affected. For CT systems, there is a standard scheme for scaling the reconstructed attenuation coefficients that are the basis of gray levels or Hounsfield units. To date, the manufacturers of dental CBCT systems have not used a standard system for scaling the gray levels representing the reconstructed values. A system of linear regression equations to derive Hounsfield units from CBCT computed gray levels has been presented for 7 tissues and 11 CBCTs. In the method of Mah et al, there are some limitations when it is applied to clinical practice because of the phantom’s size in relation to the field of view. They concluded that it is difficult to interpret the gray levels or to compare the values resulting from different machines. Therefore, the use of gray levels for scaling in CBCT as a measurement of bone density remains controversial. Other in-vitro studies have investigated the correlation between gray levels obtained from CBCT and CT scanners. According to Nomura et al, the gray levels from CBCT were different from those of multislice CT. Chindasombatjaroen et al found that pixel values in CBCT were considerably lower than those in medical CT, when comparing the same material and imaging parameters. However, they explained that linear functions can be used to convert a pixel value from a CBCT scanner to CT values.
The objectives of this study were to evaluate 5 software programs dedicated to managing and analyzing DICOM images and to compare the gray levels of different CBCT and CT devices using phantom scans. Two primary null hypotheses were tested: (1) there are no differences in gray level assessments among different software programs, and (2) there are no differences in gray levels produced by CBCT and CT scanners.
Material and methods
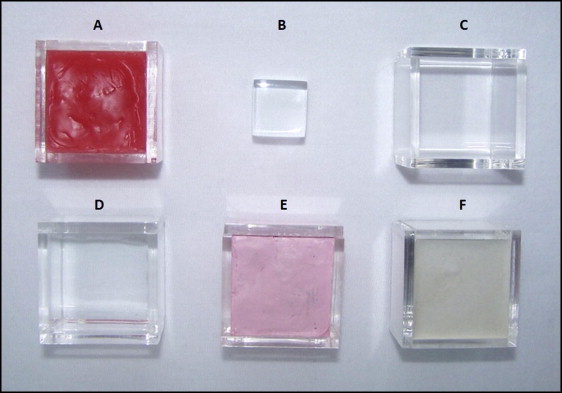
For this study, acrylic polymethyl methacrylate phantoms shaped as empty cubes of 3 × 3 × 3 cm 3 , were filled with the following materials: gutta-percha (Odahcam, Dentsply/Maillefer, Rio de Janeiro, Brazil), dental stone plaster (Herodent, Vigodent Industries, Rio de Janeiro, Brazil), dental wax (NewWax, Technew Industries, Rio de Janeiro, Brazil), distilled water (Encomaster, Porto Alegre, Brazil), and air (not filled). A solid acrylic specimen of 1.8 × 1.8 × 1.8 cm 3 was also used in this study ( Fig 1 ), and the upper face of this cube was used as a reference for standardization of the axial slice chosen to make the gray level measurements.
The specimens were scanned in 4 scanners: a helical CT and 3 CBCT scanners as described in Table I .
| Scanners | Imaging settings | Specimen scanning |
|---|---|---|
| Siemens Dual Slice Helical CT (Siemens Medical Solutions, Malvern, Pa) | 130 kVp, 180 mAs, 1.25-mm slice thickness with 1.25 mm of interval and 21 × 9 cm of FOV size | Six specimens were scanned at the same time. |
| i-CAT CBCT (Imaging Sciences International, Hatfield, Pa) | 120 kVp, 320 mAs, 0.3-mm voxel dimension, and 16 × 13 cm of FOV size | Five specimens were scanned at the same time. The gutta-percha cube was scanned separately with the solid acrylic cube, since there was no space for all specimens in the FOV. |
| Sirona Galileos CBCT (Sirona Dental Systems, Bensheim, Germany) | 85 kVp, 35 mAs, 0.3-mm voxel dimension, and 15 × 15 cm of FOV size | Six specimens were scanned at the same time. |
| Kodak 9000 3D CT (Carestream Health, Rochester, NY) | 85 kVp, 43.2 mAs, 0.076 mm of voxel dimension, and 4 × 5 cm of FOV size | Due to the small FOV, the specimens were scanned in pairs including the acrylic cube in all scans. |
The following software programs specifically designed for visualization, analysis, and manipulation of DICOM images were selected: OsiriX Medical Imaging Software (Geneva, Switzerland), OnDemand3D (CyberMed International, Seoul, Korea), E-Film (Merge Healthcare, Milwaukee, Wis), Dolphin Imaging (Dolphin Imaging & Management Solutions, Chatsworth, Calif), and InVivo Dental Software (Anatomage, San Jose, Calif).
As explained previously, the upper face of the solid acrylic cube was used to determine the slice where the specimens were measured.
Using the software program tools, diagonal, horizontal, and vertical reference lines were drawn to locate the following points: central, upper, right, lower, and left ( Fig 2 ).
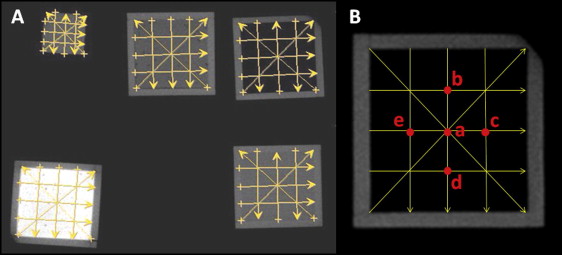
From the helical CT and CBCT axial images of the 6 phantoms, 10 measurements were made at each point with each of the 5 software programs to obtain an average gray level. To assess the homogeneity of the gray levels for each material (inside each square), 5 points were measured ( Fig 2 , B ).
Statistical analysis
A calibrated operator (F.A.) measured the 5 predetermined points of each material (4 corners and center) 10 times ( Fig 2 ). Each measurement was assessed again 2 weeks later with the InVivo Dental Software program. The intrarater repeatability of these measurements was calculated with intraclass correlation coefficients (ICCs). The 5 gray level measurements ( a – e in Fig 2 ) were averaged to represent each material. These data passed the normality test (Shapiro-Wilks). We used repeated analysis of variance (ANOVA) tests with 2 factors (material and scanner), and the interaction term material*scanner to assess differences in gray levels between the scanners and the materials. Because of the significant interaction of material*scanner, we studied each material separately and looked for differences in gray levels between the scanners for each material with a repeated ANOVA test for each material. For each repeated ANOVA test, the Mauchly test of sphericity was performed, and the assumption of sphericity was tested. If the test of sphericity failed, the Greenhouse-Geisser correction was used to complement the ANOVA test. Additionally, post-hoc tests with the Bonferroni adjustment were used to compare the mean gray levels for each pair of imaging scanners. The statistical software used was SPSS for Windows (version 12.0; SPSS, Chicago, Ill), with a significance level of 0.05.
Stay updated, free dental videos. Join our Telegram channel
VIDEdental - Online dental courses


