Introduction
The purpose of this research was to examine methods for assessing the shape and growth of the mandible 3 dimensionally. Furthermore, 1 method was defined and applied.
Methods
Thirty mandibles were assessed. An average or mean shape was determined, and the mandibles were ranked quantitatively, by using the root mean square (RMS), according to their variation from the mean. The rankings ranged from mandibles that were small, short, and narrow at the minus-RMS end, to large, tall, and broad at the plus-RMS end. A second analysis provided a method to superimpose a mandible over the average mandible and determine the differences from the average-derived mandible by using a spectrum of colors to indicate changes in a region.
Results
Variations in the mandible were greatest in the condylar heads, coronoid tips, canine-incisor dentoalveolar segment, and chin point.
Conclusions
The visual images of the 30 segmented mandibles suggest that a new method of classification needs to be developed that extends the original 2-dimensional lateral evaluation to a total 3-dimensional view that provides new relationships, such as the direction of the condylar heads to the ramus and the ratio of the intergonial angle length to the intercondylar head length to define the narrowness of a mandible.
Full-head x-rays are an effective diagnostic tool in orthodontics that has been refined over time through studies that provide a 2-dimensional analysis of how the craniofacial system develops, and how orthodontic treatment affects growth and dentition. The next major change in diagnostic imaging was the development of low-radiation imaging, rapid-scanning cone-beam computed tomography (CBCT), which provides radiographic images that include undistorted panoramic and cephalometric lateral head views and volumetric data in 3 dimensions. The craniofacial skeleton, temporomandibular joints, airway, facial soft-tissue surfaces, and intraosseous defects can be evaluated as 3-dimensional (3D) data. Three-dimensional analysis of volumetric data sets has progressed in some excellent studies with conventional computed tomography (CT), magnetic resonance imaging, and CBCT.
Analysis of the mandible to define its direction and rate of growth depends not only on 3D volumetric analysis, but also on understanding concepts originally derived from using intraosseous metal implants that provided a method to show the complex changes in endochrondrial and surface modifications. Ideally, computer programs should provide methods to superimpose entire volumetric images, but these programs do not yet exist, requiring clinicians to define landmarks that allow superimposition. Landmarks do not give information of the actual shape, curves, and surfaces among them, but do provide a method to superimpose volumetric data so that the resulting surfaces, shapes, and curves are evident. Unfortunately, at present, the techniques for superimposition on landmarks have inherent problems in identifying the most stable landmarks with the least variation during maturation and providing landmarks that investigators and clinicians can identify with the least amount of error. In addition, advanced and sophisticated techniques for following growth and changes in a 3D object such as the mandible are continually being developed and refined to account for limitations in analysis of 3D volumes in which size and shape change.
In this study, we defined a method for evaluating the mandible; we understand that multiple steps in the protocol have inherent weaknesses, but the approach provides a perspective in 3D analysis of the mandible as it is compared among subjects (ie, different vertical facial dimensions) and in the same subject during growth.
Material and methods
CBCT data sets acquired from 30 patients were used in this study. Some subjects with pathologic conditions were included, including 4 who were being evaluated for temporomandibular disorder, 1 with a pneumocoele of the maxillary right antrum, and 1 with an odontogenic cyst surrounding an impacted mandibular third molar. Subjects with developmental conditions such as impacted teeth and orofacial clefts were also permitted ( Table I ). Selection to homogenize the sample with respect to age, sex, and ethnicity was not specifically performed. The sample included 13 men and 17 women with an average age of 22 years 8months±12 years 1month (median, 19 years 2month). The age was not recorded in the database for 1 patient, who was estimated to be 25 years 0months at the scan. Most subjects were white (n = 17), followed by Asians (n = 6), Hispanics (n = 5), and blacks (n = 2). The most common reasons for referral for the CBCT scan were impacted teeth (10 subjects) and evaluations of the temporomandibular joints for disorders (8 subjects).
| Subject | Scan | Age at scan | Sex | Ethnicity | Reason for scan |
|---|---|---|---|---|---|
| A1001A | CBM | 17 y 5 mo | M | Hispanic | Multiple impactions |
| A1002C | CBM | 16 y 2 mo | F | Black | Impaction |
| A1003D | CBM | 13 y 5 mo | M | White | Impaction |
| A1004E | CBM | 27 y 3 mo | F | Hispanic | TMD evaluation |
| A1005G | CBM | 10 y 8 mo | F | White | Dental transposition, ectopy |
| A1006K | CBM | 10 y 9 mo | F | Korean | Impactions |
| A1007O | NT | 13 y 7 mo | F | White | TMJ evaluation |
| B1008K | CBM | 9 y 7 mo | M | White | Maxillary cleft |
| C1010C | CBM | 46 y 8 mo | F | White | TMD evaluation |
| C1009C2 | CBM | 14 y 9 mo | M | White | Impaction |
| C1011K2 | CBM | 20 y 7 mo | F | White | Presurgical evaluation |
| C1012S | CBM | 27 y 5 mo | M | White | TMJ evaluation |
| E1013R | CBM | 30y 10 mo | M | Korean | Maxillary sinus evaluation |
| F1014U | CBM | 25 y, 0 mo? | F | Middle eastern | test scan |
| H1015I2 | CBM | 23 y 11 mo | M | Japanese | Mandibular asymmetry |
| K1016M | nt | 14 y 10 mo | F | White | Scan mandible |
| J1017T | CBM | 28 y 1 mo | F | White | Impaction |
| K1018C | CBM | 24 y 8 mo | M | chinese | TMD evaluation |
| K1019G | CBM | 11 y 2 mo | F | Hispanic | Impaction |
| L1020J | CBM | 28 y 10 mo | M | White | test scan |
| M1021B | CBM | 17 y 6 mo | F | Hispanic | TMD evaluation |
| M1022C | CBM | 17 y 10 mo | M | chinese | impacted canine, maxillary cleft |
| M1023L | CBM | 45 y 2 mo | F | Malaysian | TMJ evaluation |
| M1024W | CBM | 12 y 11 mo | F | White | TMJ evaluation |
| P1025G | CBM | 25 y 8 mo | F | White | cervical spine evaluation |
| P1026Y | CBM | 15 y 1 mo | M | Hispanic | impacted canine, presurgical |
| S1027E | nt | 6 y 3 mo | M | White | Impactions |
| T1028P | nt | 20 y 10 mo | F | White | Scan mandible |
| T1029S | CBM | 51 y 8 mo | M | Black | Odontogenic cyst, impaction |
| W1030U | CBM | 50 y 3 mo | F | White | test scan |
CBCT data from 2 systems were used. Initially, imaging data were acquired from the NewTom QR DVT 9000 (Aperio, Sarasota, Fla). This was later followed by the CB MercuRay (Hitachi Medico Technology, Tokyo, Japan). For inclusion in this study, scans had to include completely the portion of the maxilla at and below the nasal floor (anterior nasal spine-posterior nasal spine level), the entire mandible, and the upper airway at least as superiorly as the inferior turbinate and as inferiorly as the epiglottis. CBCT data from each subject were segmented by using CBWorks software (version1.0, CyberMed, Seoul, Korea) to provide shaded surface meshes representing the 3D structure of each subject’s mandible. In the process, information regarding the subject’s identity was removed.
For our studies, segmentation was achieved first by selecting a volume of interest as close to the structure of interest as possible. Then, the object was threshold-segmented and slice-edited by hand to remove any visible extraneous scatter, artifacts, or background, similar to the method of Meehan et al. For areas with widely different threshold ranges because of regional differences in bone density—eg, the body and ramus of the mandible vs the mandibular condylar head—each region was segmented separately. Then threshold settings were removed, and the 2 data sets were added together by using a Boolean operations module. After segmentation, the resulting set of voxels, or “point cloud,” was transformed by the software into a 3D surface composed of a tetrahedral mesh with vertices or nodes related to voxel positions. For this project, surface quality was set at high, the critical surface angle was left at the default of 120°, and unconstrained smoothing was used.
CBCT data from each subject were segmented with CBWorks software to provide shaded surface meshes representing the 3D structure of each subject’s mandible. A combination of threshold segmentation and manual slice editing was used to obtain refined surfaces with few artifacts. The segmentation process involved using the sculpt tool of CBWorks to narrow the scan into a volume of interest including only the structure that was to be segmented. Threshold segmentation tools were used to isolate the osseous structures. For the mandible, the condyles (neck and head) were segmented separately from the rest of the jaw, because of differences in bone density and attenuation coefficient values of these regions. Boolean operations were then used to combine several data sets of regions of vastly different x-ray attenuation coefficients. Manual slice editing was performed on these data sets to remove most scatter and other noise artifacts, as well as to fill in unanatomic pseudo-foramen artifacts that can appear in thin or cancellous bone, such as in the condylar head and posterior palate. After segmentation, the resulting set of masks (highlighted areas representing each structure of interest in each slice of the CBCT scan) was rendered into a shaded surface mesh in the CBWorks surface shaded display tool ( Fig 1 ). The 30 resulting surface meshes were exported from CBWorks in a virtual reality modeling language (.vrl) format into Amira software (version 3.1, Mercury Computer Systems, Berlin, Germany) for further analysis.
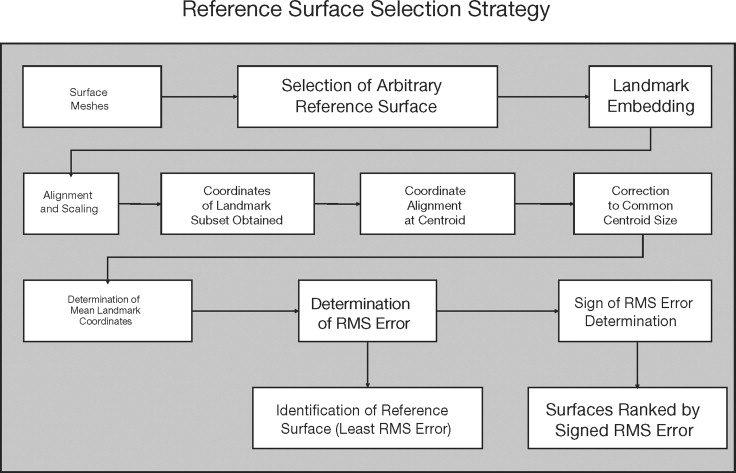
A set of 39 landmarks was embedded in each mandible with the Amira landmark tool ( Table II ). Landmarks were embedded pairwise in the arbitrary reference and in each structure. The Amira landmark surface warp tool was set in a rigid transformation method to align the surfaces based on the embedded landmarks. Individual surfaces were then enlarged or compressed uniformly in x-, y-, and z- dimensions by hand with the Amira transform editor dialog to scale each surface to the same size as the arbitrary reference surface. Once the surfaces were aligned and scaled, a subset of landmarks was used to identify, mathematically, the “most average” surface of the 30 mandibles, and to rank the remaining surfaces relative to it. Because the objects now had similar alignment and size, the remaining differences in the surfaces were related to differences in shape. For the mandible, the x-, y-, and z-coordinates of 7 landmarks (menton, and left and right gonion, condylion, and tips of the coronoid processes) were determined by using the query mode of the Amira landmarks tool, and the rectangular coordinate values were also established.
| Landmark | Description | Bilateral point |
|---|---|---|
| L1 | Most incisal portion of the contact area of the mandibular central incisors, centered labiolingually | No |
| Id | Infradentale, highest point on the alveolar crest at the midline between the mandibular central incisors | No |
| B | B point, greatest concavity on the mandibular midline | No |
| Pg | Pogonion, greatest midline convexity on the anterior border of the mental symphysis | No |
| Gn | Gnathion, midline point on the anteroinferior border of the mental symphysis, centered between menton and pogonion | No |
| Me | Menton, most inferior point on the mental symphysis centered anteroposteriorly | No |
| L3 | CUSP tip of the mandibular canine | Yes |
| Mti | Distobuccal cusp tip of the most terminal erupted mandibular molar | Yes |
| MMi | Crest of alveolar bone centered mediolaterally at the distal aspect of the most terminal erupted mandibular molar | Yes |
| Mf | Mental foramen | Yes |
| R4 | Greatest concavity centered mediolaterally on the antegonial notch | Yes |
| Go | Gonion, greatest convexity of the angular process centered mediolaterally | Yes |
| R2 | Greatest concavity centered mediolaterally on the posterior border of the ascending ramus | Yes |
| Co | Condylion, most superior point on the mandibular condylar head centered mediolaterally and anteroposteriorly | Yes |
| R3 | Most inferior point centered mediolaterally on the sigmoid notch | Yes |
| Cor | Tip of the coronoid process | Yes |
| R1 | Greatest concavity centered mediolaterally on the anterior border of the ascending ramus | Yes |
| Lat ConPol | Lateral condylar pole, most lateral point centered anteroposteriorly and superioinferiorly on the mandibular condyle | Yes |
| MEDCONPOL | Medial condylar pole, most medial point centered anteroposteriorly and superioinferiorly on the mandibular condyle | Yes |
| LATCONNECK | Lateral condylar neck, greatest concavity centered anteroposteriorly and superioinferiorly on the lateral aspect of the condylar process of the mandible | Yes |
| MEDCONNECK | Medial condylar neck, greatest concavity centered anteroposteriorly and superioinferiorly on the medial aspect of the condylar process of the mandible | Yes |
| MnFor | Mandibular foramen at the base of the lingula | Yes |
| Gentub | Greatest convexity at the center of the genial tubercle | No |
Stay updated, free dental videos. Join our Telegram channel
VIDEdental - Online dental courses


