Introduction
The objectives of this prospective clinical study were to evaluate the quality of treatment outcomes achieved with a complex orthodontic finishing protocol involving serpentine wires and a tooth positioner, and to compare it with the outcomes of a standard finishing protocol involving archwire bends used to detail the occlusion near the end of active treatment.
Methods
The complex finishing protocol sample consisted of 34 consecutively treated patients; 1 week before debonding, their molar bands were removed, and serpentine wires were placed; this was followed by active wear of a tooth positioner for up to 1 month after debonding. The standard finishing protocol group consisted of 34 patients; their dental arches were detailed with archwire bends and vertical elastics. The objective grading system of the American Board of Orthodontics was used to quantify the quality of the finish at each time point. The Wilcoxon signed rank test was used to compare changes in the complex finishing protocol; the Mann-Whitney U test was used to compare changes between groups.
Results
The complex finishing protocol group experienced a clinically significant improvement in objective grading system scores after treatment with the positioner. Mild improvement in posterior space closure was noted after molar band removal, but no improvement in the occlusion was observed after placement of the serpentine wires. Patients managed with the complex finishing protocol also had a lower objective grading system score (14.7) at the end of active treatment than did patients undergoing the standard finishing protocol (23.0).
Conclusions
Tooth positioners caused a clinically significant improvement in interocclusal contacts, interproximal contacts, and net objective grading system score; mild improvement in posterior band space was noted after molar band removal 1 week before debond.
Orthodontic treatment generally is divided into 3 phases: initial leveling and alignment, anteroposterior correction, and detailing and finishing. Both simple and complex protocols exist for detailing and finishing before and after fixed appliance removal. Some examples of finishing protocols include removing archwires and placing serpentine wires, placing finishing bends directly in the archwire, and even sectioning and removing part of the archwire.
Tooth positioners, first described by Kesling, are used by many orthodontists as a finishing and retention device. Actively biting or “exercising” with a positioner in place helps guide teeth into their final occlusion, increasing total tooth contacts. In a series of prospective studies, however, no statistically significant increase was found in tooth contacts for positioner patients compared with Hawley retainer patients 3 months into retention.
Several methods of measuring tooth contacts have been implemented, with varied success. One such method is the T-Scan, the data from which have been shown to be reproduced poorly. Other methods include a variety of techniques for analyzing polyether or silicone-based occlusal registrations. Advances in optical scanning technology now allow scanning study models and other bite registrations, facilitating measurement of both tooth contacts and the interocclusal spaces between teeth with accuracy.
Beyond the assessment of occlusal contacts, the overall quality of orthodontic results can be evaluated with the peer assessment rating, the index of complexity, outcome and need, and the objective grading system (OGS) developed by the American Board of Orthodontics. Although all are suitable methods for evaluating the quality of the results, the OGS was chosen for this study because it can measure the small occlusal changes between stages of finishing.
Whereas detailed finishing protocol procedures have been used for over 50 years, it appears that these methods are shrouded by a lack of evidence or have contradictory evidence. This prospective clinical study was designed to quantify the changes to be expected from 2 finishing protocols, allowing the clinician to make more informed decisions concerning the final phases of fixed appliance treatment.
Material and methods
The patients participating in this prospective controlled study were divided into 2 treatment groups. The complex finishing protocol group was composed of consecutively finished patients who received serpentine wires 1 week before debond and a tooth positioner at debond, which was to be worn actively for 2 to 4 weeks. The standard finishing protocol patients were treated with finishing bends in the archwires and then given Hawley retainers at debond.
Consecutive patients meeting the inclusion criteria were selected from a faculty private practice in Ann Arbor, Michigan (complex finishing protocol), and the Graduate Orthodontic Clinic at the University of Michigan (standard finishing protocol). To control for potential discrepancies in case complexity between the standard finishing protocol and the complex finishing protocol, a discrepancy index score was calculated on the initial treatment models for each group at the end of patient enrollment. Statistical tests were performed to ensure that the samples were similar at the beginning of treatment. Inclusion criteria for this study required all participants to be treated to as near an ideal finish as possible (ie, no early debonds), to give verbal consent that the patient adhered to the prescribed protocol, and to be subjected prospectively to a complete set of serial study models.
Thirty-five consecutively finished patients meeting these inclusion criteria comprised each of the 2 finishing protocols. Of these, 1 dropped out of each sample because they transferred to an out-of-area practice during treatment. The number of patients to be enrolled in each finishing protocol group was determined with a preliminary analysis of the power of the study. The power resulted to be greater than 0.90 at an α of 0.05, with a sample size exceeding 30 patients in each group.
Although the patients were asked to record their approximate amounts of positioner wear, none was excluded from the study for poor compliance. These criteria were used to allow the sample to represent a normal pool of orthodontic patients. The serial study models for the complex finishing protocol included initial models (T0), before the serpentine wires (T1), at debond (T2), and after the positioner (T3). The serial study models for the standard finishing protocol included initial models (T0) and at debond (T3).
The demographic data of the 2 groups are reported in Table I .
| Group | Age at T0 (y) | Age at T3 (y) | Difference, T3-T0 (y) | |||
|---|---|---|---|---|---|---|
| Mean | SD | Mean | SD | Mean | SD | |
| CFP (20 girls, 14 boys) | 12.8 | 1.2 | 15.1 | 1.1 | 2.3 | 0.6 |
| SFP (16 girls, 18 boys) | 12.7 | 1.8 | 15.3 | 1.6 | 2.6 | 0.7 |
The complex finishing protocol had the following procedure. The first phase consisted of 2 parts: molar band removal and placement of the serpentine wires. The removal of all molar bands and a transpalatal arch if present was to allow for spontaneous closure of the posterior band space during the week before debonding. Serpentine wires ( Fig 1 ) were used to ligate the teeth together, with the assumption that subtle vertical settling of the occlusion would occur without the archwires in place.
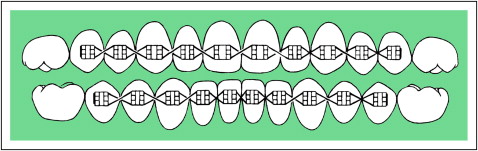
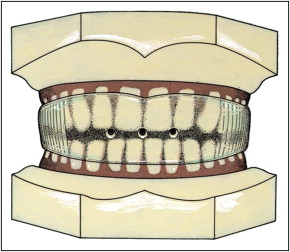
All patients had their molar bands and archwires removed an average of 7.3 days (±1.2 days) before debond to allow for closure of band spaces and presumably initial settling of the occlusion. Each arch subsequently was ligated from second premolar to second premolar in a figure-8 pattern with an 0.008-in ligature wire ( Fig 1 ). The next week, all fixed appliances were removed, and a tooth positioner ( Fig 2 ) was delivered with instructions to wear it full time for 24 hours. After that, the patients were instructed to wear the positioner as much as possible for 5 days, and then 4 hours per day and at night for 2 to 3 weeks. The positioner protocol lasted an average of 18.2 days (±7.6 days).
The prescribed procedure for the standard finishing protocol sample was for the detailing and finishing to be accomplished by “artistic” archwire bends and intermaxillary elastics before debonding. Posttreatment models then were obtained at fixed appliance removal.
Each set of study models from T1 to T3 was digitized by using an optical model scanner (3Shape RD640 3D scanner; EMS Digital Solutions, Dublin, Ireland). Models were hand-graded by using the criteria of the OGS (alignment, marginal ridges, buccolingual inclination, occlusal relationships, overjet, and interproximal contacts), except for occlusal contacts, which were calculated from the digital models by using software with an accuracy of 20 μm (Orthoanalyzer, version 2008-1; 3Shape, Copenhagen, Denmark).
Points were deducted according to the OGS protocol for each tooth not meeting the grading criteria. Deductions for each criterion were added for the final total patient score as described by the American Board of Orthodontics. Models were graded randomly to prevent bias, and the OGS scores were verified by spot checks conducted by a calibrated American Board of Orthodontics grader. Thirty-five sets of models were regraded by the lead investigator (G.J.S.) 1 month after data collection, and the results were analyzed for intrarater reliability. Root angulation was the only measurement for which a radiograph was used rather than study models to compute an OGS score; this measure was not included in the score because of the number of panoramic films that would have been necessary to take in a relatively short period of time. Root angulation was assumed to remain relatively constant during the period studied.
Statistical analysis
Descriptive statistics including means and standard deviations were calculated for age, duration of treatment, variables at time points T0 to T3, and changes between time points for the 2 groups. The data were analyzed with a statistical software package (version 17.0; SPSS, Chicago, Ill). Statistical significance was tested at P <0.05, P <0.01, and P <0.001.
Because of the ordinal nature of the American Board of Orthodontics discrepancy index and the OGS scores, nonparametric statistical calculations were conducted on all data. The Mann-Whitney U test was used for ana-lysis of initial forms and direct comparisons of the 2 protocols, and the Wilcoxon signed rank test was used to test for significant differences between the means of the complex finishing protocol at the different time intervals. An interclass correlation score of 0.953 was calculated on the 35 sets of models randomly chosen and rescored, indicating high intragrader reliability.
Results
Descriptive data and statistical comparisons for the starting forms in terms of the discrepancy index scores are given in Table II . Descriptive data and statistical comparisons for the changes in the complex finishing protocol sample over time and the differences between the 2 protocols are given in Tables III and IV , respectively.
| Discrepancy index measures | Complex finishing protocol n = 34 |
Standard finishing protocol n = 34 |
Complex vs standard protocols | |||
|---|---|---|---|---|---|---|
| Mean | SD | Mean | SD | Mean difference | Significance | |
| Overjet | 0.82 | 1.03 | 0.91 | 1.14 | −0.09 | NS |
| Overbite | 2.00 | 2.26 | 2.00 | 2.13 | 0.00 | NS |
| Openbite | 0.74 | 2.04 | 0.38 | 1.58 | 0.36 | NS |
| Crowding | 0.91 | 1.29 | 1.18 | 1.14 | −0.27 | NS |
| Occlusion | 2.09 | 2.04 | 2.41 | 2.69 | −0.32 | NS |
| Crossbites | 0.29 | 0.87 | 0.76 | 1.21 | −0.47 | ∗ |
| Cephalometrics | 3.24 | 3.98 | 4.41 | 5.54 | −1.17 | NS |
| Other complexities | 0.35 | 1.25 | 0.06 | 0.34 | 0.29 | NS |
| Total score | 10.44 | 6.24 | 12.11 | 6.46 | −1.67 | NS |
| American Board of Orthodontics measures | Deband; serpentine wires (T1) n = 34 |
Debond; deliver positioner (T2) n = 34 |
End of positioner wear (T3) n = 34 |
Significance | ||||
|---|---|---|---|---|---|---|---|---|
| Mean | SD | Mean | SD | Mean | SD | T1-T2 | T2-T3 | |
| Alignment/rotations | 2.32 | 1.39 | 2.47 | 1.42 | 1.53 | 0.96 | NS | ‡ |
| Marginal ridges | 5.06 | 2.44 | 4.47 | 1.75 | 3.79 | 1.65 | NS | ∗ |
| Buccolingual inclination | 2.35 | 1.92 | 2.29 | 2.57 | 2.18 | 2.41 | NS | NS |
| Overjet | 3.00 | 1.65 | 2.26 | 1.78 | 1.97 | 1.59 | † | NS |
| Occlusal contacts | 7.91 | 2.88 | 7.32 | 3.19 | 3.15 | 3.04 | NS | ‡ |
| Occlusal relationships | 0.71 | 0.87 | 0.65 | 0.95 | 1.47 | 1.60 | NS | † |
| Interproximal contacts | 2.41 | 2.02 | 1.82 | 1.68 | 0.59 | 1.02 | ∗ | ‡ |
| Total OGS score | 23.76 | 6.56 | 21.29 | 6.80 | 14.68 | 7.28 | † | ‡ |
Stay updated, free dental videos. Join our Telegram channel
VIDEdental - Online dental courses


