Introduction
The purpose of this study was to evaluate the effects of rapid maxillary expansion on nasal cavity volume by using 3-dimensional simulation and modeling programs.
Methods
The study group consisted of 15 patients (9 boys, 6 girls; mean age, 13.86 years) with maxillary constriction. Computed tomography scans were obtained before treatment and 6 months after the end of expansion. All computed tomography data were transferred to a computer, and the nasal cavity and maxillary teeth were segmented by using the Mimics and Simplant Ortho software programs (both, Materialise, Leuven, Belgium). Paired samples t tests were used to compare pretreatment and posttreatment nasal cavity volumes and maxillary areas. Data analysis was performed by using the software program SPSS for Windows (version 15.00; SPSS, Chicago, Ill).
Results
Rapid maxillary expansion treatment induced significant increases in nasal cavity volume ( P ≤0.001) and maxillary transverse dimensions ( P ≤0.001).
Conclusions
Both anterior-to-posterior and coronal-to-cranial expansions were observed after rapid maxillary expansion treatment, with the direction of expansion most likely affected by resistance from the cranial bones.
Posterior crossbite is a common malocclusion with a reported prevalence of 4% to 23%. Most posterior crossbites are unilateral and functional.
Rapid maxillary expansion is frequently used to correct posterior crossbite, increase maxillary width, and expand the arch perimeters to alleviate dental crowding. First described by Angell in 1860, rapid maxillary expansion was popularized by Haas 100 years later. Now, a trend toward more conservative nonextraction treatment and the desire for broader, more esthetic smiles have led orthodontists to routinely use rapid maxillary expansion to relieve arch length discrepancies in patients with already adequate arch forms.
Rapid maxillary expansion appliances induce both skeletal and dental changes. Rigid, fixed rapid maxillary expansion appliances produce heavy forces that separate the maxillary suture, resulting in maximum skeletal or orthopedic expansion and minimum orthodontic tooth movement. Orthopedic expansion via rapid maxillary expansion is achieved not only through the physical separation of the midpalatal suture, but also through rotational buccal force on the maxillary alveolar shelves, when the maxillary bones swing transversely around the frontonasal suture at the approximate center of rotation. Although rapid maxillary expansion forces are concentrated primarily on splitting the maxillary suture, the surrounding frontomaxillary, zygo-maticomaxillary, zygomaticotemporal, and pterygo-palatine sutures are also affected. An increase in nasal cavity width is sometimes observed as well and can lead to decreased nasal resistance and improved airflow.
The nasal cavity is designed specifically to humidify, adjust the temperature of, and remove infectious and impure particles from the air before it reaches the lungs. Nasal respiration contributes to the ideal development of the nasomaxillary complex. It has been hypothesized that, because the maxillary bones form half of the nasal cavity’s anatomic structure, midpalatal disjunction will affect nasal cavity anatomy and physiology. Changes in maxillary dental arch anatomy and nasal cavity anatomy and function from rapid maxillary expansion have been subjectively observed to improve nasal breathing and decrease nasal cavity resistance. Wertz confirmed the advantage of rapid maxillary expansion in improving nasal airflow in patients with stenosis of the nasal airway.
The skeletal and dental effects of rapid maxillary expansion appliances have been evaluated in numerous studies and with various techniques, ranging from manual measurement of dental casts to plane film radiographic techniques with lateral and posteroanterior cephalograms. In human cadaver studies using computed tomography (CT), Montgomery et al also showed that it was possible to obtain accurate volumetric measurements of the nasal airway from CT images. In recent years, newly developed 3-dimensional (3D) helical and multi-slice CT technologies have been accepted as noninvasive, time-efficient alternatives for reproducing 3D images. In this study, we aimed to evaluate the effects of rapid maxillary expansion on nasal cavity volume using 3D simulation and modeling software.
Material and methods
This prospective study was initiated after receiving institutional approval from the ethics committee of Gulhane Military Medical Academy in Ankara, Turkey; informed consent was obtained from all participants and their parents.
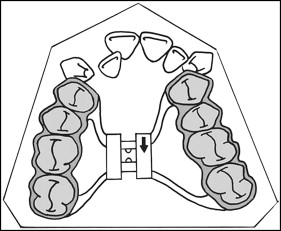
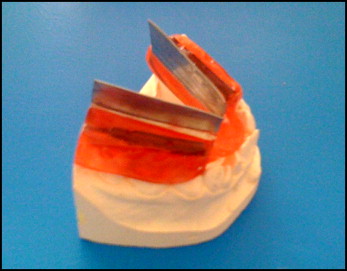
A total of 15 patients (9 boys, 6 girls) requiring treatment with rapid maxillary expansion were enrolled in the study. Their mean age was 13.86 ± 1.4 years (range, 12-16 years). All patients had maxillary constriction, bilateral posterior crossbite, and clinical crown length able to provide sufficient anchorage for the rapid maxillary expansion appliance. No patient had mandibular crowding or transverse deficiency (measured by calculating the difference between the distance of the distal or median cusp tips [if the mandibular molars had 2 buccal cusp tips, the measurement was made from the distal aspect; in case of 3 cusp tips, the measurement was made at the median] of the right and left mandibular molars and the distance between the median sulcus of the right and left maxillary molars). All patients were treated with bonded-type rapid maxillary expansion with posterior occlusal coverage. All appliances were fabricated in the same laboratory according to the method of Sarver and Johnston, with maxillary occlusal coverage of 3-mm acrylic extending from the first premolars to the second molars ( Fig 1 ). An expansion screw was centered in the maxillary arch, and the appliance was bonded to the teeth after the equilibration of the acrylic surface. The expansion screw and the frame were placed as close as possible to the roof of the palate without impinging on its surface. Patients underwent a standardized protocol of expansion (including a set amount of overtreatment) consisting of 2 turns per day (approximately 0.25 mm per turn) until the desired expansion was obtained.
All dental CT examinations were performed with a 16-detector CT scanner (MX 8000 IDT Multislice CT System-V 2.5; Philips Medical Systems, Best, the Netherlands) in the supine position. The following scan parameters were used: 16 × 0.75-mm detector collimation (pitch, 0.6); 1-mm slice thickness; 0.5-mm increments; 0.75-second rotation time; 120 kV; and 200 mAs.
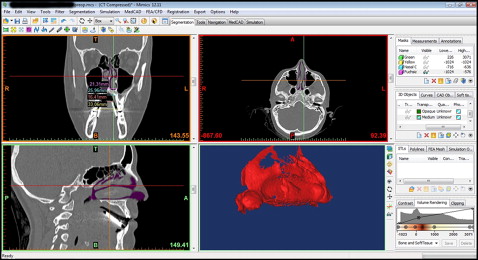
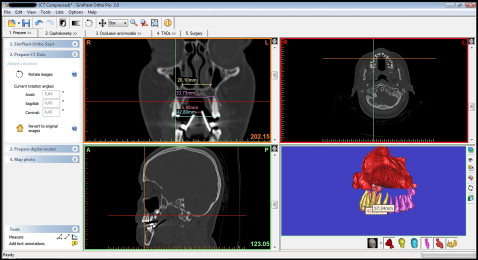
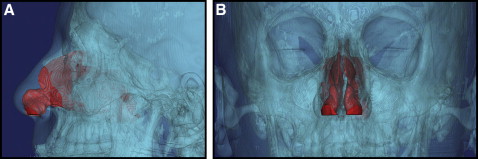
All CT data were transferred to a computer, and the nasal cavity and the maxillary teeth were segmented by using the Mimics and Simplant Ortho software programs (both, Materialise, Leuven, Belgium). Nasal cavity segments were restricted to the ostium of the paranasal sinuses, the posterior airway, and the nostrils ( Figs 2-5 ). Segmentation was performed by using the software’s threshold feature on each slice or on the direct 3D virtual model to eliminate artefacts and unnecessary elements of the 3D models.
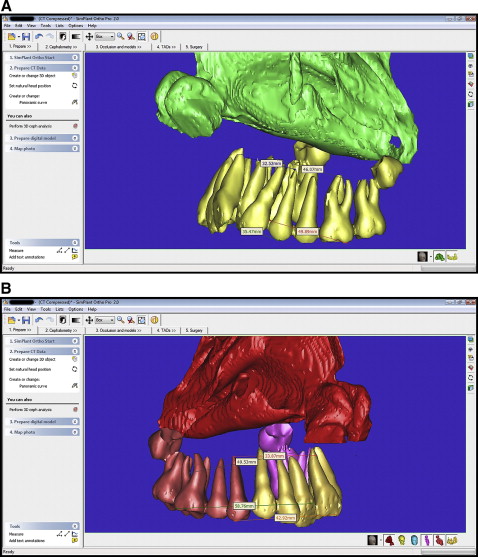
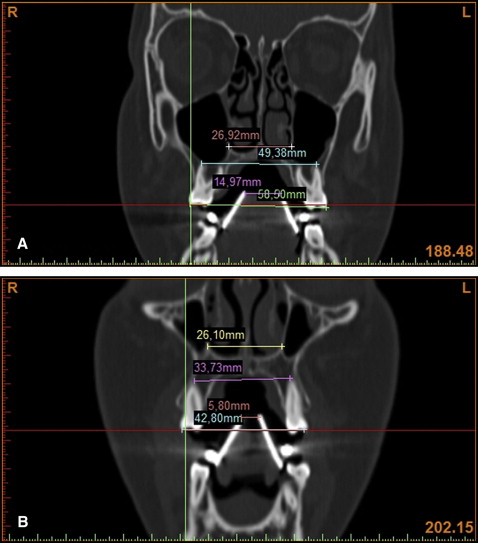
During the CT scans, the patients wore individual mandibular appliances to calibrate the magnification and confirm the appropriate section, which was used for linear measurements before treatment (T0) and 6 months after the end of expansion (T1) ( Fig 6 ). The distances between the vertical shields of these appliances were controlled in sections; the distances, used for linear measurements, were identical at both times (T0 and T1). By this way, used sections were controlled. Linear measurements were made in the cross-section images comprising the entire image of the first premolar and the first molar. At the premolar level, the distance between buccal cusp tips, and the distance between the apices of the buccal roots (if the first premolar had 1 root), the nasal base widths were measured. Nasal base width was measured as the distance between the most inferior left and right points of the intersection between the maxillary sinus and the nasal cavity. At the molar level, the distance between the distobuccal cusp tips, and the distance between the apex of distobuccal root and the nasal base width were measured. The same measurements associated with these teeth were repeated on the segmented 3D models. In this way, all metric measurements associated with these teeth were proofed.
All images were traced by an author (S.G.). The landmarks, measurement points, and margins of the nasal cavity were verified by another investigator (H.O.), and the parameters were remeasured by the author. The mean values of the first and second measurements were calculated according to the methods of Gröndahl et al and Ekestubbe and Gröndahl. The points measured for the maxillary first molar and first premolars are shown in Figure 7 . The same investigator remeasured the parameters 1 week later to evaluate measurement errors. Method error was determined by using Dahlberg’s formula : method error = Σd 2 /2n, where n is the number of subjects and d is the difference between the first and second measurements. The maximum method error for the linear measurements was 0.36 mm.
Statistical analysis
Analysis of data relating to nasal cavity volumes and maxillary areas before and after treatment was performed by using the software program SPSS for Windows (version 15.00; SPSS, Chicago, Ill). The Shapiro-Wilks analyses showed normal distributions for all parameters. Pretreatment and posttreatment measurements were compared by using paired samples t tests. To determine the sample size of this study, a statistical program (version 3.0.10; G∗ Power 1992-2008, Franz Faul, Universität Kiel, Kiel, Germany) was used. It was estimated that 15 subjects in each group must be included in the study for an effect size of 0.70, a power of 80, and error levels of α = 0.05 and β = 0.80.
Results
Mean values for all parameters measured at T0 and T1 are given in Table I , and the amounts and proportions of change between T0 and T1 are given in Table II . Significant increases were found in all variables ( P <0.001) ( Table II ).
| T0 | T1 | |||||||||
|---|---|---|---|---|---|---|---|---|---|---|
| Mean | SD | 95% CI of the mean | Median | Mean | SD | 95% CI of the mean | Median | |||
| Upper bound | Lower bound | Upper bound | Lower bound | |||||||
| 4-4 nasal base (mm) | 20.93 | 2.06 | 22.06 | 19.75 | 20.36 | 25.59 | 2.58 | 27.02 | 24.16 | 25.48 |
| 4-4 apex width (mm) | 29.25 | 4.53 | 31.75 | 26.73 | 30.08 | 35.74 | 4.18 | 38.05 | 33.41 | 36.50 |
| 4-4 crown width (mm) | 31.75 | 4.46 | 34.21 | 29.28 | 32.14 | 39.70 | 3.99 | 41.90 | 37.48 | 40.16 |
| 6-6 nasal base (mm) | 21.66 | 1.90 | 22.71 | 20.61 | 21.65 | 25.48 | 2.16 | 26.67 | 24.28 | 25.76 |
| 6-6 apex width (mm) | 43.32 | 4.05 | 45.56 | 41.08 | 42.25 | 48.87 | 4.16 | 46.57 | 51.17 | 47.99 |
| 6-6 crown width (mm) | 45.67 | 4.29 | 48.04 | 43.28 | 45.36 | 52.97 | 3.88 | 55.12 | 50.82 | 52.46 |
| Nasal cavity volume (mm 3 ) | 11693.27 | 1941.37 | 12768.36 | 10618.17 | 11674.00 | 13112.73 | 2026.29 | 14234.85 | 11990.61 | 12531.00 |
Stay updated, free dental videos. Join our Telegram channel
VIDEdental - Online dental courses


