Introduction
The form and the size of a dental arch are products of the configuration and the naturally established balance of the jaw, alveolar bone, and muscles. We investigated which arch dimensions mostly discriminate particular dentoalveolar classes and sexes.
Methods
Plaster dental casts were collected from 137 white adolescent subjects (71 girls, 66 boys) aged between 15 and 18 years (mean, 16.0 ± 1.2 years) with Class I (43 subjects: 24 girls, 19 boys), Class II (50 subjects: 28 girls, 22 boys), and Class III (44 subjects: 19 girls, 25 boys) malocclusions. Casts were scanned with the ATOS II SO (small objects) scanner (GOM mbH, Braunschweig, Germany) and measured with ATOS Viewer software (version 6.0.2; GOM mbH).
Results
The major discriminating factors of the particular dentoalveolar classes are the mandibular canine width/depth ratio and the maxillary molar width/depth ratio, which explain 82.8% of the total variability ( P <0.001). Class III subjects with the widest and shallowest frontal segment of the mandibular arch and the posterior segment of maxillary arch are clearly distinguished from Class II subjects whose abovementioned segments are the deepest and narrowest. Class I subjects are more similar to Class II than to Class III subjects. The most homogenous are Class III subjects, with 61.1% of them correctly classified, followed by Class II (57.8%) and Class I (52.4%). Sex differences are significant in linear measurements, but not in ratios.
Conclusions
Variability of dental arch dimensions and forms is a common characteristic of all dentoalveolar classes. Maxillary arch form is more distinguishing in the posterior segment, and mandibular arch form is more distinguishing in the anterior segment. Class III patients have the most detectable arch form, and Class I the least detectable arch form.
In recent decades, more refined mathematical descriptions of typical arch forms and shapes became available: parabolic, hyperbola, polynomial, β function, catenary curve, and trifocal ellipse.
For a long time, the Bonwill-Hawley arch form was considered ideal. Its anterior segment contours circle with the radius as the sum of mesiodistal widths of the incisors; in the canine-to-molar area, it follows a straight line. Catenary curve arch form approximates a better incisor-to-premolar segment, and Brader’s trifocal ellipse fits better in the molar region but produces more expansion in the premolar area. Now, the Boone template is sometimes used, based on a basic arch form but with individually adjusted measurements of both intercanine and intermolar widths from starting plaster casts of the patient. Arch form and shape are related to a person’s anatomic dimensions of the craniofacial skeleton, malocclusion type, ethnicity, and sex.
Customizing commercially available archwires appears to be necessary for all patients to obtain optimum long-term stability because of the great individual variability in dental arch forms. Basically, the size and the shape of a dental arch are products of the configuration and the naturally established balance of the jaw and the alveolar bone, and an interaction of muscle forces. Therefore, orthodontic treatment should not greatly alter the original arch form. There are small variations in intercanine widths of the maxilla and the mandible in Class I, Class II, and Class III malocclusions, and the main differences are in the posterior segments. Compared with Class I occlusions, Class II patients appear to have narrower maxillary and mandibular dental arches, and Class III subjects often have narrower maxillary arches and wider mandibular arches.
The shape of the archwire can be selected based on dental arch morphology of a particular patient, but treatment strategies and orthodontic technique philosophies are often accompanied by requirements for specific preformed archwires.
The Vari-Simplex arch form (Ormco, Orange, Calif) is slightly narrowed in the canine region for the ideal anatomic arch form proposed by Alexander. According to the recommendation of the authors of the McLaughlin-Bennett-Trevisi technique, most arch forms fall within 3 main clinically described shapes: square, ovoid, and tapered. The differences between the 3 preformed archwire shapes are in their anterior curvature and intercanine width of up to 6 mm. The ovoid shape is the most commonly used in clinical practice (45% of patients), whereas square is the rarest (15%). Tapered archwires, used in approximately 40% of patients, have the least intercanine width and are suitable for patients with a narrow apical base and gingival recessions on the canines and premolars. The Damon philosophy is based on the application of preformed archwires with minimal or no expansion in the canine area; they are broad in the premolar and molar regions to expand the posterior region. This arch form reduces the dark buccal corridors in the posterior part of the mouth and broadens the smile.
The purpose of this study was to investigate in patients with mild and moderate crowding which arch dimensions mostly discriminate the particular dentoalveolar classes and sexes, and the percentages of variability in the most common forms with the arch dimensions defined on virtual 3-dimensional (3D) dental arches.
Material and methods
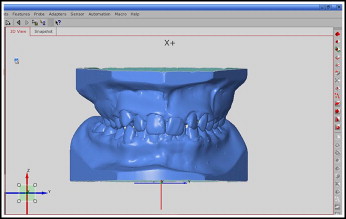
Full-mouth plaster dental casts were collected from 137 white adolescents (71 girls, 66 boys) aged between 15 and 18 years (overall mean, 16.0 ± 1.2; girls’ mean, 15.8 ± 1.2; boys’ mean, 16.3 ± 1.3) with Class I (43 subjects, 24 girls, 19 boys), Class II (50 subjects, 28 girls, 22 boys), and Class III (44 subjects, 19 girls, 25 boys) malocclusions. All participants had a fully erupted permanent dentition, with no history of orthodontic treatment; Angle dentoalveolar full Class I, full or half Class II, or Class III bilaterally on the molars; a positive or reverse overjet of not more than 4 mm; and no mesiodistal or buccal restorations. Subjects between ideal Class I and edge-to-edge cuspal relationship, and those with a rotated maxillary first molar (if the buccal cusps were in a Class II relationship, but the palatal cusp sat well in the central fossa of the mandibular molar), were not included in this analysis. Subjects had mild or moderate crowding (mean, 2.1 ± 1.4 mm; range, 0.5-4 mm). Angle classification was determined in centric occlusion. All records were selected from the Department of Orthodontics, School of Dental Medicine, at Zagreb University in Croatia. Casts were scanned by using an ATOS II SO (small objects) scanner (GOM mbH, Braunschweig, Germany). The scanner has point spacing in the range 0.02 to 0.17 mm, a measuring area of 30 × 24 to 250 × 200 mm 2 , and 1,400,000 measured points. Fringe patterns were projected onto the object’s surface with a white light and recorded by 2 cameras. The 3D coordinates for each camera pixel were calculated, and a polygon mesh of the object’s surface was generated. Models were measured and analyzed by using ATOS Viewer software (version 6.0.2; GOM mbH) ( Fig 1 ).
Maxillary and mandibular arch dimensions were defined by 4 morphologic parameters. Intercanine width was the distance between the canine’s clinical bracket points. Intermolar width was the distance between the first molar’s clinical bracket points. Canine depth was the distance from a line connecting the canine’s clinical bracket points to the origin between the central incisors. Molar depth was the distance from a line connecting the first molar’s clinical bracket points to the origin between the central incisors. Based on those morphologic parameters, 3 ratios for each arch were calculated: (1) ratio of intercanine width and canine depth, (2) ratio of intermolar width and molar depth, and (3) ratio of canine and molar depth.
All landmarks of the points were made by the senior investigator (Ma.S.) and checked by another investigator (Ml.S.), to verify the accuracy of landmark placement. Intraexaminer reproducibility and measurement error were evaluated based on double-landmark placements, and linear measurements were made on 30 randomly selected casts 1 month after the first analysis. Intraexaminer agreement was assessed by means of the intraclass correlation coefficient, and measurement error was calculated by the square root of the residual mean square.
Two-way analysis of variance (ANOVA) was used to determine the effect of the dentoalveolar classes and the sexes on arch dimensions. Multivariate discriminant analyses were conducted to distinguish which arch dimensions mostly discriminate the particular dentoalveolar classes and sexes, and what percentage of variability can be expected in the most common forms. Discriminant analysis is a useful tool when we want to build a predictive model of group membership based on the observed characteristics of each subject. The procedure generates a set of discriminant functions based on linear combinations of the predictor variables that provide the best discrimination between the groups. This statistical approach is used to assess the group structure by estimating how similar the members of a particular dentoalveolar class and sex group are to each other and how different from the members of other groups, to test for the percentage of misclassifications and correctly identified members of a group, and to provide a visual display of the variability in the dental arches with a scatter plot. The visual position of a particular group in discriminant space is graphically shown by its group centroid. The centroid is the point created by calculating average variate scores for each dimension of canonical functions separately for every group. Two discriminant predictive models were applied. The first model tested differences between arch dimensions, and the second model dealt with arch forms as ratios of arch dimensions. The data were analyzed by using Statistica (version 7.1; StatSoft, Tulsa, Okla) and SPSS (version 6.1; SPSS, Chicago, Ill) software, and an alpha of 0.05 was considered statistically significant.
The intraexaminer reproducibility was excellent (≥0.94), and the measurement error was small and acceptable (≤0.26 mm). Biologic variations of every measurement were assessed as standard deviations, and they was always greater (≥0.42 mm) than the measurement errors.
Results
Because 2-way ANOVA showed a significant effect of sex on dental arch dimensions, those parameters were analyzed separately for male and female subjects. The major discriminating factors of the groups were mandibular intercanine width, maxillary intermolar width, and mandibular molar depth. Two discriminant functions were statistically significant, and loss of information was acceptable because the first function explained only 58.8% of the total variance ( P <0.001), and the second an additional 20.5% ( P = 0.04; Tables I-III ). The 2-dimensional discriminant space of these 2 functions accounted for approximately 80% of the total variance, which indicated that only 20% of the variability was not defined by arch widths and depths in the canine and molar areas. A visual position of particular groups in discriminant space was graphically shown by their group centroids in Figure 2 . The centroid is the point created by calculating the arithmetic mean for each dimension of canonical functions separately for every group.
| Discriminant function | Eigen value | Percentage of variance | Cumulative percentage | Canonical correlation | Test of functions | Wilks Λ | Chi-square | df | P |
|---|---|---|---|---|---|---|---|---|---|
| 1 | 0.561 | 58.8 | 58.8 | 0.599 | 1-5 | 0.443 | 93.637 | 40 | <0.001 |
| 2 | 0.196 | 20.5 | 79.3 | 0.405 | 2-5 | 0.691 | 42.426 | 28 | 0.040 |
| 3 | 0.098 | 10.2 | 89.5 | 0.298 | 3-5 | 0.827 | 21.868 | 18 | 0.238 |
| 4 | 0.072 | 7.5 | 97.0 | 0.259 | 4-5 | 0.907 | 11.168 | 10 | 0.345 |
| 5 | 0.028 | 3.0 | 100.0 | 0.166 | 5 | 0.973 | 3.194 | 4 | 0.526 |
| Variable | Function 1 | Function 2 | Function 3 | Function 4 |
|---|---|---|---|---|
| Maxillary intercanine width | −0.361 | 0.244 | 0.134 | 0.276 |
| Maxillary intermolar width | −0.096 | 0.804 | −0.489 | 0.550 |
| Maxillary canine depth | −0.423 | 0.072 | −0.035 | 0.393 |
| Maxillary molar depth | 0.506 | 0.398 | −0.407 | −0.038 |
| Mandibular intercanine width | 0.770 | −0.071 | −0.207 | −0.801 |
| Mandibular intermolar width | 0.545 | −0.335 | 0.886 | 0.383 |
| Mandibular canine depth | −0.003 | 0.272 | 0.370 | −0.766 |
| Mandibular molar depth | −0.469 | −0.137 | 0.500 | 0.024 |
| Variable | Function 1 | Function 2 | Function 3 | Function 4 |
|---|---|---|---|---|
| Mandibular intercanine width | 0.592 | 0.466 | 0.277 | −0.397 |
| Maxillary intermolar width | 0.283 | 0.718 | 0.300 | 0.395 |
| Mandibular canine depth | −0.198 | 0.667 | 0.409 | −0.530 |
| Maxillary intercanine width | 0.015 | 0.633 | 0.402 | 0.058 |
| Maxillary canine depth | −0.137 | 0.631 | −0.054 | −0.285 |
| Maxillary molar depth | 0.066 | 0.456 | −0.325 | −0.275 |
| Mandibular intermolar width | 0.593 | 0.203 | 0.665 | 0.398 |
| Mandibular molar depth | −0.344 | 0.287 | 0.552 | −0.350 |
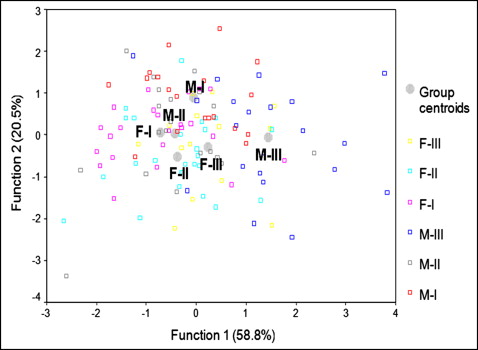
The first interpretable discriminant function explained only mandibular intercanine width ( Table III ). The second discriminant function defined maxillary intermolar width, mandibular molar depth, maxillary intercanine width, maxillary molar depth, and maxillary canine depth ( Table III ). The first function clearly distinguished Class III male subjects, who have the widest mandibular intercanine area, from Class I and Class II female and Class II male subjects, who have the narrowest intercanine distances ( Fig 2 ). The second function characterized Class I male and Class II female subjects based on a rather complex combination of 5 variables ( Fig 2 ). This model correctly classified only 47.2% of all subjects; this was an estimate of how similar are the members of a group to each other than to members of other groups. Likewise, the most stable group in group membership was the Class III males, with 72.7% of them correctly classified; 56.0% of the subjects retained their membership in their original group of the Class II females, 52.2% in the Class I female group, and approximately 40% of the subjects in the male groups with Class I and Class II. Based on their arch form characteristics, the remaining subjects were more similar to the groups outside their original group.
Since 2-way ANOVA did not show a significant effect of sex on dental arch ratios, those parameters were analyzed for the sexes together. The ratio of canine and molar depth had no significant effect on the differentiation between the classes and was omitted from further analysis. The major distinguishing factors of the particular dentoalveolar classes were the mandibular anterior segment and the maxillary posterior segment.
Two canonical discriminant functions were statistically significant. The first function explained 82.8% of the total variability ( P <0.001), and the second explained the remaining 17.2% ( P = 0.033; Tables IV-VI ). The first interpretable discriminant function accounted for the mandibular anterior segment and the maxillary posterior segment, and second function for the mandibular posterior segment and the maxillary anterior segment. The first function clearly discriminated Class III subjects as a group with the widest and shallowest frontal segment of the mandibular arches, and the widest and shallowest posterior segment of the maxillary arches from the Class II subjects ( Fig 3 ). Taking into account those parameters, Class I patients are more similar to Class II than to Class III patients. The second discriminant function clearly characterized Class I subjects as a group with the deepest and narrowest frontal segment of the maxillary arches and the posterior mandibular arches, respectively ( Fig 3 ). Class II and Class III patients have wider and shorter maxillary frontal segments and total mandibular arch length compared with Class I subjects. This model correctly classified only 56.9% of all subjects. The most stable were the Class III subjects, with 61.1% of them correctly classified, followed by Class II (57.8%) and Class I (52.4%) subjects.


