Introduction
The goal of this study was to evaluate the effects of 3 maxillary posterior intrusion mechanics with mini-implant anchorage by using the finite element method.
Methods
Finite element models were generated by assembling the images obtained by computed tomography and a laser surface scanner. For each posterior dental segment, a 300-g force was applied and distributed to the mini-implants in proportion to their calculated root surface areas.
Results
The most balanced intrusion and the most uniform stress distribution were obtained by concurrent force applications from the vestibular and palatinal sides. In the models with transpalatal arches and buccal force application, vestibular tipping movement and overall stress values were prominent. In all models, increased stress values were identified at the apical region of the first premolar roots and at the apical region of the first molar mesial root.
Conclusions
The results of this study suggest that the apical region of the first premolar roots and the apical region of the first molar mesial root should be considered to be prone to resorption during posterior intrusion treatment. Posterior intrusion systems with force application from counterbalancing sites lead to a more uniform stress distribution and balanced intrusion than the mechanics with a transpalatal arch. For a balanced intrusion, root surface areas should be considered when determining the appropriate forces.
Intrusion of the posterior teeth is regarded as a difficult orthodontic tooth movement. Several factors, such as magnitude and direction of the forces and orientation of the anchorage units, should be considered during posterior intrusion to prevent undesirable movement and root resorption. In most studies, it was reported that traditional posterior intrusion mechanics such as bite-blocks and fixed appliances with vertical elastics and multi-loop archwire therapy often have limited intrusion and side effects from insufficient anchorage. Once temporary anchorage devices in orthodontic treatments became established, the need for patient cooperation became obsolete, and side effects on the surrounding tissues were reduced significantly. The posterior intrusion methodology with temporary anchorage devices has also eliminated the need for orthognathic surgery for some borderline open-bite patients. Kuroda et al used titanium screw anchorage to treat open bites and stated that their results were similar to those obtained by 2-jaw orthognathic surgery. Sherwood et al aimed to treat anterior open bites by intruding the molars with titanium mini-plate anchorage; as a result, they accomplished true molar intrusion in adults. They stated that anterior open bites can be treated by posterior intrusion, resulting in reduced anterior vertical face height, a decreased mandibular plane angle, and counterclockwise rotation of the mandible.
Many studies have reported on the application and clinical efficiency of posterior intrusion mechanics; however, studies about biomechanical effects such as stress, strain, and displacements on the teeth and the surrounding tissues are limited. Since in-vivo studies are not quite sufficient in assessing biomechanical effects such as stress and strain, finite element analysis, a common method in engineering, became a valuable option for evaluation of biomechanical factors in orthodontics. Briefly, finite element analysis is a numeric method with which stress, strain, and deformation of structures with complex geometries can be studied in various loading and boundary conditions. Its philosophy is based on dividing complicated structures into manageable pieces, called elements, that can be easily defined with differential equations. These finite numbers of elements are then assembled to form an approximate mathematic model of the structure.
The main contributions of our study were to compare and evaluate the stress and displacement effects of 3 maxillary posterior intrusion mechanics with mini-implant anchorage by using the finite element method. The intrusive forces simulated in this study were assigned in proportion to the calculated root surface areas.
Material and methods
A computer-aided design model of the maxillary bone was generated by using 3- dimensional Doctor software (version 4.0; Able Software, Lexington, Mass). For this process, computed tomography images taken from a maxillary bone at 0.625-mm intervals in the axial direction were assembled perpendicular to the occlusal plane. The premolars and molars were modeled manually as suggested by Wheeler with 3ds Max software (Autodesk, San Rafael, Calif). Each tooth was located in the maxillary model according to the Roth prescription and aligned with reference to a maxillary medium Tru-Arch form (Ormco, Orange, Calif). Periodontal membrane, cortical bone, and alveolar bone layers were all defined by using the 3ds Max software. The periodontal membrane was assumed to have a thickness of 0.25 mm evenly. The thickness of the cortical bone was 2 mm at the palatinal alveolar bone and decreased from 2 to 1 mm from the top of the alveolar bone to the nasal floor of the vestibular alveolar bone ( Fig 1 , C ). The computer-aided design model of 0.018 × 0.025-in brackets, bands, and archwires with the same dimensions were generated with a laser surface scanner (NextEngine, Santa Monica, Calif) and 3ds Max software. Brackets were attached to the teeth so that the midpoint of the brackets overlapped the midpoint of the facial-palatinal surface of the crowns. Mini-implants were modeled manually with the 3ds Max software.
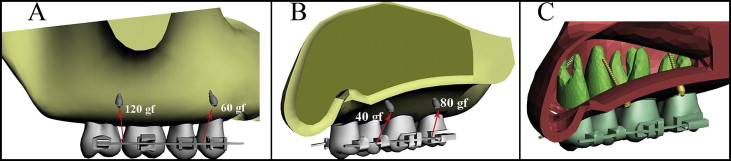
In the first model, the posterior teeth were connected by full-dimension segmental archwires from the vestibular and palatal sides. Mini-implants were placed between the roots of the first and second premolars and the first and second molars from both vestibular and palatinal sides ( Fig 1 ).
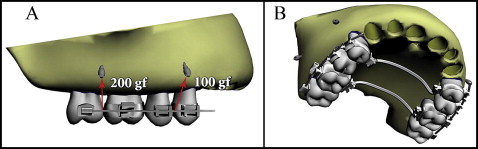
In the second model, the posterior teeth were connected from the vestibular side, and the mini-implants were placed from the same side between the roots of the first and second premolars and the first and second molars. In this model, to balance the moments produced in the vestibular direction, transpalatal arches with a diameter of 1.4 mm were constructed connecting the first premolars and the first molars ( Fig 2 ).
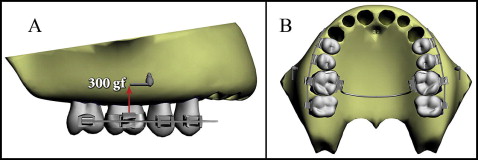
In the third model, as in the second model, the posterior teeth were connected from the vestibular side, and the mini-implants were placed from the same side between the roots of the first and second molars. In this model, only 1 transpalatal arch connecting the first molars was modeled ( Fig 3 ).
In accordance with the clinical applications, transpalatal arches were adapted evenly 5 mm from the palatal bone to achieve clearance for the intrusion movement. In clinical applications, to minimize tipping movements, a rigid connection should be preferred at the transpalatal arch-band interface. Accordingly, to simulate a welded connection, the transpalatal arch-band interface was considered a fully bonded surface.
Finite element models were generated by importing solid models into ALGOR software (Autodesk). Three-dimensional discrete mesh generations of the solid models were realized by using hexahedral “brick” and tetrahedral elements. The total numbers of elements used in the finite element models were 94,630, 203,150, and 198,600 for the first, second, and third models, respectively. By this process, convergence analyses of finite element method models were completed. All nodes, except for the constrained ones, had 3 translational degrees of freedom (x, vestibulopalatinal; y, mesiodistal; z, vertical). Boundary conditions were assigned to the nodes on the floor of the nasal cavity as zero displacement in all directions. Mechanical properties of the materials in the models were assigned as shown in Table I . All materials in the finite element analysis were assumed to be homogeneous, isotropic, and linearly elastic. Bracket-tooth, bracket-archwire, and bone-implant interfaces were defined as fully bonded surfaces.
| Young’s modulus (MPa) | Poisson’s ratio | |
|---|---|---|
| Alveolar bone | 1370 | 0.3 |
| Cortical bone | 13700 | 0.26 |
| Periodontal membrane | 0.6668 | 0.49 |
| Teeth | 19613.3 | 0.15 |
| Stainless steel | 200000 | 0.3 |
For all models, finite element analysis was realized by applying a total of 300 gf to each dental segment. Distributions of the forces were calculated in proportion to the root surface areas determined by the 3ds Max software ( Figs 1-3 ). The root surface area ratio of the molars to the premolars was calculated as 1.936 and rounded to 2; the ratio of the vestibular roots along the segment to the palatinal roots was calculated as 1.36 and rounded to 1.5.
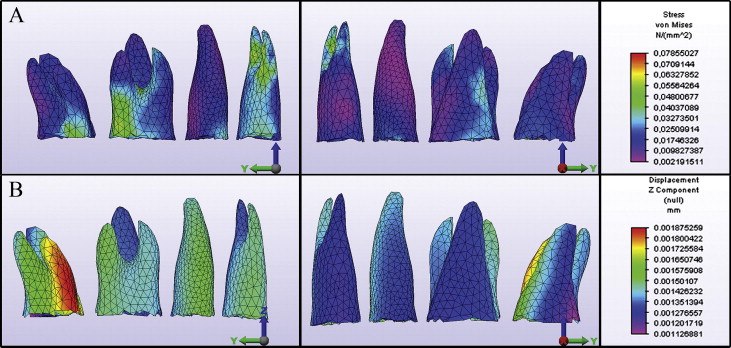
By using the finite element method, the initial vertical displacement of the posterior teeth and the Von Mises stress distribution along the root surface were evaluated. To determine tipping movements precisely, vertical displacements of the nodes, having the same coordinates in each model at the root apexes and the cusp tips, were assessed, and superimpositions were used.
Results
Among all models, the lowest stress magnitudes were produced in the first model ( Fig 4 , A ). The maximum Von Mises stress was 0.07855 N per square millimeter. The apical third of the first premolar roots and the same region of the first molar mesial root showed the highest stress magnitudes. Trifurcation areas of the first molar and regions adjacent to the force application sites also showed relatively high stress values.
In the second model, the maximum Von Mises stress was 0.49114 N per square millimeter ( Fig 5 , A ). This value was about 6.3 times higher than the maximum stress value in the first model. Increased stress values were observed at the apical third of the first premolar roots. The palatal surfaces of the first molar and first premolar roots and regions adjacent to the force application sites also showed increased stress magnitudes.
The third model had the highest maximum Von Mises stress value among all models, with 0.52708 N per square millimeter, which was approximately 6.7 times higher than the first model ( Fig 6 , A ). Increased stress values were identified at the first molar roots, especially on the vestibular surfaces and at the apical third of the first premolar roots.
In the first model, the maximum intrusion values were identified at the second molar mesial root ( Fig 4 , B ). Intrusion values calculated for the vestibular roots were slightly higher than those of the palatinal roots ( Table II ). This slight vestibular tipping of the teeth can also be realized from the slight variation of intrusion between the vestibular and palatinal cusps ( Fig 7 , Table III ). In the anteroposterior direction, there was no significant tipping or bowing of the dental segment ( Fig 7 ).
| Model 1 | Model 2 | Model 3 | |
|---|---|---|---|
| I. Premolar buccal | 14.9 × 10 −4 | 17.4 × 10 −4 | 18.6 × 10 −4 |
| I. Premolar palatinal | 13.6 ×10 −4 | 4.9 × 10 −4 | 3 × 10 −4 |
| II. Premolar | 14.3 × 10 −4 | 17.6 × 10 −4 | 24.5 × 10 −4 |
| I. Molar mesiobuccal | 14.3 × 10 −4 | 28.5 × 10 −4 | 47.4 × 10 −4 |
| I. Molar distobuccal | 15 × 10 −4 | 33.8 × 10 −4 | 58.2 × 10 −4 |
| I. Molar palatinal | 13.4 × 10 −4 | 7.7 × 10 −4 | 6.6 × 10 −4 |
| II. Molar mesiobuccal | 15.1 × 10 −4 | 36.1 × 10 −4 | 12.7 × 10 −4 |
| II. Molar distobuccal | 12.8 × 10 −4 | 30.5 × 10 −4 | 6.9 × 10 −4 |
| II. Molar palatinal | 12.5 × 10 −4 | 3.2 × 10 −4 | −1.8 × 10 −4 |
Stay updated, free dental videos. Join our Telegram channel
VIDEdental - Online dental courses


