Introduction
The purpose of this study was to determine the cortical bone thickness of the alveolar process in the maxilla and the mandible on cone-beam computed tomographs of adults with low, normal, and increased facial heights.
Methods
This study was conducted on 155 images of adult patients (20-45 years old) who were assigned to the low-angle, normal, and high-angle groups. The thickness of the buccal cortical plates of the maxilla and the mandible, and the palatal cortical plates of the maxilla, were measured.
Results
There was no statistically significant difference between the groups regarding mean ages, sex, and sagittal facial types. High-angle patients had significantly lower values than did low-angle patients in all mini-implant insertion sites in both the maxillary and mandibular alveolar bones. The mandibular and maxillary buccal measurements showed a similar pattern; the lowest values were for the high-angle group, followed by the normal group; the highest values were measured in the low-angle patients.
Conclusions
Clinicians should be aware of the probability of thin cortical bone plates and the risk of mini-implant failures at maxillary buccal alveolar mini-implant sites in high-angle patients, and at mandibular buccal alveolar mini-implant sites between the canine and the first premolar in normal and high-angle patients.
Orthodontic skeletal anchorage enables the clinician to proceed with absolute anchorage during treatment. Mini-implants are mostly placed in the palate, retromolar mandibular area, and buccal interradicular alveolar areas. When planning the probable sites for mini-implants, soft-tissue anatomy, interradicular distance, sinus and nerve locations, and bone quality should be assessed. For optimal safety from root damage and for preventing premature loosening of the implants, choosing sites with thicker cortical bone seems to be the solution because of increased primary stability. Authors of recent studies have investigated and mapped the cortical bone thicknesses at probable sites for mini-implant placement in patients using computerized tomography and skulls.
The morphology of the maxillomandibular complex is closely related to the surrounding muscular system, and the end result is somewhere between a long or a short face vertically. Vertical facial morphology is important for the orthodontist, since it affects the goals and the approach of orthodontic treatment by having an effect on growth prediction, anchorage system, bite force, and functions. Because the facial vertical dimensions are closely related to morphologic changes controlled by genetics and impaired oral respiratory functions during childhood in the design of the related bones, it is logical that cortical bone thicknesses of patients with different facial heights also differ. There is also a clinical study in which 1 success parameter of mini-implants was reported to be the vertical dimension of the face.
In recent years with the popularity of dental computed tomography images, 3-dimensional analyses and measurements of the jaws have become more common, especially for the morphology and cortical bone width of the cortical plate in the mandible. However, there is still no comprehensive study showing how the widths of the cortical plates in the maxilla and the mandible, as related to mini-implant placement sites, are affected by the different vertical patterns of the face.
The purpose of this study was to determine the cortical bone thicknesses of the alveolar processes in the maxilla and the mandible from cone-beam computed tomography (CBCT) images of adults with low, normal, and increased facial heights.
Material and methods
The sample for this study was recruited by retrospective screening of the consecutive 3-dimensional CBCT images in the archives of the Oral Radiology Department of Yeditepe University Dental School, Istanbul, Turkey, with the following criteria: no periodontal disease with alveolar bone loss, age between 20 and 45 years, no facial asymmetries, no cleft lip or palate, no impacted or missing teeth in the measurement site, no diagnosed systemic diseases, and no craniofacial dysmorphology. Patient data were handled according to the requirements and recommendations of the Declaration of Helsinki. Ethical approval was obtained from the institutional review board of Yeditepe University. The images used in this study were created with a focal spot of 3.3 mm and a voxel size of 0.093 mm on a CBCT unit (Iluma; IMTEC, Ardmore, Okla). These images were saved as Iluma vision viewer files. All measurements were performed at a window level of 1000 and a window width of 4000 because they provided the best images for accurate measurements.
Because a previous study reported that cortical bone width is the same for both sides of the jaws, only 1 side was measured. In assigning the images to a group, a cephalometric module was used. One angular (S-N/Go-Me) measurement and 1 linear (S-Go/N-Me) measurement were made to determine whether the patient belonged to the normal, high-angle, or low-angle group. For S-Go/N-Me, a ratio of less than 61% indicated increased facial vertical height, and a ratio between 61% and 69% was normal vertical height, and more than 69% was low facial vertical height. For the S-N/Go-Me angle, less than 27° indicated low facial height, between 27° and 37° was normal facial height, and more than 37° indicated increased facial height. If these 2 measurements did not indicate the same group, or if the values were borderline, then those images were excluded from the study. When all exclusion criteria were applied, there remained the CBCT images of 155 subjects. The mean ages of the low-angle, normal, and high-angle patients were 32.28 ± 7.93, 33.07 ± 8.23, and 34.45 ± 6.83 years, respectively. The low-angle group had 27 men (54.0%) and 23 women (46.0%), the normal group had 27 men (48.2%) and 29 women (51.8%), and the high-angle group had 18 men (36.7%) and 31 women (63.3%). Of the 50 subjects in the low-angle group, 20 were Class I (40.0%), 13 were Class II (26.0%), and 17 were Class III (34.0%); of the 56 subjects in the normal group, 27 were Class I (48.2%), 21 were Class II (37.5%), and 8 were Class III (14.3%); and of the 49 subjects in the high-angle group, 16 were Class I (32.7%), 23 were Class II (46.9%), and 10 were Class III (20.4%) sagittally.
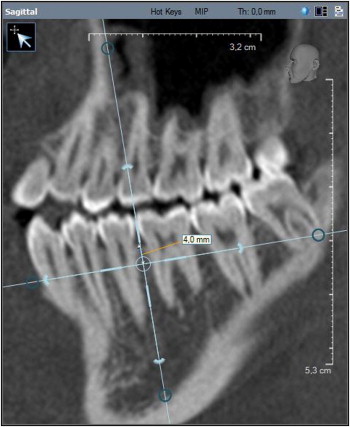
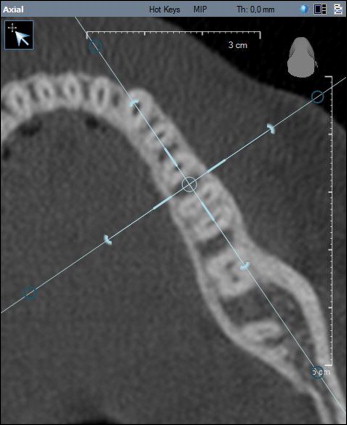
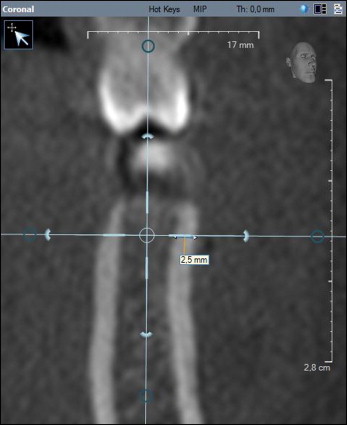
Cortical bone thickness was measured as the buccolingual dimension of the cortical bone measured perpendicular to the bone surface from its outer surface to the border of the cortical and cancellous bones. Interdental sites from the distal aspect of the maxillary canine to the mesial aspect of the maxillary second molar were examined in this study. The thicknesses of the buccal cortical plates of the maxilla and the mandible, and the palatal cortical plates of the maxilla, were measured at 4 sites: in the interradicular areas between the canine and the first premolar, the first and second premolars, the second premolar and the first molar, and the first and second molars. The lingual cortical plate in the mandible was not measured because of its limited use for mini-implant placement. The sagittal slice was used to locate the interradicular area of interest ( Fig 1 ). The slice was oriented so that the vertical reference line bisected the interradicular space and was parallel to the long axes of the roots at 4 mm from the alveolar crest. The axial slice was then used to ensure that the reference line bisected the interradicular area ( Fig 2 ). In the oriented images, 4 mm apical from the alveolar crest was determined in the coronal slice ( Fig 3 ); this represents the distance from the crest, where the mucogingival junction is generally situated. By using the coronal slice, the final measurements were made at 4 mm through the shortest distance of the cortical bone where the horizontal reference line contacted the endosteal surface ( Fig 3 ). The measurements were made by 1 operator (M.T.) after a month of training and trial measurements of 20 images, and recorded in an Excel file (Microsoft, Redmond, Wash). Thirty images (10 images randomly selected from each group) were remeasured to check for intraobserver reliability. The data obtained were evaluated statistically.
Statistical analysis
Statistical calculations were carried out with software for Windows (NCSS, Kaysville, Utah). In addition to descriptive statistics (means and standard deviations), in the groups with normal distribution, 1-way analysis of variance was used for intergroup comparisons, and the Tukey multiple comparisons test was used for subgroup comparisons. For the evaluation of qualitative data, the chi-square test was used. Percentile values for the groups were calculated. The results were evaluated at the P <0.05 significance level, with a 95% confidence interval. Intraclass correlation coefficients were used to determine intrarater agreement for the measurements. The operator was consistent in the repeated measurements; the interclass correlation coefficients were between 0.881 and 0.992. Interclass correlation coefficients of 0.75 or above are usually considered to be good; above 0.9 is excellent.
Results
There was no statistically significant difference between the normal, low-angle, and high-angle groups regarding mean ages (F, 1.00; P = 0.369), sex (chi-square, 3.07; P = 0.215), and sagittal facial type distribution (chi-square, 9.22; P = 0.056).
When the maxillary buccal alveolar cortical bone thicknesses were evaluated ( Tables I and II ), the low-angle patients had significantly higher values of bone thickness (1.64 ± 0.45 mm) compared with the normal and high-angle patients (1.39 ± 0.24 and 1.28 ± 0.22 mm, respectively) between the canine and the first premolar. For the measurements between the 2 premolars, the mean value for the high-angle group (1.27 ± 0.15 mm) was lower than those of the other groups (normal, 1.45 ± 0.22 mm; low angle, 1.54 ± 0.31 mm). Bone thickness at the mesial and distal aspects of the first molar showed another but similar trend: the lowest value was found in the high-angle patients followed by the normal patients, and the highest value was measured in the low-angle patients. In the maxillary palatal region ( Tables III and IV ), in all areas measured, the low-angle group had significantly higher values compared with the normal and high-angle groups.
| Normal group | Low-angle group | High-angle group | P value | |
|---|---|---|---|---|
| MX buccal 3-4 | 1.39 ± 0.24 | 1.64 ± 0.45 | 1.28 ± 0.22 | 0.0001 ∗ |
| MX buccal 4-5 | 1.45 ± 0.22 | 1.54 ± 0.31 | 1.27 ± 0.15 | 0.0001 ∗ |
| MX buccal 5-6 | 1.45 ± 0.25 | 1.58 ± 0.22 | 1.33 ± 0.23 | 0.0001 ∗ |
| MX buccal 6-7 | 1.44 ± 0.20 | 1.62 ± 0.29 | 1.26 ± 0.18 | 0.0001 ∗ |
| Tukey multiple comparison test | MX 3-4 |
MX 4-5 |
MX 5-6 |
MX 6-7 |
|---|---|---|---|---|
| Normal/low angle | 0.0001 † | 0.133 | 0.011 ∗ | 0.0001 † |
| Normal/high angle | 0.191 | 0.0001 † | 0.041 ∗ | 0.0001 † |
| Low angle/high angle | 0.0001 † | 0.0001 † | 0.0001 † | 0.0001 † |
| Normal group | Low-angle group | High-angle group | P value | |
|---|---|---|---|---|
| MX palatal 3-4 | 1.75 ± 0.36 | 2.18 ± 0.52 | 1.6 ± 0.31 | 0.0001 ∗ |
| MX palatal 4-5 | 1.61 ± 0.24 | 1.95 ± 0.37 | 1.5 ± 0.24 | 0.0001 ∗ |
| MX palatal 5-6 | 1.54 ± 0.28 | 1.71 ± 0.31 | 1.42 ± 0.27 | 0.0001 ∗ |
| MX palatal 6-7 | 1.49 ± 0.23 | 1.76 ± 0.29 | 1.41 ± 0.27 | 0.0001 ∗ |
| Tukey multiple comparison test | MX 3-4 |
MX 4-5 |
MX 5-6 |
MX 6-7 |
|---|---|---|---|---|
| Normal/low angle | 0.0001 † | 0.0001 † | 0.006 ∗ | 0.0001 † |
| Normal/high angle | 0.148 | 0.123 | 0.098 | 0.247 |
| Low angle/high angle | 0.0001 † | 0.0001 † | 0.0001 † | 0.0001 † |
The mandibular buccal measurements had a pattern similar to the maxillary buccal molar area ( Tables V and VI ). In all areas measured, the lowest values were in the high-angle group, followed by the normal group; the highest values were measured in the low-angle patients.
| Normal group | Low-angle group | High-angle group | P value | |
|---|---|---|---|---|
| MD buccal 3-4 | 1.45 ± 0.32 | 1.67 ± 0.34 | 1.22 ± 0.18 | 0.0001 ∗ |
| MD buccal 4-5 | 1.74 ± 0.33 | 2.05 ± 0.37 | 1.38 ± 0.28 | 0.0001 ∗ |
| MD buccal 5-6 | 1.93 ± 0.38 | 2.23 ± 0.34 | 1.55 ± 0.27 | 0.0001 ∗ |
| MD buccal 6-7 | 2.35 ± 0.38 | 2.74 ± 0.68 | 2.03 ± 0.3 | 0.0001 ∗ |


