Without exception, every patient exhibits unique developmental variations relative to the timing, the rate, and the morphologic characteristics of craniofacial growth. This is particularly true in patients who demonstrate skeletal growth disharmony. If the clinician ignores these developmental factors and bases treatment exclusively on dental considerations, treatment and the stability of the result could be compromised.
The clinician needs to correlate both craniofacial morphological information and physiological maturational information that is unique to the patient before an individualized diagnosis and treatment plan can be established ( Fig. 3-1 ). It is irresponsible to disregard the fact that every patient demonstrates unique developmental patterns, including the chronologic timing of maxillary and mandibular growth, variations in the rate of growth, direction and incremental increases in growth, the chronologic termination of skeletal growth, and dental and soft tissue relationships to this growth. All this information is easy to obtain in a systematic manner and is pertinent regardless of the choice of treatment mechanics. Because individuals usually exhibit consistency in maintaining basic skeletal growth patterns, and because facial growth is closely correlated with general skeletal growth, monitoring must occur during and after active treatment until a stable skeletal pattern has resulted.
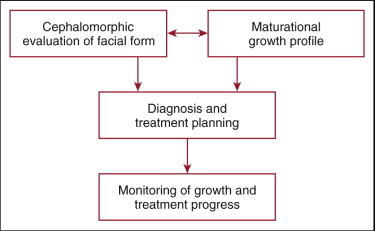
The primary purpose of this chapter is to demonstrate how variations in facial morphology and variations in maturational development influence both the timing and the methodology of clinical treatment. A series of patient examples are used to illustrate many of these factors.
CEPHALOMORPHIC EVALUATION OF FACIAL FORM
Individuals demonstrate wide variations in facial skeletal morphology. Many cephalometric analyses have been developed for the primary purpose of comparing the individual patient to so-called normative values usually derived from angular and millimetric measurements. These analyses depend on significant standardization of values, which is often poorly represented. Measurements often represent conflicting interpretations and do not rationally depict growth patterns known to exist. The generation of numbers derived manually or from a computer does not in itself make cephalometrics a science, and cephalometrics should not necessarily be considered as a science.
A more effective method of assessing skeletal, dental, and soft tissue morphological balance or imbalance is to view the lateral craniofacial radiograph “cephalomorphically,” not cephalometrically. Whereby a cephalometric analysis deals with numerical measurements, a cephalomorphic analysis can be defined as a strictly nonnumerical approach to the evaluation of craniofacial form and balance. For reasons previously mentioned, many investigators have expressed the negative value of a numerical (cephalometric) approach to the diagnostic problem and have expressed the positive value of a cephalomorphic (nonnumerical) analysis.
Centrographic Analysis
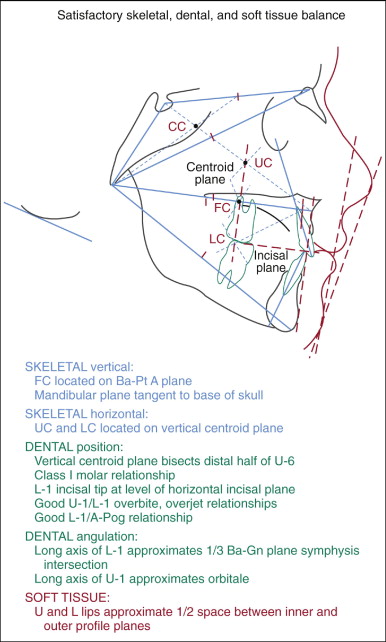
The primary objective of the centrographic analysis (CGA) is to provide the clinician with the ability to evaluate facial form graphically on an individualized basis without the need for potentially invalid numerical standards of reference ( Fig. 3-2 ). This subjective graphic analysis is based on the principle that similar craniofacial relationships exist in all individuals, regardless of gender, race, or ethnic variation, when skeletal, dental, and soft tissue morphology is in a state of balance and harmony. The selected anatomical areas evaluated by CGA have not been selected on the basis of demonstrating any inherent mechanisms of growth. No numerical values are relevant because even subgroups of individuals do not objectively demonstrate sufficient standardization of facial form. This analysis is concerned with overall facial balance and respects the “natural variability” associated with variations relative to age, ethnicity, race, and gender.
Centroid geometry and facial form
A centroid can be defined as the center of mass or gravity as applied to a three-dimensional object or a two-dimensional area. As seen in Figure 3-2 , one way of geometrically constructing the centroid of a triangle is by evenly dividing either two or three sides of a triangle and connecting these midpoints with the opposing vertices. The point of intersection of the planes is defined as the “centroid” of the triangle. Because all three planes intersect at exactly the same point, it becomes obvious that only two intersecting planes are required. For this reason, only four planes need to be drawn for this analysis (S-Na, Na-Ba, Ba–Pt A, and Ba-Gn) to achieve the construction of the four required centroids: Cranial, Facial, Upper, and lower.
The Cranial Centroid (CC) is represented by the triangle defined by points S (sella), Na (nasion), and Ba (basion). The Facial Centroid (FC) is represented by the total facial triangle defined by points Na, Ba, and Gn (gnathion). The Upper Centroid (UC) is represented by the triangle defined by points Na, Ba, and Pt A (point A). The Lower Centroid (LC) is represented by the triangle defined by the point of intersection among the Na-Gn, Ba–Pt A, and Ba-Gn planes.
As the face increases in size with growth, the centroids demonstrate relative stability even though the skeletal triangular areas that they represent increase significantly in size. This relative positional stability of the centroids is the fundamental principle on which CGA is based. In a well-balanced face, after eruption of the first permanent molars, the upper and lower facial areas demonstrate vertical equality or minimal difference in value, as demonstrated by the longitudinal comparison of the posterior facial angles (Na-Ba–Pt A and Pt A–Ba-Gn).
Vertical skeletal evaluation of facial balance is based on the relationship of FC to the Ba–Pt A plane, which is the common border between the upper and lower facial triangles. Centroid geometry dictates that the centroid representing two equal triangles will be located on the side that is common to both triangles. In a vertically well-balanced Caucasian face, FC is located on the Ba–Pt A plane, the common border shared by both upper and lower facial triangles that represents the division between upper and lower facial heights. A vertically deficient lower face is depicted by FC being positioned above the Ba–Pt A plane. A vertically excessive lower face is depicted by FC being positioned below the Ba–Pt A plane. Excessive vertical mandibular growth is also depicted by the mandibular plane being positioned more superiorly within the base of the skull instead of tangent to it.
Horizontal skeletal evaluation of facial balance is based on the relationships of UC and LC to the vertical Centroid Plane (CP), which is constructed perpendicular to the Ba–Pt A plane through FC. In a horizontally well-balanced face, UC and/or LC are located on the vertical CP. Protrusive skeletal mandibular and/or maxillary growth is depicted by UC and/or LC being positioned forward to this vertical CP. Retrusive skeletal mandibular and/or maxillary growth is depicted by UC and/or LC being positioned posterior to this vertical CP. Excessive horizontal mandibular growth is also depicted by the mandibular plane falling below the base of skull instead of tangent to it.
For the purpose of dental evaluation of satisfactory balance and harmony, angularly the long axis of the upper incisor is related to orbitale. Excessive proclination of the upper incisor is depicted by the long axis being positioned posterior to orbitale. Incisors that are too upright are depicted by the long axis being positioned anterior to orbitale. Angulation of the lower incisor is evaluated by its relationship to the symphysis, being best positioned when the long axis approximates the one-third mark of the Ba-Gn plane as it crosses the symphysis, thereby providing good bone support for these teeth. The lower incisors are too proclined if the long axis is positioned too far posteriorly within the symphysis and too upright if it is positioned too far anteriorly within the symphysis. Positionally, the labial surface of the lower incisor should approximate or be positioned slightly forward to the Pt A–Pog (pogonion) plane, depending on subjective soft tissue considerations such as thickness of the lips, desired amount of facial soft tissue convexity, and size of the nose and chin. In the well-balanced face, the incisal edge of the lower incisor should approximate the level of the Incisal Plane, a line drawn anteriorly from the Lower Centroid (LC) parallel to the Ba–Pt A plane. The upper incisor should positionally and angularly be properly related to the desired overbite and overjet position of the lower incisor.
Soft tissue (ST) profile balance is best evaluated by utilizing both inner (ST Pog–subnasale) and outer (ST Pog–nasal tip) planes together at the same time. This graphically provides a V -shaped area to view. Lips are generally in balance with the rest of the face when both occupy approximately one-half the space within this area. Visualizing the soft tissue profile in this manner helps relating the soft tissue to the underlying skeletal structures. It also allows for a more objective and subjective evaluation of the nose and chin. For example, if the nose or chin is skeletally in balance but the lips are not, the position and size of the nose and chin need to be evaluated.
MATURATIONAL GROWTH PROFILE
Regardless of the treatment mechanics employed, the clinician must responsibly evaluate the maturational profile of the growing patient. Children of the same chronologic age and gender can demonstrate significantly different amounts of growth at varying developmental times. With growth-related problems, there is little justification in formulating a treatment plan that depends exclusively on dental considerations or chronologic age. The clinician cannot ignore the fact that children of the same chronologic age can mature very differently.
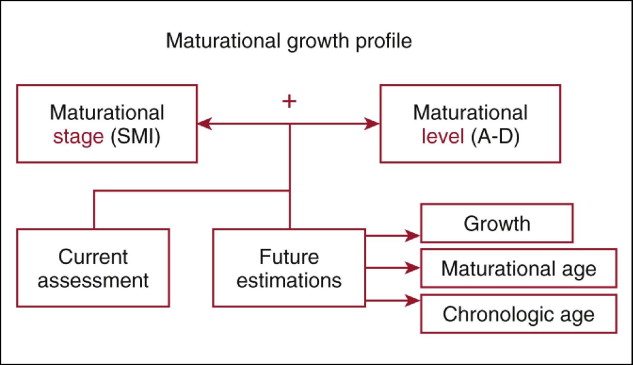
The System of Skeletal Maturation Assessment (SMA) provides the necessary methodology to establish an individualized developmental profile for the patient ( Fig. 3-3 ). This comprehensive system, developed over 30+ years, is easy to learn and provides for both current and future assessments of maxillofacial growth as well as the interrelationships between the patient’s maturational and chronologic ages. Information derived from hand-wrist radiographs forms the basis of SMA. Recent interest has focused on evaluating the development of the cervical column, as viewed on lateral cephalometric radiographs, to assess the general stage of maturation. The information derived is diagnostically very limited relative to progressive clinical evaluation and prediction of growth considerations before, during, and after the periods of treatment, including the time of facial skeletal growth cessation. The unique SMA approach to the utilization of hand-wrist radiographs thus provides the clinician with individualized patient information that can be directly applied to the timing and nature of treatment.
System of Skeletal Maturation Assessment
Identification of a patient’s maturational age depends on two mutually important and essential factors: the stage of maturation and the level of maturation ( Fig. 3-3 ). Other systems judge maturation exclusively on stage of development, as determined by the Skeletal Maturity Indicator (SMI) identified on the hand-wrist, cervical, or other radiograph. By not evaluating level of maturation, the clinician is significantly limited in diagnostic and treatment-planning capabilities. The degree by which the individual is advanced, average, or delayed chronologically relative to each SMI represents (1) significantly differing time intervals, (2) differing percentages of total growth completed, (3) differing amounts and rates of incremental growth, and (4) differences in the timing of maxillofacial growth cessation.
Stages of maturation
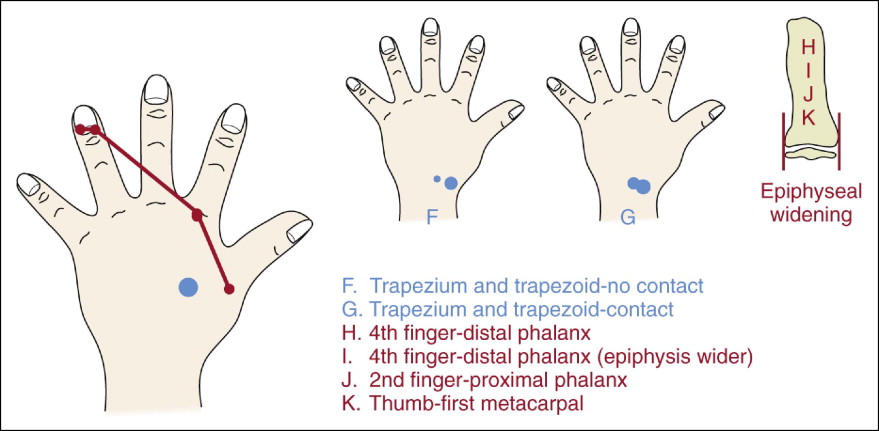
Development of the hand and wrist follows an orderly progression of skeletal events. The maturational stage refers to the highest-ranking SMI found on the hand-wrist radiograph. The midchildhood stages (SMIs F-K) of maturation represent a period of low velocity of facial growth ( Fig. 3-4 ).
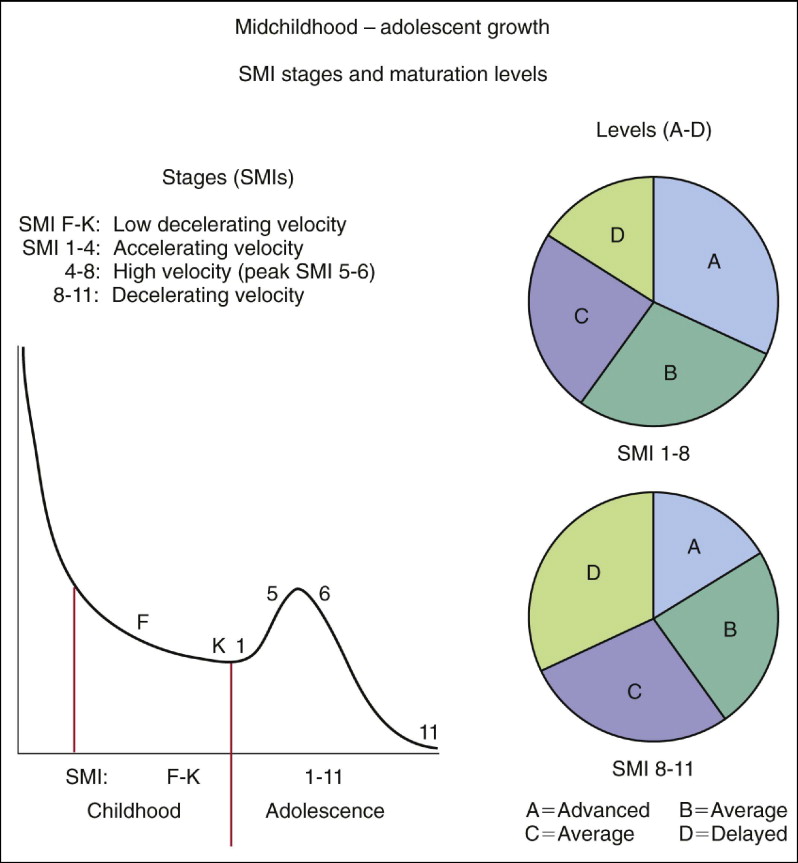
During adolescent development, SMIs 1, 2, and 3 represent a period of accelerating growth rate. SMIs 4 through 7 represent a period of very high growth rate, including the period of peak velocity of development (SMIs 5 and 6). SMIs 8 through 11 represent a period of deceleration in facial growth velocity, resulting in adulthood, generally associated with a time of skeletal growth termination.
During the midchildhood to late-childhood period of development, six distinct and progressive ossification events occur that are associated with SMA. These include the appearance and overlapping of the trapezoid and trapezium carpal bones and epiphyseal widening ( Fig. 3-5 ). This preadolescent period of development is generally associated with a very low rate of facial growth (see Fig. 3-4 ).
From the beginning of adolescence to adulthood, the stage sequence of developmental events involves 11 main SMIs plus 6 intermediate SMIs. The main adolescent SMIs include completed epiphyseal widening, appearance of the adductor sesamoid of the thumb, bilateral epiphyseal capping, and bilateral epiphyseal-diaphyseal fusion ( Fig. 3-6 ).
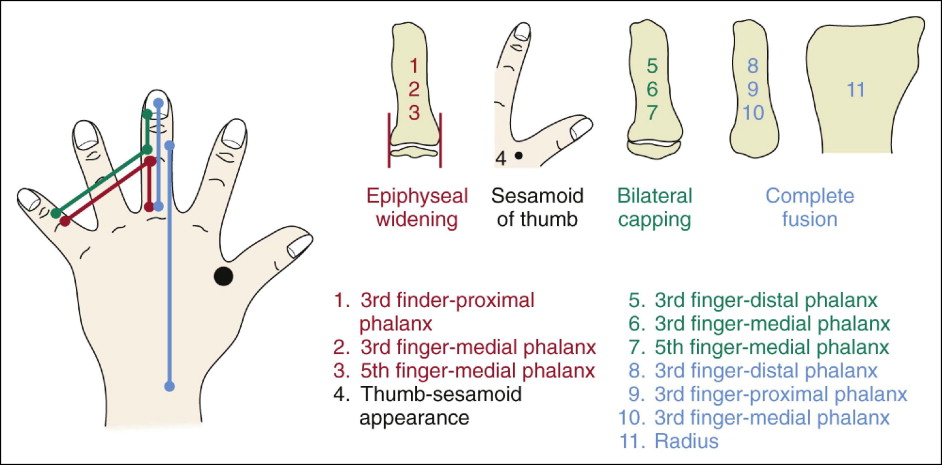
The SMI 1-3 period of development is associated with a progressive acceleration of growth rate. As seen in Figure 3-4 , the SMI 4-7 period of development is associated with a high growth rate. The SMI 5-6 period is generally associated with the time of peak velocity. The late SMI 8-11 period of development is associated with a progressive deceleration of facial skeletal growth. Adulthood is generally associated with adulthood, a time of skeletal growth termination.
The intermediate SMIs have been selected because of their strong clinical relevance ( Fig. 3-7 ). These transitional stages of maturation include the processes of unilateral epiphyseal capping, midline epiphyseal-diaphyseal fusion of two fingers and midline plus unilateral epiphyseal-diaphyseal fusion, and completed epiphyseal-diaphyseal fusion of the radius. The SMIs are readily identifiable because they are simply identified as transitional bony events that occur between the 11 main adolescent stages.
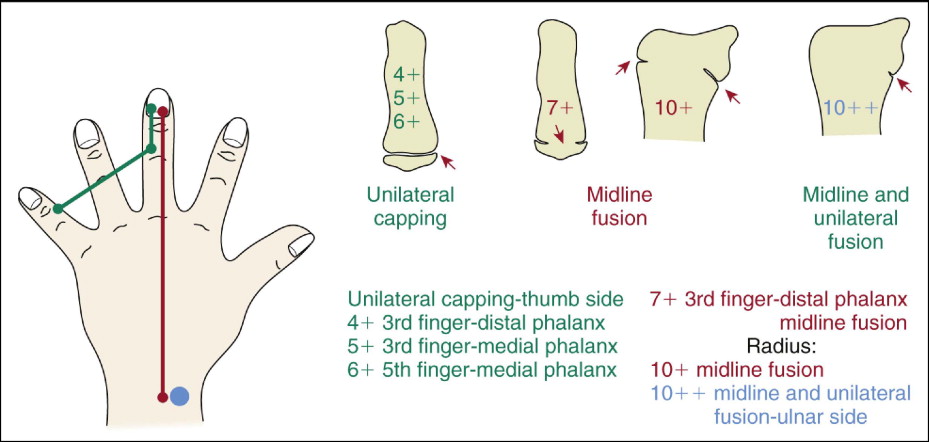
These intermediate SMIs are associated with the periods immediately before, during, and immediately after the time of peak velocity of maxillary and mandibular growth and during the late adolescent period of decelerating growth, when the percentages and the time of total growth completed can be estimated. SMIs 4+, 5+, 6+, and 7+ all occur around the period of very high growth velocity. For many patients, this period of both maxillary and mandibular peak growth rate is a clinically important time when growth modification treatment can be effective. As mentioned previously, chronologic age is not a reliable indicator to determine this developmental timing; changes are occurring rapidly at this time. The late maturational intermediate stages 10+ and 10++ are particularly important to identify when craniofacial surgery is planned. Frequently, “delayed ( level D) maturers” continue to grow during this period, often significantly, and surgical intervention must be delayed. “Advanced ( level A) maturers” exhibit significantly less growth during this late adolescent period, and therefore surgery can be initiated at an earlier chronologic age.
Levels of maturation
Individuals who demonstrate the same stage (SMI) of maturation, as seen on the hand-wrist radiograph, are most likely to demonstrate differing levels of maturation; this is a significant clinical factor to consider. For example, as also depicted in Figure 3-4 , during most of the developmental process, children of a younger-than-average chronologic age relative to a particular stage (SMI) of development are considered “advanced maturers”; they grow more rapidly and quickly than average or delayed individuals up until the time of late adolescence (~SMI 8). These individuals then tend to become developmentally “burnt out” and grow to maturity, but at a slower rate, and demonstrate significantly less incremental skeletal changes and different rates of growth. “Delayed maturers” demonstrate the opposite pattern, demonstrating continued growth over longer periods. With delayed maturers, late adolescence typically lasts longer relative to average or advanced maturers and attempts to “catch up” in terms of the amount of incremental growth. The more advanced or delayed the maturation level is from average values, the more evident these varying patterns become.
Table 3-1 compares four children (A, B, C, and D) relative to differing levels of maturation and their respective chronologic ages and percentages of total mandibular growth completed at SMI stages 1, 4, and 11 (adulthood). The chronologically youngest Patient A (advanced maturationally) demonstrated the largest percentages of total mandibular growth value. The chronologically oldest Patient D (delayed maturationally) demonstrated the smallest percentages of total mandibular growth value. Patient B (average but closer to advanced maturationally) and Patient C (average but closer to delayed maturationally) demonstrated a progression of this same pattern. The advanced ( level A) maturer demonstrated the shortest time of adolescent development, and the delayed maturer demonstrated the longest time of adolescent development. Within each maturational level subgroup, this same progression of developmental pattern exists, such as when comparing two or more level A maturers who have differing chronologic ages.
| Level | % Total Growth | CA | % Total Growth | CA | % Total Growth | CA | Total Time 1-11 |
|---|---|---|---|---|---|---|---|
| smi 1 | smi 8 | smi 11 | |||||
| A | 88.71 | 8.484 | 97.78 | 11.251 | 100 | 13.074 | 4.590 |
| B | 88.26 | 9.357 | 97.19 | 12.261 | 100 | 14.291 | 4.934 |
| C | 87.63 | 11.302 | 96.47 | 14.265 | 100 | 17.725 | 6.426 |
| D | 86.83 | 12.375 | 95.76 | 15.267 | 100 | 19.442 | 7.067 |
With factors related to clinical diagnosis and treatment planning, the importance of evaluating both maturational stage and maturational level together cannot be overemphasized. The clinician must know when, how long, and how much maxillary and mandibular growth will occur in the future for the patient. The time of termination of facial growth varies considerably relative to the maturational level but is predictable using SMA.
Stay updated, free dental videos. Join our Telegram channel

VIDEdental - Online dental courses


