7
Averaging Facial Images
Three-dimensional average faces find a number of applications in orthodontics and various craniofacial studies. These applications may include studying facial anomalies in comparison with normal facial morphology, evaluating average facial growth in a cohort of subjects, comparing facial morphologies for different ages, genders, and ethnicities, and so on.
The variation and change in the form and size of biologic objects are studied by the branch of bioinformatics called morphometrics. Traditional methods include measuring distances, angles, areas, and volumes.1,2 In the last three decades, more advanced methods have been developed based on the analysis of landmarks, points that have specific geometric locations, and associated biologic names. A morphometric study aims to describe a biologic shape in the simplest possible way, removing extraneous information and facilitating a comparison between different objects.3,4 The whole set of data describing the shape of an object is essentially replaced by a small number of landmarks, which are further analyzed by statistical methods. This approach uses the power of mathematics to study complex shapes in a rigorous fashion and permits their objective analysis rather than subjective assessment.
However, the techniques of morphometrics have some deficiencies. Most notably, nearly all quantitative data defining the shape are discarded, and just a small number of points are retained. For example, facial scans obtained with VI – 900/910 laser cameras (Konica Minolta Sensing, Inc, Osaka, Japan) or 3dMD optical scanning devices are represented by approximately 50,000 datapoints, whereas only 20–40 landmarks are used to describe a face, and 60–80 landmarks are used in craniofacial studies.5,6,7 It is clear that most information about the shape is simply ignored. Furthermore, these landmarks may be difficult to identify, and there are individual dependent errors in placing landmarks, which are often higher than the data capture errors. In this chapter, we outline techniques of averaging three- dimensional facial images defined by many thousands of datapoints that take into account all facial information available, with landmarks and methods of morphometrics also used at various stages.
As is known from morphometrics, prior to comparing (or averaging) shapes, they need to be fitted into a frame of reference that places them in the same virtual space. This is achieved through the removal of translation, rotation, and size difference, as well as the superimposition of the shapes to make them appropriately aligned.3,4,8-11 In addition, the method of averaging is also important. Let us consider these in order.
Removal of translation
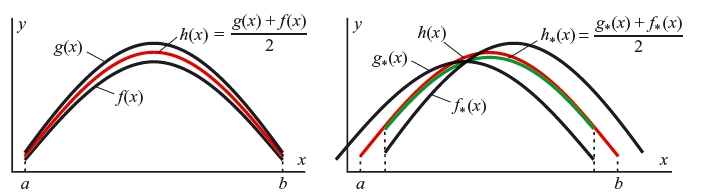
The necessity of removing translation can be illustrated as follows. For simplicity, consider two twodimensional shapes that need to be averaged. Let the shapes be denoted by functions f(x) and g(x) defined on an interval a ≤ x ≤ b. If they are not translated relative to each other, their average, h(x), is simply the arithmetic mean of them (Figure 7.1, left). If the shapes are translated (let f*(x) and g*(x) denote the respective translated versions), their average, h*(x) is different from the true average h(x), as can be seen from Figure 7.1 (right). Moreover, the average h*(x) is defined on a shorter interval, which means that some information is lost.
Removal of rotation
Similarly, rotation of the shapes leads to distortion of the average and loss of information.
Removal of size difference
In morphometrics, the objects are usually scaled to the same relative size.10 This is relevant when relative size is of no interest and the focus is on relative shape differences. A scaling factor is then evaluated for each object based on the calculation of the so- called centroid size.3,4 However, facial size is an important
Figure 7.1 If two shapes, f(x) and g(x) (left), are translated relative to each other, f* (x) and g* (x) (right), their average, h* (x) (green line), will be different from the true average h(x) (red line) and defined on a shorter interval. factor in many clinical applications. Therefore, we choose not to discard the size factor in our averaging approach. Furthermore, using scaled or unscaled facial images will not affect our averaging techniques.
Superimposition
In morphometrics, the most common technique to superimpose shapes is to use the so- called Procrustes registration.3,4 Following this technique, all respective landmarks are superimposed so that the overall deviation between them is minimum, in the least squares sense. All four of the above steps combined are known as Procrustes analysis if there are two sets of landmarks to superimpose, or generalized Procrustes analysis (GPA) if there are many sets of landmarks.
Although powerful, Procrustes registration is not an ideal technique to superimpose numerous objects. This is because it relies only on landmarks and does not take into account other information available. This is especially true for facial scans, which are defined by thousands and tens of thousands of datapoints; these datapoints do not have fixed positions and hence cannot be used as landmarks. An alternative approach here is to use best-fit registration, where all the data are used to minimize the total deviation between shapes. However, this approach is not flawless. It works very well when all objects are sufficiently close in size overall and in the sizes of their individual features. In reality, this is not always the case, especially for facial images.
It would be ideal if each object had a single, easily identifiable central point (an origin) that did not change its relative position across the group of objects under study, and furthermore if it had a fixed set of three reference planes that preserved their mutual position from object to object. It would then be easy to superimpose all shapes on the origin so that the respective reference planes would coincide. This is, for example, the case for ideal geometric bodies having regular shape, such as rectangular parallelepipeds, cones, cylinders, or ellipsoids. Unfortunately, real biologic objects, human faces included, are quite irregular, and they do not have a fixed and easily identifiable origin and reference planes. However, in the next section we suggest an approach to finding such an origin and such reference planes for threedimensional facial images.
Methods of a veraging
Even when all objects have been appropriately superimposed, averaging them is still far from straightforward. The approach used in morphometrics based on the analysis of landmarks cannot be applied to constructing average shapes. Although it is easy to calculate the average positions of all landmarks, they are too few to restore the whole average shape.12,13
To highlight problems occurring in choosing an averaging method, let us consider the following example. Suppose we have two aligned semi- circles as shown in Figure 7.2 and we want to construct their average. If we calculate the mean of two ordinates corresponding to each abscissa, we obtain the average shape shown in green; it is the so- called pointwise mean. One would expect that the resulting average shape would be a semi- circle of mean radius. As is apparent from Figure 7.2, the pointwise mean shape has the same width as the smaller semi- circle and furthermore is not a semi- circle (Figure 7.2, right).
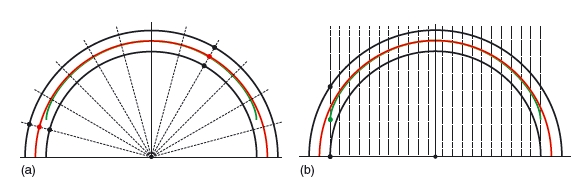
So this example highlights the two major problems of pointwise averaging: the resulting mean shape is distorted, compared with the expected one, and some information is lost at the edges. This happened because we performed averaging in the vertical direction. To avoid both problems, averaging should be done in the radial direction from the common centre (Figure 7.3, left).
Figure 7.2 Pointwise averaging of two aligned semi- circles (black). The average shape (green) is obtained as the pointwise mean of the ordinates corresponding to each abscissa. The dashed lines indicate the averaging direction. The resulting pointwise mean shape is distorted compared with the true average (red) and lacks data at the edges.
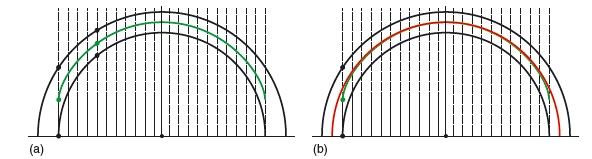
Figure 7.3 Radial (left) and normal (right) averaging of two aligned semi- circles (black). The average shapes (red) are obtained as the pointwise mean in the radial and normal direction. The dashed lines indicate the averaging direction. Both methods result in the true average.
The real shapes are not semi- circles, and they have neither a common origin nor a radial direction. It can be noticed from Figure 7.2 that the largest error and loss of information occurs where the lines along which the averaging is performed hit a shape at an acute angle; the smaller the angle, the greater the error. Where the averaging lines meet shapes at angles close to the right one or at least not too small, the error in determining the average shape and the loss of information are minimum.
For real biologic shapes, no method of averaging can provide zero error. However, as the above example shows, a good method should guarantee that the lines of averaging hit the shapes as perpendicularly as possible. Furthermore, choosing best possible origin and reference planes will keep the error of averaging at a minimum.
In order to develop an advanced superimposition technique for facial scans (shells), each represented by thousands of datapoints, we aim to find a most stable point (origin) and suggest a procedure for identifying reliable reference planes.
A successful candidate for the origin should be an easily identifiable point whose position changes least across a sufficiently large sample of images. To find such a point, a sample of 350 facial scans of 15½-year-old children, discussed in Chapter 13, was studied.5,6 Twenty-one reproducible landmarks were placed manually on each facial shell (see Figure 13.6). All faces were initially oriented to the approximate natural head posture,14 the right-to-left eye line giving the x-direction, the chin-to-forehead line giving the y- direction, and the nose pointing in the z – direction. The distribution of landmarks was studied using the following three methods:
- All facial shells were best-fit registered on a template (a randomly selected face from the sample), using Rapidform software (INUS Technology, Inc, Seoul, Korea), and translated so that the landmark centroid became the origin of coordinates, the point (0, 0, 0).
- All sets of landmarks were registered using GPA with scaling.
- All sets of landmarks were registered using GPA without scaling.
Preliminary knowledge indicates that the maxilla is subject to less change during facial growth than the mandible. Furthermore, the area around the eyes remains relatively stable, and the eye distance practically does not change significantly between 10 and 20 years of age.15 Therefore the most stable point, the point that shows statistically the least standard deviation across the whole sample, should be sought among the landmarks in the eye region. The standard deviations of all landmarks from their average positions were calculated in distance and each coordinate separately. The midendocanthion point ‘(denoted “men”)’ was added to the set of landmarks. The results are listed in Table 7.1.
As seen in Table 7.1, the mid- endocanthion landmark shows the least standard deviation in all three methods, and it is therefore considered the most suitable candidate for the facial origin.
As in human anatomy, it seems reasonable to use the sagittal, coronal, and transverse planes as the reference planes for a facial shell.16 Below, we suggest a procedure for identifying these planes.
Sagittal plane
The sagittal (also known as mid- sagittal) plane is an imaginary plane that travels from the top to the bottom of the face and divides it into left and right portions. It is essentially a vertical symmetry plane. This description is not rigorous and gives us a lot of freedom in identifying the exact position of the sagittal plane.
All human faces are known to be asymmetric, and hence they do not have a symmetry plane. The landmarks that are supposed to lie on the midline (glabella, nasion, pronasale, subnasale, labiale superius, labiale inferius, and pogonion) do not in fact lie on a single line – deviations can be up to several millimeters for the pronasale and pogonion. Even all the 21 landmarks, considering that they should be approximately symmetric about the sagittal plane, cannot be used as reliable datapoints for identifying it. Landmarks account for just a tiny fraction of all available facial data. Furthermore, they are subject to human error in placing them. Their positions are defined to within 1–2 mm, whereas the accuracy of the scanned facial images is about 0.5 mm. Following the logic previously adopted, we want to use as much facial information as possible to be as precise as possible.
Table 7.1 Standard deviations (in mm) of all landmarks from their average positions in the x-, y-, and z- directions and the distance for the sample of 350 facial scans of 15- year- old children
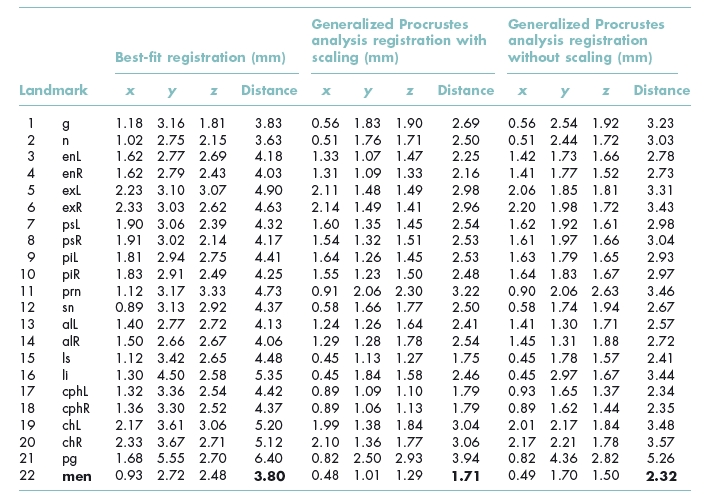
Three methods of registration were used: best-fit, general Procrustes analysis with scaling, and general Procrustes analysis without scaling. Among the landmarks in the eye region (1–10 and 22), the mid- endocanthion (men) shows the least standard deviations in all three cases; men values are given in bold to highlight the least- variation data and justify the selection of this point as the facial origin point.
The key to identifying a symmetry plane is using the mirror face.17 When the original facial shell and the mirror shell are registered together using the best-fit technique, the resulting structure becomes perfectly symmetric. We suggest that the symmetry plane of this structure should be treated as the sagittal plane for the original face.
Figure 7.4 illustrates a severe facial asymmetry, showing original face (a), mirror face (b), left left (composed from the left part and its mirror reflection) face (c), and right – right face (d). Using facial landmarks to identify the sagittal plane turns out to be less effective. The symmetrization procedure described above proves to be effective even for highly asymmetric cases. Figure 7.5 illustrates the procedure of symmetrization and construction of the sagittal plane for the face shown in Figure 7.4.
Figure 7.4 Facial asymmetry: (a) the original face, (b) the mirror face, (c) the left -left (composed from the left part and its mirror/>
Stay updated, free dental videos. Join our Telegram channel
VIDEdental - Online dental courses


