Chapter 6
Magnetic resonance imaging
Part 1: Basic Principles
INTRODUCTION
During the 32 years since magnetic resonance imaging (MRI) was first used to investigate a patient in Aberdeen, Scotland,1 it has become the first-choice investigation for a number of lesions affecting the face and jaws because of its ability to distinguish clearly soft-tissue lesions from adjacent healthy tissue. However, computed tomography (CT) remains the primary cross-sectional modality for the majority of cases because, among others (better for evaluating cortical bone, less susceptible to motion artifacts and so on) of its shorter scanning time.2 MRI already plays an important role in the evaluation and diagnosis of temporomandibular joint disorders and neoplasms of the face and jaws. Part 1 of this series introduces the principles of MRI and the terms most likely to be used in a surgeon-radiologist dialogue. Part 2 will explain the jargon and other MRI features that are most likely to appear in a radiologist report. Part 3 will focus on the pathology of the face and jaws displayed by MRI and other clinical applications (such as for preimplant evaluation/planning).
The MRI signal intensity depends on many factors, including the sequence used. The most common sequences used to image the jaws and their lesions are T1-weighted and T2-weighted, which will be explained later. New users must address a steep learning curve, which not only includes an understanding of this technology, but also of the images it produces; for example, most oral and maxillofacial clinicians are used to seeing bone as white, not black. Oral and maxillofacial clinicians already familiar with CT images will need to adjust further to the grayscale for soft tissues because fat shows up as “very bright” in contrast to black in the bone and soft-tissue windows of CT.
WHAT IS MAGNETIC RESONANCE IMAGING?
Although the MRI scanner and its images bear a superficial resemblance to CT, the two imaging modalities are completely different. MRI does not use ionizing radiation, but rather a radiowave “dialogue” with the patient’s tissues and lesion within a magnetic field. Its efficacy as a clinical imaging modality is based primarily upon the soft tissues being proton-rich; they are composed of between 70% and 90% water, which is concentrated hydrogen nuclei or protons. “MRI images are obtained by measuring how rapidly hydrogen nuclei of different tissues return to their resting energy states after being excited by a strong magnetic field.”3
The properties and amount of water within a tissue can alter drastically with disease or injury; MRI is very sensitive to the former and, therefore, is a very sensitive diagnostic modality.3 MRI images display a better definition between the lesion and the adjacent normal tissue than other imaging modalities2 generally available to the oral and maxillofacial clinician.
WHY IS MAGNETIC RESONANCE IMAGING SO SENSITIVE?
MRI detects subtle changes in the magnetism of the atomic nucleus and thus probes much deeper than X-rays, which interact only with the electron shells. In addition to merely imaging anatomy and pathology, MRI can, at its most advanced, investigate organ function, probing in vivo chemistry and visualizing brain activity.3
COMPONENTS OF THE MAGNETIC RESONANCE IMAGING SUITE
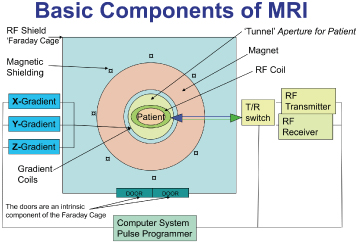
The MRI suite has 3 components: the magnet room, the technical room, and the console room. The “magnet room” contains the magnet and radiofrequency (RF) coils. It is enclosed within a faraday cage, which limits the influence of radiofrequencies arising outside the magnet preventing their interference with those generated by the magnet. This cage is an RF-shielded enclosure made of copper, aluminum, or steel sheets, and includes the door and windows, which are made of special wire-embedded glass. The door should be closed at all times, save for entry or exit. All equipment present or entering the magnet room must be MR compatible. Figure 6.1 is a schematic diagram displaying the principle components of the MRI scanner.
Figure 6.1. Schematic displaying the main elements of the magnetic resonance imaging scanner properly juxtaposed. The faraday cage is formed within the walls of the magnet room and includes the doors. The radiofrequency coils are applied directly to the part of the patient to be investigated, whereas the gradient coils remain part of the scanner.
Reprinted with permission from MacDonald-Jankowski DS, Magnetic resonance imaging for oral and maxillofacial surgeons. Part 1: Basic principles. Asian Journal of Oral Maxillofacial Surgery 2006;18:165–171.
The Magnet
The magnet is the main component of the MRI scanner. There are 4 types of magnets: air-cored resistive magnets, iron-cored electromagnets, permanent magnets, and superconducting magnets. The superconducting magnets produce excellent field uniformity and stability. They are the most frequently encountered type. They are liquid nitrogen or helium-cooled to 0° kelvin. This allows the Niobium-Aluminum alloy magnet to lose all its resistance to electrical current, enhancing its field strength. Most magnets in clinical use are within the midfield range of 0.5 to 1.5 tesla (T; a measure of magnetic field strength), which is suggested by Langlais et al. to be the optimum range.4 Nevertheless, Tutton and Goddard’s pictorial review5 of 29 figures of “MRI of teeth” displayed very good images created on a 0.2 T scanner (low-field strength). The patient, or part to be imaged, is placed within a “tunnel.” Magnets of less than 0.5 T generally do not have to have a tunnel and are “open.”1 The signal-to-noise ratio (SNR) is proportional to the field strength; the higher the field strength the greater the SNR.6 Runge et al. advocated routine brain imaging at 3 T because this offers superior SNR and contrast-to-noise ratio (CNR; see the later section on coils and image quality) compared with those for 1.5 T.7 However, low field strength is preferred for implant planning to reduce artifacts.
DISADVANTAGES OF MAGNETIC RESONANCE IMAGING
Even when produced by the same manufacturer, each magnet has its own inhomogeneities, which uniquely affect the images produced. Therefore, if the patient were to be reinvestigated on a different MRI scanner, the exact images are unlikely to be repeated; this is unlike CT. Studies comparing the results derived from different scanners are very few; Westwood et al. reported the difference between three European institutions assessing myocardial iron in patients with thalassemia.8
Air and bone appear to be black, because they have fewer protons and give virtually no signal. This is a problem for the maxillary antrum in which the air-filled antrum is normally separated from the thin bony walls by a thin antral mucosa, which may not always be obvious depending both on its thinness and spatial resolution of the MRI scanner.
Like any other type of medical imaging, movement has a deleterious effect on the resultant images. This is particularly important in view of the relatively long scanning times; a routine MRI scan can take 30 to 40 minutes compared with only 10 to 15 minutes for CT.2 Unlike CT, in which the entire volume data is available to manipulate, for example, to produce bone and soft-tissue windows and their variable widths, MRI has to scan each sequence separately. Therefore, sections reformatted from the T1-weighted (anatomy) and T2-weighted (pathology) scans may not necessarily be from exactly the corresponding anatomical sections, due to some change in patient position between the sequences. Nevertheless, the MRI technicians take very great care to ensure that the patient’s head is effectively, but comfortably, immobilized throughout the entire MRI investigation.
PULSE SEQUENCE
All MR images are produced using a pulse sequence, which is stored on the scanner computer. The sequence contains RF pulses and gradient pulses that have carefully controlled durations and timings. There are many different types of sequence, but they all have timing values that can be modified to obtain the required image contrast.5 All sequences are dependent on the two timing values, echo time (TE) and repetition time (TR).3
PROTON DENSITY
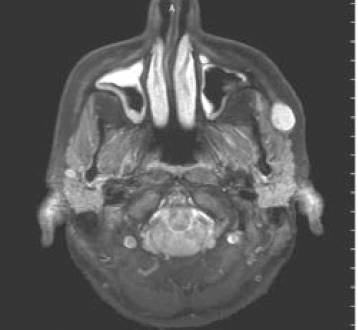
MRI is based on the natural magnetism that is induced in the human body when it is placed in the scanner’s magnetic field. The strength of this magnetism depends on the proton density (PD) of the tissues. PD is dependent on the number of hydrogen atoms in the tissues; fluids and fats both have high PDs so contrast between them is poor, unless “fat suppressed,” discussed later in Part 2 (Figure 6.2). Nevertheless, PD is used to display the roots of the cervical spinal cord.3 The PD sequence uses a short TE (less than 40 ms) and a long TR (longer than 1500 ms).3
Figure 6.2. Proton density scan through the maxilla. Because fat and soft tissues (containing water) are rich in protons (hydrogen nuclei), they have a similar intensity; both display gray shades. Contrast between fat and soft tissues has been enhanced by “fat suppression,” which is discussed in Part 3. Note the bright round “lump” on the left face. This painless, gradually enlarging swelling was a pleomorphic salivary adenoma. Compare its appearance in Figures 6.3 and 6.4. Compare also the hyperintense inflamed and nasal and antral mucosae with their presentations in Figures 6.3 and 6.4.
Reprinted with permission from MacDonald-Jankowski DS. Magnetic resonance imaging for oral and maxillofacial surgeons. Part 1: Basic principles. Asian Journal of Oral Maxillofacial Surgery 2006;18:165–171.
WHAT HAPPENS DURING A MAGNETIC RESONANCE IMAGING SEQUENCE?
When a scanning sequence begins, the magnetism within the tissues is knocked out of alignment with the main field of the scanner (Z or longitudinal axis) by the RF excitational pulses into the XY or transverse plane. The XY realigned magnetism has the potential to create its own signal. Characteristics of this signal are determined by the gradient, timing, and RF of the sequence.3 Once the RF signal is turned off, the protons relax by giving off energy (this energy loss is called free induction decay, FID) to get back to the equilibrium position along the Z axis. This energy loss is transferred to surrounding molecules and results in a T1-weighted signal. When the magnetic moments interfere with adjacent protons, this causes dephasing and loss of transverse magnetism resulting in a T2-weighted signal.5 Relaxation, T1-weighted, and T2-weighted will be discussed in more detail later in this part.
RADIOFREQUENCY COIL
The RF coil is made up of two separate coils; one to transmit the RF pulse to the patient’s tissues and lesion and the other to receive the MRI signal from the patient’s tissues and lesion. The RF coil’s shape and size is appropriate to the part of the body to be investigated. There is a whole range of coils for the head, parts of the spine, and major joints, and even one for the temporomandibular joint.3
HOW CAN THE RADIOFREQUENCY COIL AFFECT IMAGE QUALITY?
Selection of the appropriate coil is of paramount importance to achieve a high SNR and, consequently, high spatial resolution. A coil that is able to completely cover the region of interest so as to produce an image with the highest SNR and homogeneity should be chosen. The coil must be correctly positioned because the signal decreases as the distance from the coil increases. The decrease in signal also produces a decrease in SNR; therefore all coils must be precisely tuned.3,5
The bandwidth (BW) of RF frequencies needed to encode the spatial positions of signals, is also important for the SNR—the wider the BW, the noisier the image and the lower the SNR.7 If the SNR is too low (the image appears fuzzy when very low), the contrast will be poor and subtle contrast changes may be obscured. Therefore, according to McRobbie et al., the CNR is the most important aspect of the MRI’s image quality.3 SNR and CNR are not equal, in that a thick slice can give a good SNR but poor CNR. However, if the CNR or SNR are too low, the noise will obscure the spatial resolution.
The magnetic field strength is also an important factor in image quality. In dentistry, low field strength reduces artifacts from metal,9 which is often more important. However, this may now be less of an issue because of new strategies and programs. Kakimoto et al. reported that metal artifacts rendered the CT images for 2 of their 9 patients useless, whereas those of the MRIs were unaffected.10 Artifacts are briefly discussed later.
DISPLAYING AND REVIEWING THE IMAGES
Although many clinicians will still receive the images printed out in a 12-image format to be viewed on a standard viewing box, an increasing number will receive them downloaded onto a CD/DVD, which can be uploaded onto their computer monitors. The images of both formats should be read in conjunction with the radiologist’s report.
RELAXATION
Relaxation is the process the magnetization experiences as it fades (like a tuning fork) or precesses (like a spinning top) from the XY plane to the Z axis. There are two relaxation processes: “spin-lattice” and “spin-spin.” Spin-lattice controls the growth/recovery of the magnetization along the Z axis, and is also known as the “longitudinal proton relaxation time” or the T1-weighted sequence. Spin-spin controls the decay of the signal in the XY plane, and is also known as “the transverse proton relaxation time” or the T2-weighted sequence. Spin-lattice and spin-spin will now be referred to as T1-weighted and T2-weighted, respectively.5
T1-WEIGHTING
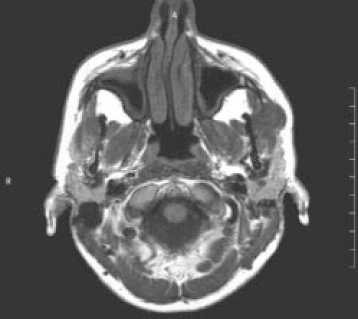
T1-weighted scans are often known as “anatomy scans” because their images display excellent contrast and most clearly show the boundaries between different tissues (Figure 6.3). These boundaries are made obvious by the fat-filled fascial planes; the T1-weighted scan is also termed “fat scans.”3 The central role of T1-weighted to display anatomy has been illustrated by Li et al. in their report on the presurgical evaluation of the parapharyngeal space. The parameters of this space are defined by important structures such as blood vessels, which can be difficult to evaluate by clinical and other radiological modalities.11 Further discussion of this and other spaces is found in Chapter 16. T1-weighted on its own has been applied to the TMJ to determine the position of the articular disc (see Figure 12.4). For a T1-weighted image a short TE (less than 40 ms) and a short TR (less than 750 ms) are required.
Figure 6.3. T1-weighted scan of the same section displayed in Figure 6.2. The subcutaneous fat and peripharyngeal fat appear white (“bright” or “hyperintense”), whereas the other soft tissues display a range of grays, from very light (“hypointense”) to those represented by skeletal muscle and the pleomorphic salivary adenoma (“isointense”). The black areas represent air-filled spaces, bone, or blood vessels containing fast-flowing blood.
Reprinted with permission from MacDonald-Jankowski DS. Magnetic resonance imaging for oral and maxillofacial surgeons. Part 1: Basic principles. Asian Journal of Oral Maxillofacial Surgery 2006;18:165–171.
T2-WEIGHTING
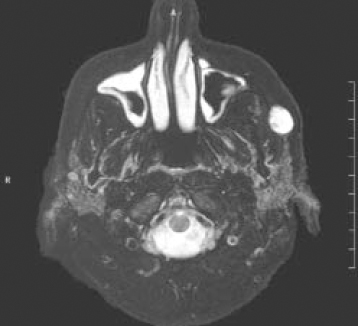
T2-weighted images take longer to acquire than T1-weighted images. T2-weighted images are often termed “pathology scans” because collections of abnormal fluid are bright against the darker normal tissue (Figure 6.4). T2-weighted images are also called “water images.”3 T2-weighted images are useful for detecting infection, hemorrhage, and neoplasms.1 For a T2-weighted image a long TE (greater than 75 ms) and a long TR (less than 1500 ms) are required. Further discussion of T2-weighted is deferred to Part 3. T1-weighted and T2-weighted processes are independent of each other.
Figure 6.4. T2-weighted scan of the same section displayed in Figures 6.2 and 6.3. This scan accentuates water-rich tissues, which includes most lesions such as the pleomorphic adenoma, and renders them hyperintense. In some cases, it may be difficult to differentiate these areas from fat, which is also hyperintense on T2-weighted scans. Frequently, the fat signal is suppressed on T2-weighted scans to further accentuate the water-containing features. This image displays “fat suppression,” which is discussed in Part 3.
Reprinted with permission from MacDonald-Jankowski DS Magnetic resonance imaging for oral and maxillofacial surgeons. Part 1: Basic principles. Asian Journal of Oral Maxillofacial Surgery 2006;18:165–171.
The reader should be aware that not all lesions are hyperintense on the T2-weighted sequence, nor are they always distinguishable. The more important of the strategies developed to address these feature later in this chapter. They are contrast media, fat suppression (particularly “fat saturation”) and other sequences.
WHAT ARE SPIN ECHO AND GRADIENT ECHO SEQUENCES?
The signal that comes back from the patient is collected as an echo. Echoes are produced in two ways by the pulse sequence. The most common pulse sequence is the spin echo (SE) because it makes the best quality images. Because the SE takes a long time—minutes rather than seconds—fast (or turbo) spin echo (FSE), a variation of SE, is often used to speed up the process.3
The gradient echo is represented by a whole family of different pulse sequences. Examples of these are fast low angle shot (FLASH), fast imaging with steady state precession (FISP). These have been developed to provide rapid acquisition, in seconds rather than minutes. This minimizes movement and physiological artifacts, increases patient throughput, and allows dynamic studies.6
ARTIFACTS
Gray et al. identified two types of artifacts that may be produced in the MRI of />
Stay updated, free dental videos. Join our Telegram channel
VIDEdental - Online dental courses


