6
Growth and development of the soft tissues
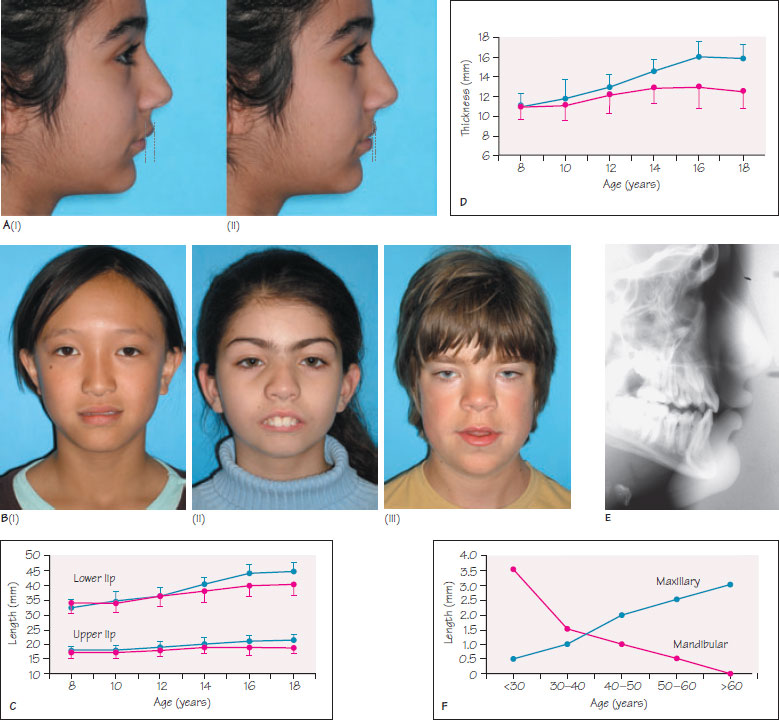
Figure 6.1 (A) Simulation effects of upper incisor retraction on the upper lip. Comparleon of the pre-treatment (I) and post-treatment (II) photographs showe that the upper lip is less prominent after 4–5 mm of upper incisor retraction. (B) The upper lip length is measured between subnasale and stomium superius. (I) Normal upper lip length; (II) short upper lip length – note the increased upper incisor display; (III) long upper lip – note the reduced upper incisor display at rest. (C) Changes in upper and lower lip length with growth. The blue lines represent male changes and magenta lines corresponding female changes. The error bars representthe standard deviation of the mean changes. Data taken from Mamandras A.H. (19ÔÔ) AJODO 94(5): 405–10. (D) Changes in upper lip thickness with growth. The blue lines represent male changes and the magenta line corresponding female changes. The error bars represent the standard deviation of the mean changes. Data is taken from Mamandras A.H. (19ÔÔ). AJODO 94(5): 405–10. (E) The thickness of the soft tissues overlying the chin can contribute to a prominent chin point. In this example the soft tissue chin thickness in increased. (F) Graph to show changes in maxillary (blue line) and mandibular (magenta line) incisor exposure at rest, in relation to age. There is a gradual reduction in upper incisor exposure and increase in lower incisor exposure with ageing.

The soft tissues of the face influence facial appearance and the stability of orthodontic treatment. Anteroposterior movement of the incisors can alter lip position and impact on facial aesthetics (Figure 6.1A). Examination of the soft tissues during orthodontic assessment and knowledge of normal soft tissue changes during growth is important in planning the final position of the incisors and predicting the stability of treatment changes.
Growth in lip length
The upper lip length, measured from the junction between the base of the nose and the upper lip (subnasale) to the lowest po/>
Stay updated, free dental videos. Join our Telegram channel

VIDEdental - Online dental courses


