CHAPTER 5
Three-Dimensional Imaging in Orthodontics
The advances of three-dimensional (3D) technology have accelerated at a tremendous pace over the last two decades with newer machines and advanced software support. This now means that applications for the clinical settings can be created and used in routine diagnosis, treatment planning, and patient education. Orthodontists will find that these advances will also impact the profession, and this chapter aims to give the reader the basic foundation on which to understand this interesting and exciting topic.
1 Imaging techniques and devices—what do these mean to the orthodontist?
New technologies reach the commercial and clinical environments on a daily basis and filter through every aspect of the medical and dental field. Orthodontists too are exposed to this fast pace of change, and these advancements have allowed innovative methods for facial diagnosis, treatment planning, and clinical application.
With continuing innovations and the use of powerful computer software tools, the last two decades have seen a reintroduction of both hard and soft tissue imaging devices in rapid succession. The orthodontist needs to embrace these new methods of diagnosis and treatment planning, since the images produced add a new dimension to present day concepts and test the foundations of our knowledge.
2 What does it mean to have a three-dimensional image and how is it obtained?
Three-dimensional image reconstruction is a complex task using mathematical principles. The 3D image is essentially an object that appears to have an extension in depth. In photography, a 3D image is reconstructed by the principles of stereoscopic vision when two images are pieced together from two or more cameras at known distances and angles. In radiography, multi-slice or multi-views of an object are cleverly reconstructed using complex mathematical algorithms to produce a representation of the object.
3 What is a possible classification of these devices?
Three-dimensional images may be obtained in a variety of ways. A possible classification system is listed in < ?xml:namespace prefix = "mbp" />
TABLE 5-1 Tabular Representation of Surface Imaging Devices
| METHOD | SOURCE | INDUSTRY EXAMPLES |
|---|---|---|
| Direct Contact | Manual Probe | |
| Photo-grammetry | Conventional photography | |
| Lasers | 670 – 690 nm Class I or II FDA approved laser lights | |
| 670 – 690 nm Class I or II FDA approved laser lights | ||
| Structured Light | Distorted light patterns and photogrammetric light capture | |
| Video-Imaging | Video sequencing | |
| Radiation Sources | Radiation pulses | |
| Others |
SURFACE IMAGING
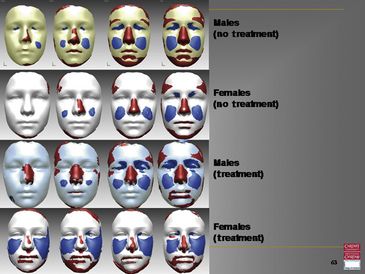
Facial Growth
Significant investigations have been done in the past on hard tissue growth of the cranial skeleton. However, reported studies focusing on and analyzing soft tissue morphology and growth are comparatively small in relation to the general orthodontic literature.
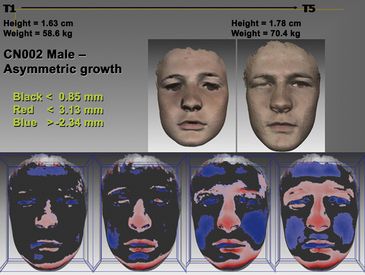
Early 3D imaging research has shown that the growth of facial structures broadly follows in line with gender and age. Growth is present in a number of facial structures and may be visualized as surface and volume changes (
Average Faces and Superimposition
Average faces of 3D images from a cohort of same-age individuals may also be created.
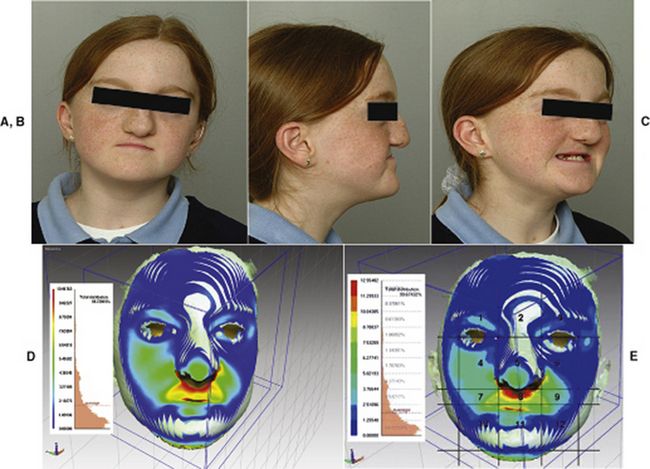
FIG 5-3 A-C, 11-year-old girl with right unilateral cleft lip and palate. D, Superimposition of patient on the average 11-year-old face; color map indicating the magnitude of deviation around the cleft region (red, 10.9 mm; green, 6.5 mm; cyan, 3.3 mm retrusive compared with the average face). E, Zona/>
Stay updated, free dental videos. Join our Telegram channel
VIDEdental - Online dental courses


