Chapter 5
Digital Imaging
Aim
The aim of this chapter is to provide foundation knowledge for an understanding of digital x-ray imaging.
Outcome
At the end of this chapter, the reader should understand the differences between “analogue” and “digital”, and the fundamentals of digital image data and how they can be manipulated.
Introduction
Digital is everywhere, from digital radio and television to digital cameras; the digital revolution is here. The word has become synonymous with quality, but what is “digital”? and why is it better than what we had?
Analogue
Before digital came along the world was exclusively analogue. Analogue refers to the continuous representation of a quantity. For example, if we measure the length of an object we can measure it in metres, centimetres, millimetres, micrometres, nanometres and so on. This applies to anything, for example size, colour and temperature. With analogue, wherever we measure and however finely we measure, there will always be something to see, continuously. This is illustrated in Fig 5-1, which shows a simple continuous analogue curve; we can look at any point on the curve and get an intensity value.
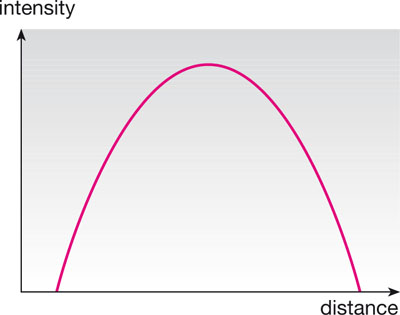
Fig 5-1 Analogue representation of a curve.
Digital
Whereas analogue is continuous, digital is discrete. That is, we represent a continuous signal by taking individual, discrete samples that together provide an approximation to the continuous signal. Fig 5-2 shows the same signal as in Fig 5-1, but now it has a grid overlaid to give the location of the sample points. Fig 5-3a shows the curve sampled at the closest points on the grid. The results give not only discrete positions but also discrete intensities. We can represent the curve digitally, that is numerically, as shown in Fig 5-3b.
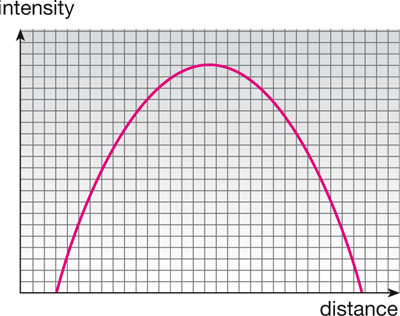
Fig 5-2 Discrete overlay grid used to sample the curve.
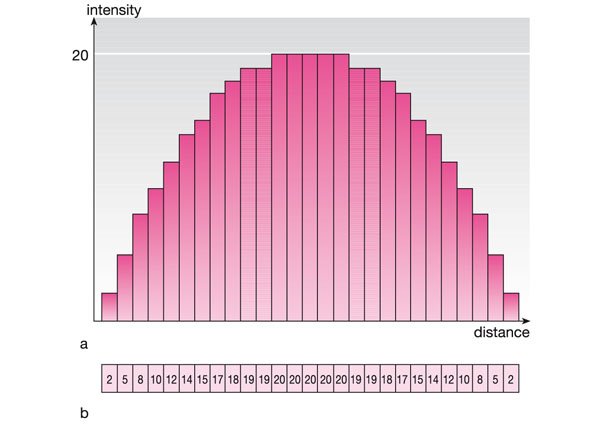
Fig 5-3 Sampled version of the curve; a) sampled at closest points; b) digital representation.
For an image we need a two-dimensional matrix, where each point has an image intensity value called a “greyscale”. Each discrete point in an image is called a “pixel”. The smaller the pixel size, the closer the digital sample is to the original signal (see Fig 5-4).
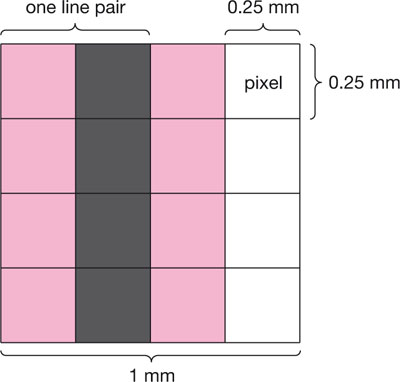
Fig 5-4 Example showing a group of pixels and a line pair. In this example, a pixel size of 0.25 mm and a spatial frequency of 2 lp/mm is shown.
Advantages of Digital
The main advantage of digital radiography is that acquisition and display of images are separated. This means an image can be copied, stored remotely and viewed without limit. This has communication, workflow and archive advantages. The data can also be processed, using image processing, to preferentially enhance features of interest, which may arguably enhance diagnostic efficacy. Computer-aided diagnosis may also be possible, with the computer identifying features of interest and highlighting them for the user. All of these features add up to a faster and more efficient handling of diagnostic images. However, digital imaging is not without its limitations.
Disadvantages of Digital
The main technological limitation of digital imaging is the detector technology. The digital image will always be an approximation of the analogue signal, both spatially and in signal intensity. The better the digital detector, the closer we can get to the analogue presentation. Additionally, the patient dose for a digital system may need to be higher to achieve the same levels of noise as with film.
These are technology-related issues that may well be solved with technology advances. What cannot be improved is the loss of control of the image data. With film, the linked acquisition and display ensures consistent display and image probity. With digital, both of these factors can be varied at will and may have a significant impact on diagnostic quality. An example of this is where an image is compressed using “lossy” compression and transmitted electronically for remote viewing; the image data received by the viewer will contain compression artefacts. Additionally, the viewer may have a substandard monitor and so may not be able to see features originally identified.
These issues are not insurmountable but need to be considered for a digital diagnostic system, where loss of image quality may have serious consequences. An understanding of how the image data can be compromised is also important in order to maintain diagnostic quality.
Digital Image Parameters
Sampling Size
With digital data, there are several ways to describe the sampling size or sampling frequency of an image. These are:
-
pixel size (mm or microns): the physical size of each pixel
-
dots per inch (DPI): the number of dots (pixels) in a one-inch line
-
line pairs per mm (lp/mm): the number of pairs of on/off pixels in 1 mm.
Of these, the term used most often in medical imaging is line pairs per mm. This measure has its roots in the term “cycles per mm”, the analogue expression of frequency, and is the number of sine wave pairs in 1 mm. A sine wave is a continuous function and therefore cannot be used in digital imaging; it is replaced by the discrete line pairs per mm in digital images. For a 0.25 mm pixel size, the number of line pairs per mm is 2 (Fig 5-4). The equation that relates pixel size to line pairs per mm is:

A comparison of line pairs per mm and the other measures is given in Table 5-1.
| lp/mm | Pixel size (mm) | Pixel size (μm) | Approx. DPI |
| 5 | 0.1 | 100 | 250 |
| 2 | 0.25 | 250 | 100 |
| 1 | 0.5 | 500 | 50 |
The highest frequency a digital image can display is called the “Nyquist frequency”; this is the point above which the digital system cannot represent the analogue signal. In the example shown in Fig 5-4, the highest frequency that can be represented is 2 lp/mm.
Bit Depth
Digital imaging requires computers. Unfortunately, computers do not work in decimal but in binary, and as a result they use “bits” and “bytes”. As it is not possible to escape from this terminology it is worth clarifying what it means.
“Binary” is the number base 2, and therefore there are only two digits, 1 and 0. The value of each digit is determined by its order. Each digit is referred to as a “bit”. There are four bits in a “nibble” and eight bits in a “byte”. The number of bits available is referred to as the “bit depth”. In a medical or dental image the bit depth is at least eight, which allows us to represent the values 0–255.
In order to find the number of decimal values, and so the number of levels of grey, allowed by a specific bit depth, raise 2 to the power n, where n is bit depth:
Number grey levels = 2n
Table 5-2 shows the bit depths most commonly used in greyscale medical images and the number of levels of grey that each can reproduce. Fig 5-5 illustrates the data loss that occurs if using less than eight bits. The higher the bit depth, the greater the number of grey levels and the closer we can represent the original analogue signal. However, increasing bit depth requires more space, as does increasing the matrix size (Table 5-3).
| Bit depth | Maximum decimal number (grey levels) that can be represented |
| 8 | 256 |
| 10 | 1024 |
| 12 | 4096 |
| 16 | 65,536 |
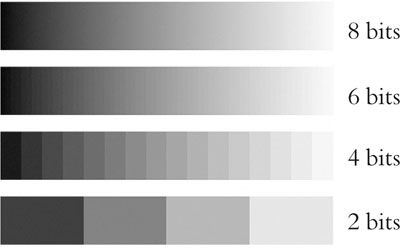
Fig 5-5 A continuous tone scale is shown sampled at 8, 6, 4 and 2 bits of greyscale. It can be seen that the 8 bits shows a continuous tone whereas anything lower starts to show banding.
| Image size /> |
Stay updated, free dental videos. Join our Telegram channel

VIDEdental - Online dental courses


