Fundamentals in the Methods of Periodontal Disease Epidemiology
The Need For Epidemiology
“Periodontal [gum] diseases, including gingivitis and destructive periodontal disease, are serious infections.”1 This 2009 statement from a professional dental organization reflected the dominating belief of the last half century that periodontal conditions are caused by bacteria.20 This bacterial dogma had several consequences. Clinical management and research became largely focused on vaccines, microbial diagnosis, antimicrobials, antibiotics, dental plaque, and immunology. Clinical diagnoses that did not fit the infection paradigm (e.g., periodontal atrophy) became eliminated from some periodontal disease classifications, and it was hypothesized that periodontal infections caused systemic diseases.
Some of the essential characteristics of epidemiologic studies are that they are conducted in humans, that there is a control or a comparison group, and that clinically relevant endpoints are evaluated. Studies that are commonly cited in support of the periodontal infection hypothesis often lack these elements. For instance, is a “burst” of bone loss23 subsequent to the injection of Bacteroides gingivalis in an animal model proof that “this microorganism [is] of great importance to the control of destructive periodontal disease”? In a modern evidence-based world, data from animal studies would be considered the lowest level of evidence to make the infection dogma a cornerstone of clinical thinking.
Epidemiologic studies, which are higher level than case–control studies and animal studies, have had a powerful impact on the incidence of some chronic diseases by reliably identifying the primary causes. Reliable evidence on what causes disease allows laboratory research to focus on sabotaging the causal pathways of disease, which can then lead to clinical trials. “Medical science continually passes the baton of discovery from [epidemiologic] observation to laboratory studies to human clinical trials.”45 For example, epidemiologic observations identified hepatitis B as the main cause of liver carcinoma, which is one of the most common cancers in the world.4 Subsequently, the baton of discovery was passed to basic science, with which a recombinant engineered vaccine for hepatitis B was developed. Then, the baton of discovery was passed to clinical epidemiologists, who assessed the effectiveness of vaccinations and documented dramatic declines in mortality rates from liver cancer.44 Similar success stories in the management of chronic diseases in which epidemiology played a critical role include coronary heart disease and blood pressure medication, dental caries and fluoride, and lung cancer and smoking intervention programs.
The emerging epidemiologic evidence regarding the cause of periodontal diseases suggests that factors such as cigarette smoking, sugar, cereals, and some of the consequences of conditions such as obesity and diabetes could be primary causes of periodontal disease and that their effect on the periodontium could be unrelated to infectious factors.6,24,65 Organizations such as the World Health Organization suggest that periodontal disease prevention be made an integral part of programs that focus on tobacco control, diet, and physical activity.57 Regardless of your current beliefs about the causes of periodontal disease, it may become important to become familiar with epidemiologic methodology to be able to judge this emerging evidence independently and critically.
Measuring the Occurrence of Conditions or Diseases
As an example of prevalence, the Centers for Disease Control and Prevention reported about the prevalence of individuals with at least one periodontal pocket depth of 4 mm or deeper. It was reported that, from 1988 to 1994, a little more than 1 in 5 Americans had such a condition, for a prevalence of a little more than 20%; from 1999 to 2004, only 1 in 10 Americans fell into this category,16 for a prevalence of around 10%. These findings suggest a more than 50% decline in the prevalence of pocket depths greater than or equal to 4 mm for adults between the ages of 20 and 64 years, which occurred over approximately a decade. These epidemiologic data confirm another report of declining destructive periodontal prevalence in the United States.8 Such information about prevalence measures of periodontal conditions may have implications for manpower needs in the United States and may provide clues with respect to the causative factors that drive such changes. Many countries do not have prevalence surveillance systems,57 which makes it difficult to determine whether these trends observed in the United States are isolated events or part of a more general trend.
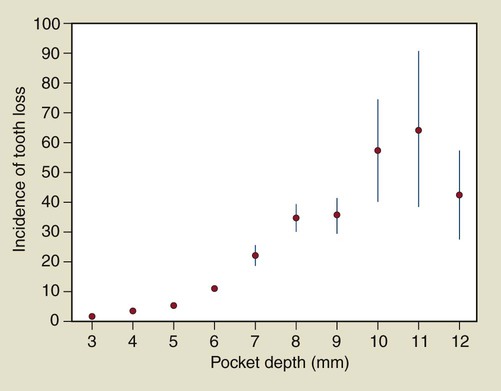
An example of the application of rates is provided in Figure 4-1, in which the number of teeth lost per 1000 tooth-years is plotted as a function of the maximum probing depth at the start of follow up. The plot suggests a nonlinear relationship between maximum pocket depth and tooth loss, with a substantial increase in tooth loss rate for teeth that have periodontal pockets of 7 mm or deeper.
Periodontal Conditions Typically Measured Clinically
Two common measures of gingival inflammation are the Gingival Index (GI) and bleeding on probing.27 The GI was proposed in 1963 as a method for assessing the severity and quantity of gingival inflammation.47,48 With this particular index, only gingival tissues are assessed. Each of the four gingival areas of the tooth (i.e., facial, mesial, distal, and lingual) are assessed for inflammation and rated as normal gingiva (a score of 0) to severely inflamed gingiva with a tendency to spontaneously bleed (a score of 3). Gingiva that is mildly inflamed but without bleeding on probing is given a score of 1, whereas moderately inflamed gingiva with bleeding is given a score of 2. The scores can be averaged for each patient to provide patient means. Alternatively, site-specific analyses can relate local and patient-specific factors to the GI that is measured at individual sites.14
Bleeding on probing is another measure of periodontal inflammation. The specific approach to obtain a bleeding measure can vary from one study to the next as well as from one clinician to another. For example, in the Third National Health and Nutrition Examination Survey (NHANES III),54 bleeding measures were obtained as follows. First, the facial and mesiofacial sites of teeth in two randomly selected quadrants—one maxillary and one mandibular—were selected. A special probe known as the National Institute of Dental Research probe was used in these assessments. This color-coded probe is marked at 2, 4, 6, 8, 10, and 12 mm. To begin the assessment, the examiner dried a quadrant of teeth with air. Then, starting with the most posterior tooth in the quadrant (excluding the third molar), the examiner placed a periodontal probe 2 mm into the gingival sulcus at the facial site and carefully swept the probe from the mesiofacial to the mesial interproximal area. After probing the sites in the quadrant, the examiner assesses the presence or absence of bleeding at each probed site. The same procedure was repeated for the remaining quadrant.
Commonly used measures of periodontal tissue destruction include mean probing depth, mean attachment loss, and mean recession level.35 The clinical protocols regarding how such mean values are collected and calculated can vary considerably. One example of how such values can be ascertained clinically is described in the National Institute of Dental and Craniofacial Research “periodontal destruction” examination.54 This examination includes an assessment of periodontal attachment loss61 as the distance in millimeters from the cementoenamel junction to the bottom of the gingival sulcus. This distance was measured at the facial and mesiofacial sites of teeth in a randomly selected maxillary and mandibular quadrant with the use of the indirect measurement method developed by Ramfjord.61
Translating Periodontal Conditions into Traditional Epidemiologic Measures of Disease Occurrence
The application of the traditional epidemiologic methods of risk, prevalence, and rate was challenging, because medical epidemiologists typically deal with patients. Dental epidemiologists deal with as many as 188 sites per patient. These periodontal sites within patients are correlated with many host-related factors. For example, gingival bleeding is suppressed in smokers.7 Therefore, bleeding on probing in periodontal sites in smokers tends to be more alike than bleeding on probing in periodontal sites among nonsmokers. Sites within patients are not statistically independent. The statistical methodology that is used to deal with correlated observations can be complex, and, for most of the twentieth century, it was challenging to calculate the confidence intervals for site-specific risks or prevalence.37 As a result, clinicians could not obtain reliable information about whether a periodontal site colonized with a particular microbiologic species was at an increased risk for periodontal attachment loss. These challenges may have hampered progress in the building of causal models of periodontal disease.
The advent of modern statistical techniques to deal with the problem of correlated data made it possible to avoid summarizing site-specific information at a patient level.14,15,31,36,37 These methods allow for the exploration of the role of patient- and site-specific factors in local site-specific events. For example, this can be used to determine whether the 3-mm loss of attachment at a site is related to site-specific factors (e.g., microflora present at that site), host factors (e.g., serum cotinine levels), or an interaction between a site-specific factor and a host factor.
True and Surrogate Measures of the Periodontal Condition
The epidemiologies of true and surrogate endpoints of periodontal disease do not necessarily coincide. True endpoints are tangible outcomes that directly measure how a patient feels, functions, or survives.18 True endpoints include oral-health–related quality-of-life measurements43,51,69 and self-reported problems, such as a positive answer to the following question: “When you brush or floss your teeth, do you notice bleeding that is both regular and that involves spitting blood-stained saliva?” Surrogate endpoints are intangible to the patient.72 Surrogate endpoints in periodontal research include anatomic measures (e.g., probing depth), measures of inflammation (e.g., bleeding), microbiologic measures, and immunologic measures.14 Surrogate endpoints are often objective, because they can be measured by the clinician (rather than relying on self-report by patients) or by laboratory methods.
Surrogate endpoints can be misleading when the goal is to provide reliable information about clinical decisions related to diagnosis, cause, treatment, or prognosis. An overview of situations in clinical research in which surrogate endpoints have led to misleading conclusions is provided in Table 82-1 on the Expert Consult website. One periodontal example is the use of systemic antibiotics that may have a beneficial impact on attachment gain20 but a potential increased risk for tooth loss.12
Challenges of Obtaining Epidemiologic Measures of Periodontal Conditions and Diseases
The diversity of measures used to assess periodontal condition or disease is staggering. One survey of periodontal clinical trials conducted over a mere 4-year period indicated that a total of 153 distinct surrogate endpoints were defined and that more than 80% of these endpoints were used in fewer than 5 of the 82 trials.27 Another survey similarly identified the diversity of methodologies and definitions as a challenging issue when systematically reviewing evidence.66 This continuous creation of “new and improved” surrogate outcomes in periodontal research is likely an important driver of false-positive conclusions.30
The type of periodontal measures that are favored also depend on the era. Russell developed the Periodontal Index,64 which scored the supporting tissues for each tooth in the mouth according to a progressive scale that gives little weight to gingival inflammation and relatively great weight to advanced periodontal disease. Although the Periodontal Index was used in the first NHANES, thereby gaining national prominence in the United States, it was never used again in any of the subsequent NHANES versions. Since then, most periodontal surveys in the United States have employed different examination protocols. Most recently, the survey methodology was changed yet again.17 Studies of decreases in the use of scaling and root planing procedures in the state of Washington and at a national level,9,62 long-term trends in decreasing edentulism, and decreasing periodontitis prevalence estimates in those national surveys with consistent methodology16 suggest that periodontitis prevalence in the United States is dropping rapidly (Tables 4-1 and 4-2).
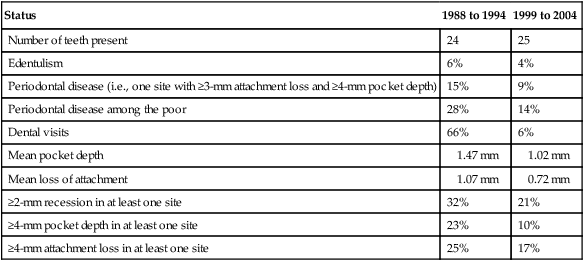
TABLE 4-1
Periodontal Status of the United States Population Among Adults Between the Ages of 20 and 64 Years
| Status | 1988 to 1994 | 1999 to 2004 |
| Number of teeth present | 24 | 25 |
| Edentulism | 6% | 4% |
| Periodontal disease (i.e., one site with ≥3-mm attachment loss and ≥4-mm pocket depth) | 15% | 9% |
| Periodontal disease among the poor | 28% | 14% |
| Dental visits | 66% | 6% |
| Mean pocket depth | 1.47 mm | 1.02 mm |
| Mean loss of attachment | 1.07 mm | 0.72 mm |
| ≥2-mm recession in at least one site | 32% | 21% |
| ≥4-mm pocket depth in at least one site | 23% | 10% |
| ≥4-mm attachment loss in at least one site | 25% | 17% |
Stay updated, free dental videos. Join our Telegram channel
VIDEdental - Online dental courses


