Part 4: Radiological pathology of the extragnathic head and neck regions
Chapter 16
Introduction
This chapter introduces some important anatomical and technical aspects of the radiology of those lesions that present outside the maxillofacial regions. The extragnathic head and neck will be considered as two separate anatomical regions, the skull and the neck. The benign and malignant lesions affecting either or both of these regions are addressed respectively in Chapters 17 and 18.
The Skull
This section places particular emphasis on the base of a skull, which appears increasingly within moderate-to-large fields of view (FOVs) for cone-beam computed tomography (CBCT) (Figure 16.1). Although it is generally held that this area is properly the purview of the medically trained head and neck or neuroradiologist, it is important that the oral and maxillofacial practitioner prescribing and interpreting these images be aware of some of the important lesions that may incidentally present (Figure 16.2). Knowledge of such lesions enable those practitioners to recognize the abnormality and refer it promptly and appropriately. It is expected that datasets of moderate-to-large FOVs would be reported by a radiologist (see Chapter 5).
Figure 16.1. A flowchart of the important and/or more frequently occurring lesions affecting the skull.
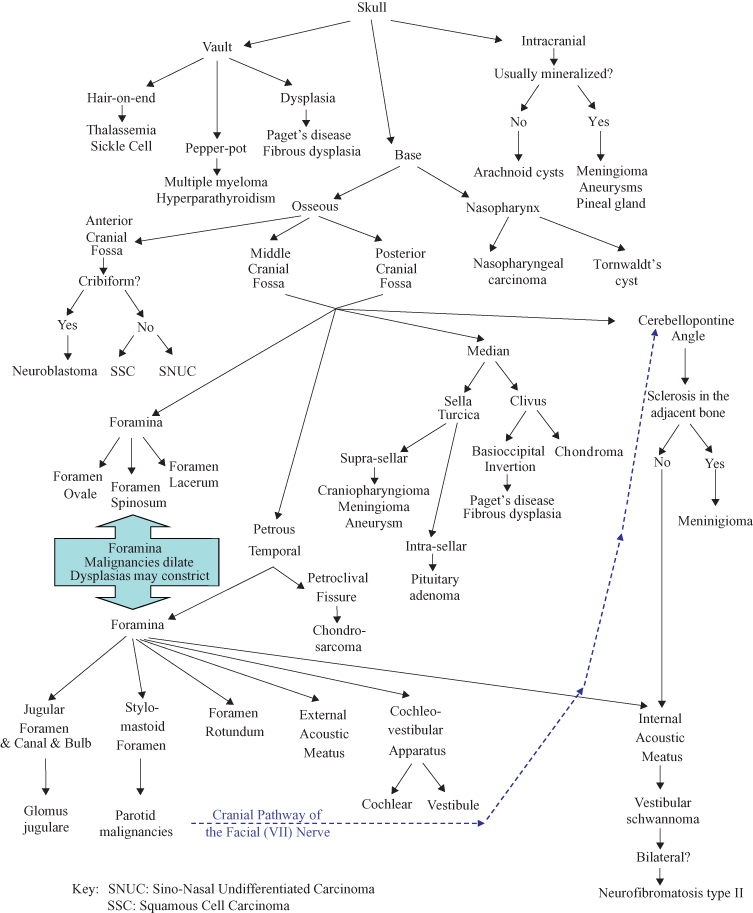
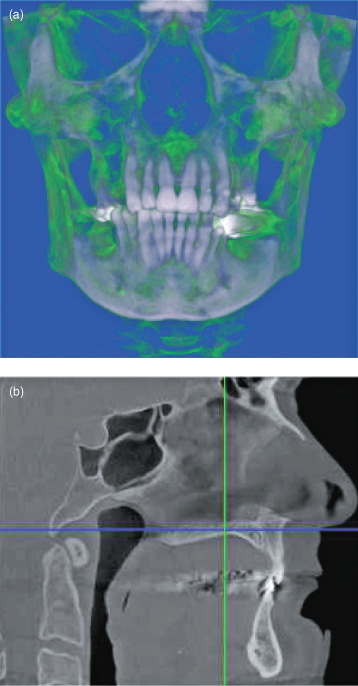
Figure 16.2. Cone-beam computed tomography (CBCT) as part of the assessment of a patient being considered for osseointegrated implants in both jaws. This was made on an iCAT type of CBCT unit with its large field of view. It can be seen that the base of the skull has been captured in (b). Figures courtesy of Dr. Babak Chehroudi, Faculty of Dentistry, University of British Columbia.
BASIC ANATOMY OF THE SKULL BASE
The anatomy of the skull base is both complex and subject to much variation, such as asymmetrical pneumatization and the appearance of the foramina, which can present as pseudolesions.1 The base of the skull is divided into three fossae: anterior cranial fossa (ACF), middle cranial fossa (MCF), and posterior cranial fossa (PCF).2 The boundary between the ACF and MCF is the posterior margin of the lesser wing of the sphenoid. The boundary between the MCF and PCF is delimited by the posterior superior margin of the petrous temporal bone and the posterior clinoid process of the body of the sphenoid. The emphasis of this chapter is placed on the MCF and PCF because they are most likely to appear on the moderate-to-large FOV CBCT images. Of these, the portions of the base of the skull that are most likely to be captured are the clivus and petrous temporal bone (Figure 16.3). Some important lesions that may affect the orbit have been considered, because the orbit is just as likely to be captured as the MCF and PCF.
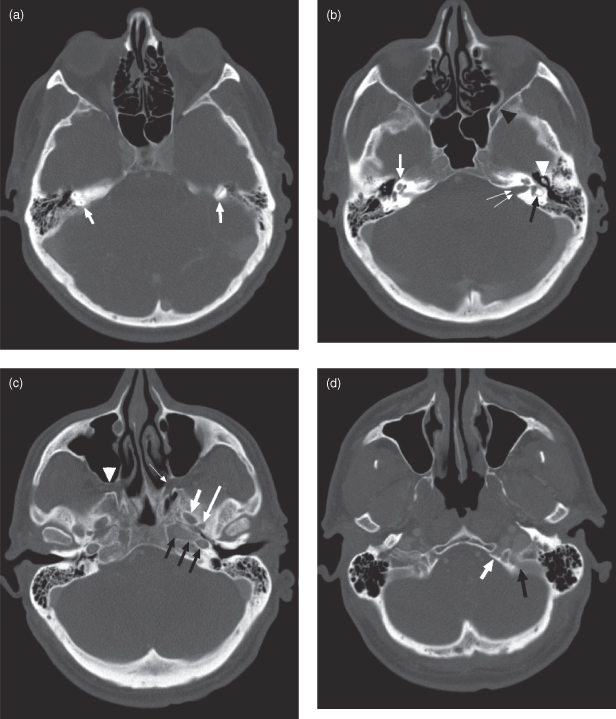
Figure 16.3. Computed tomography; normal axial sections (bone windows). (a) At the level of the base of the sella turcica, showing ethmoid and superior mastoid air cells. The vertical semicircular canals of the inner ear are visible within the petrous temporal bone (arrows). (b) At the level of the left internal auditory canal (double arrows). The cochlea of the inner ear are visible (single white arrow) and the “signet ring” shape of the left horizontal semicircular canal is seen (black arrow). The ossicles of the middle ears are visible, more so on the left (white arrowhead). The left inferior orbital fissure is marked with a black arrowhead. The ethmoid, sphenoid and mastoid air cells are visible. (c) At the level of the condylar head. The foramen ovale (short white arrow) and spinosum (long white arrow) are visible. The left carotid canal is seen ending medially at the foramen lacerum (black arrows). The pterygopalatine fossa is shown on the left (white arrowhead) and the sphenopalatine foramen on the right (thin white arrow). The conchae (turbinates) are partially visualized in the nasal cavity. (d) At midmaxillary sinus level. The nasal cavity and posterior nasopharynx are visible. The hypoglossal canal (white arrow) and jugular foramen (black arrow) are visible on the left. The mastoid air cells are extensively pneumatized.
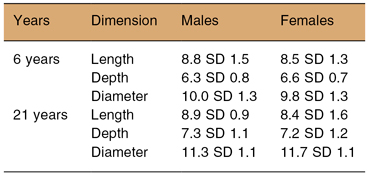
The sella turcica (ST), sometimes called the pituitary fossa is a salient point in cephalometry essential for the diagnosis and treatment planning of craniofacial abnormalities. Although significant differences in skeletal class of the face and jaws were found only between Skeletal Class II and Class III (the former has smaller ST diameters, the latter has larger diameters),3 this opportunity should also be used for assessment of the size and shape of the ST that may arise from other causes. The dimensions of a normal ST are set out in Table 16.1.4 The dimensions of the ST are larger in the older patient.4
Table 16.1. Dimensions between 6-year-olds and 21-year-olds of both genders (derived from Axelsonn et al.3
CROSS-SECTIONAL IMAGING OF THE SKULL BASE–MRI AND CT
Current imaging of skull base relies heavily on computed tomography (CT) and magnetic resonance imaging (MRI). Helical computed tomography (HCT) is superior to MRI for evaluating bone erosion and destruction, particularly if the unit used has a high spatial resolution. A rudimentary knowledge of skull base structures and foramina is required for both interpreting the spread of cancer through the skull base and searching for certain neurogenic tumors (such as schwannomas). Some cases occur within foramina. In particular, the pterygopalatine fossa, sphenopalatine foramen, foramen rotundum, inferior orbital fissure, carotid canal, and jugular/hypoglossal foramina should be studied (see Figure 16.3).
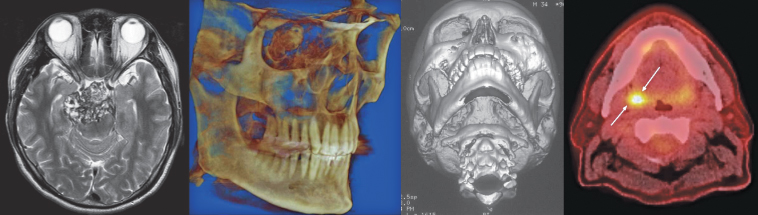
MRI is introduced in Chapter 6. It is excellent for visualizing soft-tissue involvement, including the bone marrow. For the head and neck, precontrast MR images are usually first acquired in axial/sagittal planes with T1-weighting. T1-weighted images show anatomy well with good contrast between muscles and intervening fat planes (Figure 16.4a,b). This is because on T1-weighted images muscles are relatively dark (isointense) and fatty tissue is bright, or more accurately of high signal intensity (hyperintense). In adults, bone marrow is normally bright due to fatty infiltration. When tumor, infection, or inflammation displaces fatty marrow, it becomes “dark” on T1-weighted images, making MRI exquisitely sensitive for detecting these pathologies (e.g., Figure 18.19c). Be aware that in younger people the bone marrow is not yet fatty and may be normally dark on T1-weighted images. Fatty marrow replacement occurs at different times in different bones; in the mandible it generally happens between 10–15 years />
Stay updated, free dental videos. Join our Telegram channel
VIDEdental - Online dental courses


