13
Visualizing Facial Growth
Clinicians are familiar with visualizing facial changes from longitudinal growth studies using sequential lateral cephalometric line drawings superimposed on the sella – nasion line at the sella. One of the fundamental challenges in assessing facial growth is to identify structures in the facial – skeletal framework that are unlikely to change or will undergo minimal change as a result of craniofacial development.
A radiograph is influenced by projection and interpretation errors, and researchers have focused on superimposition points identified on the midline landmarks. However, the radiographic identification of midline structures is far from easy, and consequently the resulting sequential radiograph superimpositions are subject to positional errors (vertical, anteroposterior, and rotational).1-4 The positional error is highlighted over the course of orthodontic treatment (18 months) with a significant increase in size in the frontal sinus associated with inferior placement of the nasion locator (Figure 13.1).
For ease of use, clinicians have been trained to apply superimposition techniques on the sella – nasion line registered at the sella for assessing treatment outcomes. Evidence informs us that both the sella and the nasion move until late adolescence, and the resulting registration of the radiographs on the point sella will result in the projection of the face downward and forward in the vast majority of cases, the minority of cases exhibiting vertical and backward rotations (Figure 13.2).3 Without a suitable reference structure, it is almost impossible to evaluate the influences of clinical interventions on craniofacial structures with a high degree of confidence.
With the questionable diagnostic value of lateral cephalograms associated with the known risks of exposure to radiation, a valid alternative is required for clinicians to determine the influence of clinical interventions on facial growth and the craniofacial complex on a routine basis. In addition, the meaningful effects of orthodontic care are often mostly visible through dental alignment and facial soft tissue harmony. There are many systems available to evaluate dental changes, but very few for facial soft tissues.5
Figure 13.1 Change in skeletal structures during the course of orthodontic treatment. There has been a significant thickening of the frontal bone resulting in a displacement of the nasal locator downward. There have been small but significant changes in the cranial base, maxillary, and mandibular complexes that make registration difficult and inappropriate on the sella – nasion line.
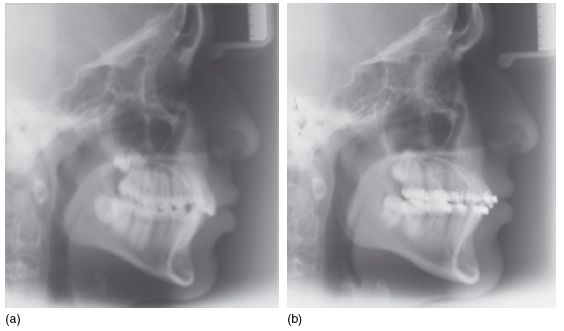
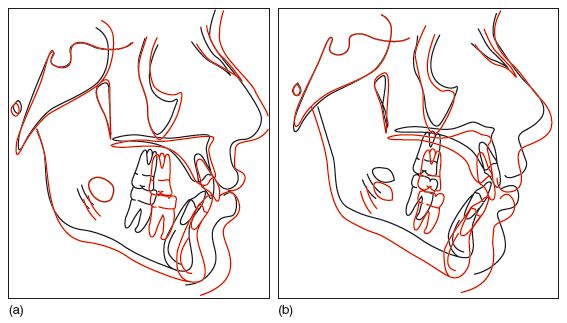
Figure 13.2 Pre- and post-treatment cephalometric tracings superimposed on the sella – nasion line at the sella, indicating a downward and forward movement (a; tracing of the radiographs in Figure 14.1) and a downward and backward movement (b).
STANDARDIZED REFERENCE FRAMEWORK
It has been only in the last 10 years that reasonably priced, readily available noninvasive three – dimensional (3D) surface scanning equipment has become available, facilitating the detailed accurate analysis of facial soft tissues for routine clinical practice. These systems can capture surface data in static and dynamic modes. The 3D facial data obtained still require the basic prerequisites to enable a valid sequential analysis of facial growth, that is, an origin and reference landmarks/planes (x–y, x–z, and z–y) that do not move or move least over time (Figure 13.3).
The landmarks that appear to move least are the inner canthi. Several reports have suggested that these points move posteriorly over time, although it is unclear whether these points actually move distally or are a function of the type of alignment used (e.g., best -fit or generalized Procrustes analyses) and their relative position in relation to other facial landmarks.6,7,8 There is a small increase (less than 2 mm) in width between the inner canthi from 12 to 16 years old, generally the greatest increase in distance occurring between 10–18 months and 2–12 years of age.9,10 The inner canthi are often used as markers of facial dysmorphia.9,11
To establish a reference framework, it is possible to align the facial shell to a transverse plane (x–z) passing through the inner canthi, and a sagittal plane (y–z) passing through the middle of the face, as outlined in Chapter 7.
Figure 13.3 The face has been aligned to the inner canthal and sagittal planes. However, if the coronal plane is not set according to natural head posture, there will be a tendency for the face to rotate forward or backward on the x- axis through the inner canthi. (Geomagic Qualify; Geomagic, Inc., Research Triangle Park, NC, USA.)
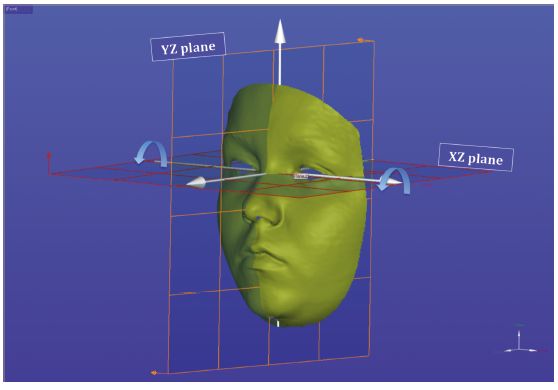
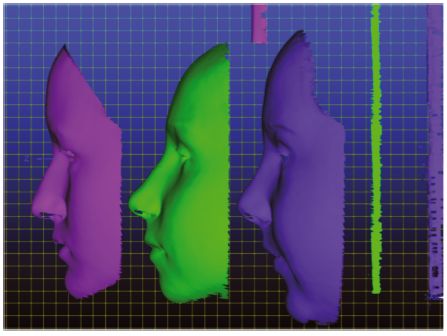
Figure 13.4 Three 12- year- old faces aligned to natural head posture and the inner canthi, indicating differences in positioning of the head, facial size, and shape. The vertical lines indicate the “true” vertical of the reference framework. The left facial shell shows an individual with a short flat face; the middle shell shows a more convex face with prominence of the lower face; the convex long face on the right shows less prominence of the lower facial third. The differences in face height and facial prominence exceed 15 mm (left compared with right). (Geomagic Qualify; Geomagic, Inc., Research Triangle Park, NC, USA.)
The face can, however, rotate about the x– axis, and the face will require a reference to the true vertical (Figure 13.3). The alignment to true vertical is necessary and determined by positioning the head using the technique of natural head posture (NHP). To reproduce the positioning of the head in space, it is necessary to reference the face to the true horizontal and vertical, and this can be achieved using a vertical and horizontal framework.
The NHP has been reported as highly reproducible.12,13 It must be remembered that not all individuals hold their heads in a similar posture. That is, different individuals may face straight forward or slightly upward or downward (Figure 13.4). It may be possible to create an average NHP to facilitate comparisons between individuals. However, growth changes are most likely to be valid when comparing changes in individuals with respect to their own NHPs.
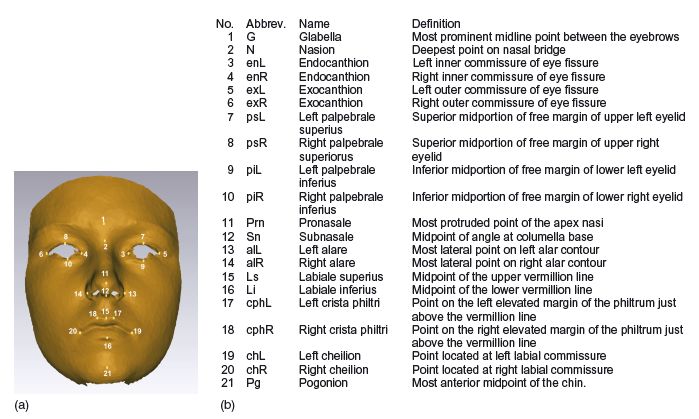
Clinicians have evaluated face shape and size using simple cephalometric assessments, such as the ANB points and maxillary – mandibular plane angles in association with facial proportions. 3D imaging provides the opportunity to reclassify facial morphology. Using 21 facial landmarks (Figure 13.5), it is possible to highlight their spatial distribution in a population. 14 Although 21 landmarks can be identified, certain landmarks are considered to be more reproducible than others (e.g., the inner canthi compared with exocanthi; see Table 7.1).15,16
Figure 13.5 Twenty- one soft tissue landmarks used to explore facial variation.
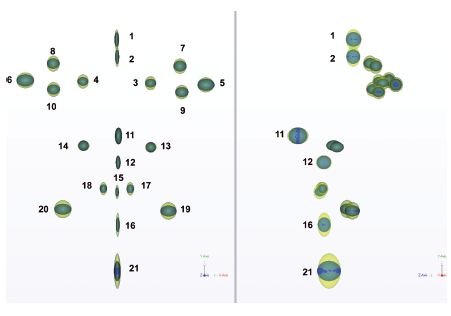
Three hundred and fifty 15- year- olds (184 males and 166 females) were recruited from the Avon Longitudinal Study of Parents and Children (ALSPAC). ALSPAC is a longitudinal birth cohort study of the determinants of development, health, and disease during childhood and beyond.17 The distribution of facial landmarks was explored using two methods of registration. In the first method, translation and rotation, and in the second uniform scaling, translation, and rotation, aligned the facial shells. Generalized Procrustes analysis18 was used to provide the best-fit of the landmarks only. The former approach is applied where both size and shape variations are equally important. The latter approach is used in morphometrics, where the focus is on shape variation only.18,19
The landmark distributions about their centroids, obtained with the two methods of alignment, are depicted as sets of ellipsoids whose semi- axes are equal to the standard deviation of the landmark position in the x-, y-, and z-axis, respectively. The first distribution of points (yellow) clearly shows a significant vertical component around the eyes, lips, pronasale, and chin. When the points have been adjusted for size (height, width, and depth) using uniform scaling (blue), the distribution of points show less variation with small discrete clusters. The difference between the two plots is emphasized when they are superimposed (Figure 13.6). The midline points show greater variation in the y– and z-axes compared with the x-axis.
Figure 13.6 The distribution of facial landmarks about their centroids for 350 15- year- olds. The ellipsoids represent the standard deviations of the landmark position in the x-, y-, and z- axes for face alignment considering both size and shape (yellow) and shape only (blue). (Left) front view, and (right) lateral view.
Clearly, face height, width, and depth (size) are important in orthodontics as patients often present with particularly challenging malocclusions such as long and short faces. These face types have validity with genotype -facial phenotype associations.20
The study of the unscaled data on 350 15- year- old children using principal component analysis18 identified three major components that e/>
Stay updated, free dental videos. Join our Telegram channel
VIDEdental - Online dental courses


