Superimposition of serial radiographs on a stable reference structure is necessary to evaluate growth or treatment changes. Three-dimensional (3D) imaging from cone-beam (CB) computed tomography (CT), axial CT, magnetic resonance imaging (MRI), or surface laser scans offers improved diagnostic information and, perhaps more importantly, provides a better way to evaluate the changes resulting from treatment and the consequent skeletal and soft tissue adaptive responses to treatment. In two-dimensional (2D) cephalometrics the cranial base is often used for this purpose because it shows minimal changes after neural growth is completed. The 2D cephalometric representations of the 3D craniofacial structures cannot answer many questions regarding treatment-response mechanisms and localized changes resulting from growth. In contrast, 3D assessments provide substantial information in this regard, but pose a challenge in the choice of superimposition landmarks and structures. Although 2D landmark location is hampered by identification of hard and soft tissues on x-ray films due to the superimposition of multiple structures, locating 3D landmarks on complex, curving structures is significantly more difficult. As Bookstein noted, there are no suitable operational definitions for craniofacial landmarks in the three planes of space: coronal, sagittal, and axial.
In the context of facial changes, superimposition should not rely on landmark identification or on “best-fit” techniques on structures that change with growth and treatment. Maxillomandibular changes need to be assessed relative to stable structures that have not been altered with growth or treatment. To better understand soft and hard tissue facial forms and changes with growth and treatment, as well as to create normative databases and predict changes, registration on the whole surface of the cranial base is the best method. This chapter demonstrates the use of a fully automated, voxelwise, rigid registration at the cranial base and application of 3D superimposition methods to evaluate anatomical structures displaced by growth, surgery, or other treatment.
METHODOLOGY FOR SURFACE REGISTRATION
Image Acquisition
The use of 3D images for treatment planning and follow-up raises concerns regarding radiation dose. Cone-beam CT (CBCT) equipment specialized for maxillofacial imaging now offers a relatively low-dose and convenient way to follow changes in facial morphology in three dimensions. CBCT scans of the cases presented in this chapter were acquired with the NewTom 3G (AFP Imaging, Elmsford, N.Y.), with a 36.3-microsievert (µSv) acquisition dose for a maxillary and mandibular scan. This is a major reduction from 314 µSv for conventional axial CT. There is a decrease in the signal/noise ratio with CBCT, but there is complete visualization of the facial structures, with spatial resolution of 0.36 mm in isotropic voxels. The imaging protocol used a 12-inch field of view to include the entire facial anatomy.
Image Analysis
Analysis of serial CBCT images to evaluate changes over time is done in a sequence of four steps: (1) model construction, (2) image registration, (3) transparency overlay, and (4) quantitative measurement.
Construction of virtual 3D surface models
Longitudinal quantitative assessment of growth and surgical correction requires construction of 3D surface models. The image-analysis tools for this purpose are modifications of open-source, freely available software from the U.S. National Institutes of Health (NIH, Bethesda, Md.).
Segmentation involves outlining the shape of anatomical structures visible in the cross sections of a volumetric data set from CBCT images and is performed with the Insight SNAP tool (Cognitica, Chapel Hill, N.C.). Many standard automatic segmentation methods fail when applied to the complex anatomy of patients with facial deformity. The methods described by Gerig et al. address these technical difficulties and have been adapted by Cevidanes et al. to construct 3D craniofacial models. The 3D virtual models usually are built from a set of about 300 axial cross-sectional slices for each image, with the voxels reformatted for an isotropic of 0.5 × 0.5 × 0.5 mm. This resolution is used because although higher spatial resolution with smaller slice thickness is possible, it increases image file size and requires greater computational power and user interaction time without significantly improving the quality of assessment of changes between time points. After segmentation with the Insight SNAP tool, these files are converted from volumetric data into surface meshes for the 3D shape-analysis procedures.
Image registration
Image registration is a core technology for many imaging tasks. The two obstacles to widespread clinical use of nonrigid (elastic and deformable) registration are computational cost and quantification difficulties as the 3D models are deformed. Nonrigid registration would be required to create a composite of several different jaw shapes to guide the construction of template or standard, normal 3D surface models. To evaluate longitudinal changes, however, rigid registration is acceptable.
Using rigid registration and imagine software, the authors mask anatomical structures displaced with growth or treatment and then perform a fully automated, voxelwise, rigid registration at the cranial base.
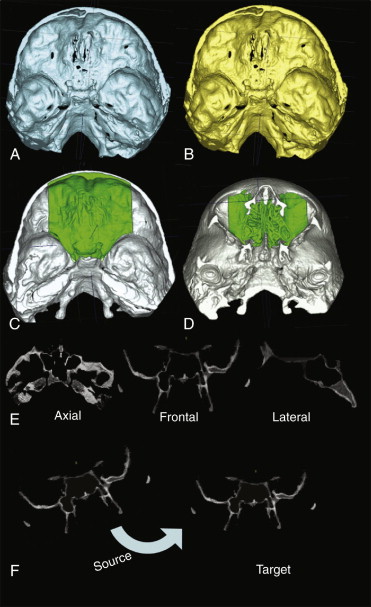
For superimposition of CBCT scans of subjects in whom cranial base growth is complete, registration of virtual 3D surface models is done using the whole surface of the cranial base ( Fig. 5-1, A and B ). To evaluate within-subject changes with growth and treatment, the anterior cranial fossae and the ethmoid bone surfaces can be used in the registration procedure because the growth of these structures is completed in early infancy. In this way the anterior cranial base of the CBCT images is used as the reference for superimposing different time points ( Fig. 5-1, C and D ). Rotational and translational parameters are calculated and then used to register 3D models from before and after treatment on the cranial base ( Fig. 5-1, E and F ). After registration, the overlay of the 3D models is assessed using University of North Carolina (UNC) Valmet and MeshValmet software (modifications of NIH Valmet). These software packages allow the visual and quantitative assessment of the location and magnitude of changes over time through graphical overlays and calculation of the euclidean distances between the surfaces of the 3D models at different time points.
Transparency overlay
The next step in the analysis involves overlaying the 3D model surfaces that are registered in the same coordinate system with another tool, CMF software (Maurice Müller Institute, Bern, Switzerland). This tool allows different degrees of transparencies to assess visually the boundaries of the maxillomandibular structures between superimposed models at two different time points. This clearly identifies the location, magnitude, and direction of mandibular displacements and also allows quantification of vertical, transverse, and anteroposterior bone displacements and remodeling that accompany growth and response to treatment.
Quantitative measurements
In evaluation of surgical treatment, precise quantitative measurement is required to assess (1) the placement of bones in the desired position, (2) the position of surgical cuts and fixation screws and plates relative to risk structures, and (3) the location and amount of posttreatment bone remodeling. Landmark-based measurements present errors related to landmark identification. Andresen et al. and Mitteroecker et al. proposed the use of “semilandmarks,” or landmarks plus vectors and tangent planes that define their location, but information from the whole curves and surfaces must also be included.
Gerig et al. proposed the use of color maps generated from closest-point distances between the surfaces. This method measures closest distances, not corresponding distances between anatomical points on two or more longitudinally obtained images. However, using the MeshValmet and CMF tools allows calculation of thousands of distances in millimeters between surface triangles at two different time points, so that the difference between the two surfaces at any location can be quantified. After combining all 3D models at various time points, specific regions of interest, such as the anterior surface of the maxilla, chin prominence, condyles, and posterior border of the rami, can be selected and analyzed ( Fig. 5-2 ).
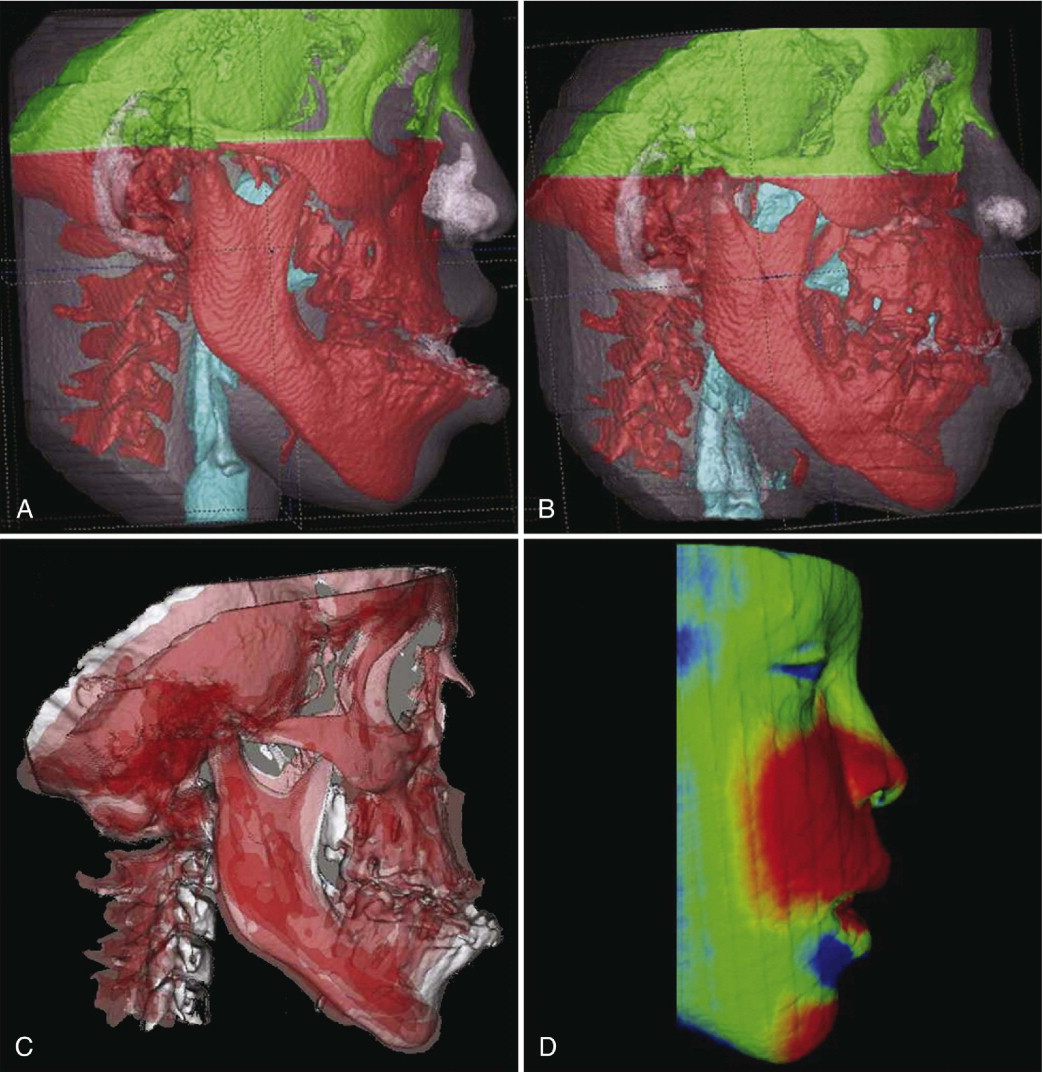
The quantitative changes are visualized using color maps, which can be used to indicate inward (blue) or outward (red) displacement between overlaid structures. An absence of displacement is indicated by the green color code. For example, in mandibular advancement, forward displacement would be shown in a red color code in the anterior surface of the chin and in a blue color code in the posterior surfaces. A medial displacement of the condyles and rami will display red medial surfaces and blue lateral surfaces. No postsurgical change would be shown as a green color. This method has been validated and used since 2005.
CLINICAL FINDINGS FROM 3D REGISTRATION ON CRANIAL BASE SURFACE
The authors have used longitudinal CBCT images to evaluate postsurgical changes in the position and contours of the maxilla and mandible (including changes in location and shape of condyles) relative to the registration on the cranial base surface. Longitudinal CBCT scans before surgery, immediately after surgery, at splint removal, and 1 year after surgery allow comparisons of changes between any selected times ( Figs. 5-3 and 5-4 ). Rotation of the mandibular rami results in short-term and long-term changes in the spatial position of the chin that can contribute or diminish the surgical correction ( Fig. 5-5
Stay updated, free dental videos. Join our Telegram channel
VIDEdental - Online dental courses


