Introduction
Because of limited available reference data, this study described the vertical growth changes that occur in untreated adolescents 10 to 15 years of age and evaluated the validity of measurements commonly used to classify patients’ vertical growth tendencies.
Methods
The sample consisted of 228 subjects (119 boys, 109 girls) between 10 and 15 years of age with normal occlusions or malocclusions who had lateral cephalograms (n = 1303) taken annually. Based on 6 landmarks, 3 angles (PPA, MPA, PP/MPA) and 2 proportions (PFH:AFH and UFH:LFH) were calculated. To reduce errors, each subject’s growth curve was estimated by using multilevel modeling procedures, and the estimated values were analyzed.
Results
Growth changes between 10 and 15 years for each of the 5 measurements followed relatively simple (linear or quadratic) polynomial models. On average, PPA and PFH:AFH increased, and MPA and PP/MPA decreased. The UFH:LFH ratio increased during the first few years and then decreased. MPA, PP/MPA, and PFH:AFH showed moderately high intercorrelations; PPA displayed moderate to moderately low correlations with UFH:LFH; UFH:LFH showed a moderate correlation with PP/MPA. Approximately 75% to 86% of the subjects classified as hyperdivergent or hypodivergent at 10 years maintained their classification. Subjects classified as hyperdivergent at 15 years of age showed significantly greater growth changes than did those classified within normal limits, who, in turn, showed greater changes than did the hypodivergent subjects.
Conclusions
Measurements typically used to classify vertical growth tendencies changed significantly during adolescence, with boys generally showing greater changes than girls. Although MPA, PFH:AFH, and PP/MPA measured the same phenotypic attribute, PPA and UFH:LFH were relatively independent of the other 3 measurements. Most subjects maintained their vertical facial types, but some worsened, and others improved.
Even through orthodontists have traditionally focused on anteroposterior dentoskeletal relationships, many malocclusions are due to abnormal vertical development. A thorough understanding of both normal and abnormal vertical growth is necessary to evaluate developing malocclusions and more effectively treat patients with hyperdivergent and hypodivergent phenotypes.
Although various measurements have been used to classify vertical malocclusions, their validity remains to be established. Classifications have been based on dental overbite, the upper-to-lower anterior facial height ratio, the posterior-to-anterior facial height ratio, the mandibular plane angle, the palatal plane angle, the palatal-to-mandibular plane angle, the gonial angle, and even the perception of increased or reduced lower facial height. In the only study in which the authors statistically evaluated whether typically used measurements reflect the same aspects of vertical discrepancy, Dung and Smith showed a high correlation (0.90) only between the mandibular plane angle and the posterior-to-anterior facial height ratio; of the remaining 20 correlations, 4 were moderately low, and the rest were low or very low. If the various measurements are more or less independent of each other, they represent different phenotypic attributes and cannot be used interchangeably for vertical classification of patients.
Reference data for longitudinal vertical growth of adolescents are inconsistent and limited. The palatal plane angle has been reported to increase between 10 and 15 years of age for girls and decrease for boys. With the sexes combined, the palatal plane angle has been shown to both increase and decrease. The upper-to-lower facial height and the posterior-to-anterior facial height ratios have also been reported to both increase and decrease during adolescence, depending on the sample and the sex. Although most studies have shown that the mandibular plane angle decreases during adolescence, Bhatia and Leighton showed slight increases between 10 and 15 years. The palatal-to-mandibular plane angle is the only measurement showing consistent changes (increases) across studies. Importantly, longitudinal reference data for adolescent vertical development are based on relatively small samples (usually <75 subjects), making it difficult to estimate the extreme percentiles, where many orthodontic patients might be expected to be located.
To determine the appropriate timing of treatment, it is also important to determine whether the growth patterns of untreated hyperdivergent or hypodivergent patients remain stable. Based on a sample of 20 male and 15 female subjects, Bishara and Jakobsen showed that 77% maintained their facial type between 5 and 25.5 years of age; the rest normalized, or became more hyperdivergent or more hypodivergent. Based on a larger sample, it has also been shown that 33% to 64% of those classified as having either high, average, or low mandibular plane angles at 6 years of age maintained their classification through age 15. Their mandibular plane angles either improved or worsened over time, but the differences averaged out because the growth curves representing the subsamples with high, average, or low angles maintained the group differences between 6 and 15 years.
Larger sample sizes and more reliable estimates of vertical growth are necessary to reconcile the inconsistencies. This project’s overall aim was to describe the vertical growth changes that occur during adolescence. The specific aims were to provide reference data for the vertical growth changes that occur; evaluate the associations between measurements used to describe vertical development; determine whether subjects classified as hypodivergent, within normal limits, or hyperdivergent maintain their classifications between 10 and 15 years of age; and compare growth changes of subjects classified as hypodivergent, within normal limits, or hyperdivergent.
Material and methods
A French-Canadian sample was collected by the Human Growth Research Center at the University of Montreal, Quebec, Canada. The subjects were drawn from 3 randomly selected school districts representing the socioeconomic background of the larger population. In each district, the subjects were chosen randomly from 107 schools, which had also been chosen at random. This mixed-longitudinal sample included 228 untreated adolescents (119 boys, 109 girls) between 10 and 15 years of age, with normal occlusions and malocclusions. Each subject had at least 4 serial radiographs available.
Lateral cephalograms (n =1303) were taken annually, usually within 12 days of the subjects’ birthdays. Based on 6 landmarks identified on each tracing, the following 3 angles and 2 proportions were computed.
- 1.
Palatal plane angle (PPA; S-N/PNS-ANS), the angle formed by the anterior cranial base and the palatal plane.
- 2.
Mandibular plane angle (MPA; S-N/Go-Me), the angle formed by the anterior cranial base and the mandibular plane.
- 3.
Palatal plane-mandibular plane angle (PP/MPA), the angle formed by the palatal plane and the mandibular plane.
- 4.
Posterior and anterior facial height proportion (PFH:AFH; S-Go:N-Me), the ratio of posterior facial height to anterior facial height.
- 5.
Upper and lower facial height (UFH: LFH; N-ANS:ANS-Me), the ratio of upper facial height and lower facial height.
The cephalograms were traced on acetate paper, and the landmarks were digitized by 1 operator. Replicate analyses of 60 randomly chosen cephalograms produced reliabilities for the 6 landmarks between 0.947 and 0.996, and method errors between 0.15 and 0.72 mm.
Statistical analysis
The first step of the analysis was to determine the shapes of the subjects’ average growth curves between 10 and 15 years of age. To this end, multilevel procedures were used to derive sex-specific polynomials for each of the 5 measurementss. Boys and girls were evaluated separately because of well-established growth differences. The shape of the average growth curve was determined by the order of the polynomial, which was estimated by the fixed part of the model. A linear polynomial is a straight line; a quadratic polynomial describes a curve. The terms of the polynomials provide information about the average size of the measurement at 12.5 years of age (constant term), the yearly growth changes (linear term), and the growth acceleration or deceleration (quadratic term). The random part of the model estimated between-subject variations at 1 level, and between ages, nested within subjects, at another level. Iterative generalized least squares were used to estimate the model parameters. Multilevel models (see Hoeksma and van der Beek for a more complete explanation of the procedures) are well suited for assessing mixed longitudinal data and have proven to be especially well suited for evaluating craniofacial growth.
After we determined the expected shape of the curves (ie, based on the order of the polynomials), we estimated each subject’s growth curves based on the average polynomials. In other words, each subject had a polynomial of the same order as the average polynomial that described his or her growth curves for each of the 5 measurements. The multilevel procedures provided residuals (differences between the average polynomial terms and each subject’s polynomial terms) for each subjects’ polynomials. The residuals made it possible to compute a separate and different growth curve for each subject. Because the polynomials represent the best fit of each subject’s curve, they eliminate within-subject variance (ie, technical error) and provide error-free (adjusted) growth estimates. By using each subject’s polynomial, adjusted growth estimates were computed at each whole year between 10 and 15 years of age.
Based on the subjects’ error-free estimates, percentiles were calculated for each measurement. The sample sizes made it possible to estimate the 5th and the 95th percentiles, as well as the 25th, 50th, and 75th percentiles. The subjects’ estimates at 10 and 15 years of age were used to classify them as hypodivergent (below the 25th percentile), within normal limits (between the 25th and 75th percentiles), or hyperdivergent (above the 75th percentile), and to evaluate changes in classification over time.
Pearson product-moment correlations were used to estimate the interrelationships between the 5 measurements at 15 years of age. Finally, analyses of variance (ANOVA), with Bonferroni post-hoc comparisons, were used to evaluate group differences in the growth changes between 10 and 15 years of age with SPSS software (version 15, SPSS, Chicago, Ill) at the 0.05 level of significance.
Results
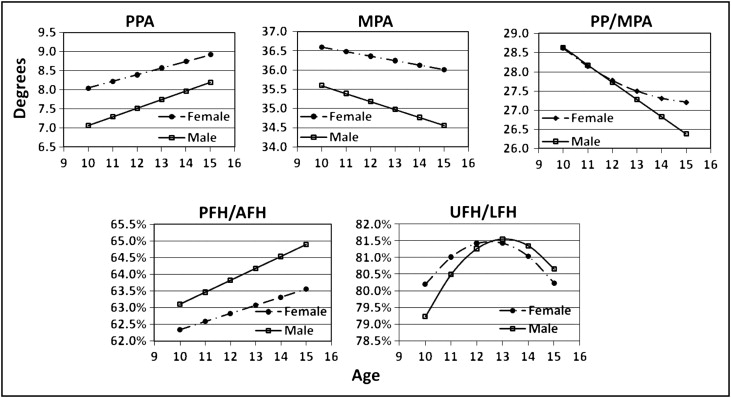
The multilevel models showed significant growth changes and sex differences for all measurements ( Tables I and II ). The polynomial models, explaining 92.5% to 95.7% of the total variations, followed either linear or quadratic patterns of change over time. The PPA, which was significantly larger in girls than boys at 12.5 years of age, increased significantly more over time in boys ( Fig 1 ). The MPA was larger in girls but decreased significantly more between 10 and 15 years of age in boys. The PP/MPA angle decreased linearly in boys and curvilinearly in girls (ie, they decreased more before 12.5 years of age than after that age). The PFH:AFH ratio was significantly larger and increased more in boys than in girls. The UFH:LFH ratio increased between 10 and 12 years and then decreased between 13 and 15 years of age, resulting in little or no change between 10 and 15 years in girls and a slight increase over time in goys. Percentile distributions were estimated based on the values computed from each subject’s growth curves ( Tables III and IV ).
| Constant (at 12.5 y) | Linear | Quadratic | ||||||
|---|---|---|---|---|---|---|---|---|
| Variable | Unit | Sex | Estimate | SE | Estimate | SE | Estimate | SE |
| PPA | ° | M | 7.6252 | .26965 | .22683 | .032211 | −.026811 | .013582 |
| F | 8.4813 | .21956 | .17423 | .031785 | ||||
| MPA | ° | M | 35.073 | .40361 | −.20846 | .044672 | ||
| F | 36.305 | .42807 | −.11612 | .0059376 | ||||
| PP/MPA | ° | M | 27.500 | .39719 | −.44789 | .046818 | ||
| F | 27.629 | .43560 | −.27898 | .048177 | .044448 | .020616 | ||
| PFH:AFH | % | M | .63998 | .0031156 | .0035563 | .00033898 | ||
| F | .62945 | .0033643 | .0024354 | .00040530 | ||||
| UFH:LFH | % | M | .81472 | .0062580 | .0028390 | .00075270 | −.0024350 | .00030463 |
| F | .81478 | .0055723 | .000061298 | .00068954 | −.0020210 | .00032739 | ||
| Between-subjects variation | Within-subject variation | ||||
|---|---|---|---|---|---|
| Variable | Sex | Constant | Linear | Quadratic | Constant |
| PPA | M | 8.8013 | .092876 | .0081867 | .46624 |
| F | 6.0430 | .085791 | .36678 | ||
| MPA | M | 19.920 | .15403 | 1.3378 | |
| F | 22.943 | .27806 | 1.5901 | ||
| PP/MPA | M | 19.263 | .17186 | 1.4056 | |
| F | 23.591 | .17730 | .012212 | 1.0489 | |
| PFH:AFH | M | .11841 | .00076783 | .0095829 | |
| F | .14246 | .0011978 | .0085664 | ||
| UFH:LFH | M | .47353 | .0051109 | .00035919 | .025582 |
| F | .37958 | .0035245 | .00041381 | .024374 | |
| Age (y) | |||||||||||||
|---|---|---|---|---|---|---|---|---|---|---|---|---|---|
| Male | Female | ||||||||||||
| Measurement | Percentile | 10 | 11 | 12 | 13 | 14 | 15 | 10 | 11 | 12 | 13 | 14 | 15 |
| PPA (°) | 5th | 2.18 | 2.18 | 2.20 | 2.29 | 2.35 | 2.51 | 4.53 | 4.82 | 4.85 | 4.85 | 4.91 | 4.86 |
| 25th | 5.20 | 5.32 | 5.57 | 5.87 | 5.86 | 5.69 | 6.39 | 6.54 | 7.08 | 7.08 | 7.15 | 7.30 | |
| 50th | 7.15 | 7.29 | 7.54 | 7.79 | 7.98 | 8.08 | 8.07 | 8.20 | 8.52 | 8.52 | 8.68 | 9.07 | |
| 75th | 9.24 | 9.49 | 9.68 | 9.90 | 10.17 | 10.44 | 9.39 | 9.56 | 9.84 | 9.84 | 10.06 | 10.35 | |
| 95th | 11.89 | 12.04 | 12.27 | 12.53 | 12.71 | 12.83 | 12.08 | 12.22 | 12.86 | 12.86 | 13.34 | 13.68 | |
| MPA (°) | 5th | 26.91 | 27.00 | 27.19 | 27.27 | 27.27 | 27.37 | 27.46 | 28.03 | 28.37 | 28.69 | 29.03 | 29.26 |
| 25th | 32.10 | 31.86 | 31.76 | 31.88 | 31.71 | 31.68 | 33.65 | 33.81 | 33.81 | 33.91 | 33.68 | 33.75 | |
| 50th | 35.20 | 35.12 | 34.97 | 34.78 | 34.55 | 34.35 | 36.35 | 36.30 | 36.25 | 36.26 | 36.04 | 35.99 | |
| 75th | 39.32 | 38.89 | 38.60 | 38.16 | 37.61 | 37.28 | 39.89 | 39.53 | 39.14 | 38.83 | 38.28 | 38.30 | |
| 95th | 44.46 | 44.22 | 43.41 | 42.81 | 42.10 | 42.29 | 44.95 | 44.78 | 44.28 | 43.81 | 43.89 | 43.96 | |
| PP/MPA (°) | 5th | 21.46 | 21.38 | 21.07 | 21.07 | 20.82 | 20.57 | 19.30 | 19.63 | 19.74 | 19.74 | 19.85 | 20.10 |
| 25th | 25.24 | 24.75 | 24.21 | 24.21 | 23.91 | 23.62 | 24.64 | 25.08 | 25.41 | 25.33 | 25.49 | 24.96 | |
| 50th | 28.26 | 27.75 | 26.58 | 26.58 | 25.93 | 25.78 | 27.97 | 28.09 | 27.91 | 27.68 | 27.51 | 27.61 | |
| 75th | 32.08 | 31.34 | 30.22 | 30.22 | 29.87 | 29.50 | 31.14 | 30.91 | 30.54 | 30.18 | 29.68 | 29.45 | |
| 95th | 38.66 | 37.92 | 36.45 | 36.45 | 35.28 | 34.21 | 36.86 | 36.74 | 36.29 | 35.86 | 35.49 | 35.47 | |
| PFH:AFH (%) | 5th | 58.35 | 58.50 | 58.63 | 58.62 | 58.97 | 59.13 | 57.12 | 57.39 | 57.50 | 57.62 | 57.74 | 57.85 |
| 25th | 60.92 | 61.17 | 61.41 | 61.68 | 61.95 | 62.13 | 59.91 | 59.97 | 60.17 | 60.31 | 60.38 | 60.29 | |
| 50th | 62.72 | 63.27 | 63.60 | 64.07 | 64.45 | 64.86 | 62.14 | 62.41 | 62.70 | 62.99 | 63.17 | 63.54 | |
| 75th | 65.28 | 65.69 | 65.88 | 66.36 | 66.89 | 67.37 | 64.34 | 64.52 | 64.73 | 64.88 | 65.24 | 65.51 | |
| 95th | 68.95 | 69.61 | 70.15 | 70.96 | 71.55 | 71.87 | 67.62 | 68.18 | 68.73 | 69.31 | 69.88 | 70.48 | |
| UFH:LFH (%) | 5th | 71.19 | 69.84 | 68.85 | 68.86 | 68.26 | 66.85 | 70.31 | 70.06 | 69.72 | 69.67 | 69.57 | 69.40 |
| 25th | 78.27 | 77.37 | 76.78 | 76.70 | 76.41 | 75.66 | 78.72 | 77.95 | 77.49 | 77.49 | 77.09 | 76.42 | |
| 50th | 82.33 | 82.33 | 82.33 | 82.28 | 81.73 | 80.45 | 83.50 | 82.76 | 82.15 | 81.99 | 81.38 | 80.50 | |
| 75th | 87.10 | 86.57 | 86.75 | 86.94 | 87.20 | 86.57 | 87.09 | 86.06 | 85.57 | 85.48 | 85.03 | 84.06 | |
| 95th | 92.72 | 92.51 | 92.63 | 92.67 | 92.79 | 93.00 | 92.01 | 90.82 | 90.41 | 90.71 | 90.73 | 89.86 | |
| Age (y) | |||||||||||||
|---|---|---|---|---|---|---|---|---|---|---|---|---|---|
| Male | Female | ||||||||||||
| Measurement | Percentile | 10–11 | 11–12 | 12–13 | 13–14 | 14–15 | 10–15 | 10–11 | 11–12 | 12–13 | 13–14 | 14–15 | 10–15 |
| PPA (°) | 5th | −0.02 | −0.06 | −0.16 | −0.45 | −0.71 | −0.79 | −0.25 | −0.51 | 0.00 | −0.25 | −0.25 | −1.26 |
| 25th | 0.22 | 0.15 | 0.05 | −0.05 | −0.15 | 0.26 | −0.03 | −0.05 | 0.00 | −0.03 | −0.03 | −0.13 | |
| 50th | 0.35 | 0.29 | 0.24 | 0.16 | 0.12 | 1.21 | 0.20 | 0.40 | 0.00 | 0.20 | 0.20 | 0.99 | |
| 75th | 0.46 | 0.42 | 0.43 | 0.46 | 0.49 | 2.14 | 0.35 | 0.69 | 0.00 | 0.35 | 0.35 | 1.74 | |
| 95th | 0.66 | 0.57 | 0.59 | 0.74 | 0.80 | 2.94 | 0.63 | 1.27 | 0.00 | 0.63 | 0.63 | 3.17 | |
| MPA (°) | 5th | −0.75 | −0.75 | −0.75 | −0.75 | −0.75 | −3.73 | −0.93 | −0.93 | −0.93 | −0.93 | −0.93 | −4.66 |
| 25th | −0.41 | −0.41 | −0.41 | −0.41 | −0.41 | −2.06 | −0.30 | −0.30 | −0.30 | −0.30 | −0.30 | −1.51 | |
| 50th | −0.20 | −0.20 | −0.20 | −0.20 | −0.20 | −0.99 | −0.08 | −0.08 | −0.08 | −0.08 | −0.08 | −0.39 | |
| 75th | 0.02 | 0.02 | 0.02 | 0.02 | 0.02 | 0.12 | 0.11 | 0.11 | 0.11 | 0.11 | 0.11 | 0.57 | |
| 95th | 0.30 | 0.30 | 0.30 | 0.30 | 0.30 | 1.50 | 0.52 | 0.52 | 0.52 | 0.52 | 0.52 | 2.61 | |
| PP/MPA (°) | 5th | −1.08 | −2.16 | 0.00 | −1.08 | −1.08 | −5.41 | −1.24 | −1.04 | −0.78 | −0.61 | −0.68 | −3.47 |
| 25th | −0.73 | −1.45 | 0.00 | −0.73 | −0.73 | −3.63 | −0.79 | −0.64 | −0.50 | −0.37 | −0.16 | −2.28 | |
| 50th | −0.39 | −0.79 | 0.00 | −0.39 | −0.39 | −1.97 | −0.57 | −0.44 | −0.32 | −0.18 | 0.07 | −1.39 | |
| 75th | −0.21 | −0.42 | 0.00 | −0.21 | −0.21 | −1.04 | −0.13 | −0.13 | −0.07 | −0.03 | 0.30 | −0.31 | |
| 95th | 0.07 | 0.14 | 0.00 | 0.07 | 0.07 | 0.35 | 0.71 | 0.55 | 0.41 | 0.29 | 0.65 | 1.79 | |
| PFH:AFH (%) | 5th | −0.04 | −0.04 | −0.04 | −0.04 | −0.04 | −0.18 | −0.31 | −0.31 | −0.31 | −0.31 | −0.31 | −1.56 |
| 25th | 0.22 | 0.22 | 0.22 | 0.22 | 0.22 | 1.10 | 0.06 | 0.06 | 0.06 | 0.06 | 0.06 | 0.30 | |
| 50th | 0.38 | 0.38 | 0.38 | 0.38 | 0.38 | 1.90 | 0.28 | 0.28 | 0.28 | 0.28 | 0.28 | 1.38 | |
| 75th | 0.50 | 0.50 | 0.50 | 0.50 | 0.50 | 2.48 | 0.42 | 0.42 | 0.42 | 0.42 | 0.42 | 2.12 | |
| 95th | 0.69 | 0.69 | 0.69 | 0.69 | 0.69 | 3.43 | 0.62 | 0.62 | 0.62 | 0.62 | 0.62 | 3.12 | |
| UFH:LFH (%) | 5th | −0.03 | −0.46 | −0.82 | −1.23 | −1.97 | −4.09 | −0.80 | −0.79 | −0.83 | −0.96 | −2.96 | −4.29 |
| 25th | 0.67 | 0.36 | −0.07 | −0.57 | −1.16 | −0.33 | 0.16 | −0.09 | −0.30 | −0.65 | −1.98 | −2.04 | |
| 50th | 1.34 | 0.79 | 0.24 | −0.12 | −0.62 | 1.19 | 0.86 | 0.42 | 0.04 | −0.42 | −1.49 | −0.67 | |
| 75th | 1.75 | 1.23 | 0.72 | 0.25 | −0.20 | 3.58 | 1.58 | 1.01 | 0.41 | −0.14 | −1.10 | 0.92 | |
| 95th | 2.53 | 1.92 | 1.33 | 0.74 | 0.31 | 6.66 | 2.33 | 1.56 | 0.75 | 0.15 | −0.18 | 2.41 | |
Stay updated, free dental videos. Join our Telegram channel
VIDEdental - Online dental courses


