Introduction
The aim of this study was to explore the biomechanical effects on the craniomaxillary complex of bone anchorage and dental anchorage during maxillary protraction.
Methods
We established 2 finite element models. One simulated maxillary protraction with dental anchorage in the maxillary first molars and the other with bone anchorage in the infrazygomatic buttresses of the maxilla. The magnitude of the applied forces was 500 g per side, and the force directions were 0°, 10°, 20°, and 30° forward and downward relative to the occlusal plane.
Results
The finite element model of the craniomaxillary complex could displace in an almost translatory manner when the force direction was about 20° in the bone anchorage model and about 30° in the dental anchorage model. The nodes representing the sutures at the back of the maxilla showed greater stress in the bone anchorage model than in the dental anchorage model in the same force direction. It is the opposite at the front of the maxilla.
Conclusions
We should determine the direction of applied force according to the anchorage location and skeletal characteristics of patients before maxillary protraction. The dramatic effects of maxillary protraction with bone anchorage can be based on the advantages of bone anchorage, not on the changes in the region of the applied force.
Conventional treatment for a Class III malocclusion with maxillary deficiency often uses maxillary protraction with an intraoral appliance and a facemask, especially at early ages. Some investigations have demonstrated the skeletal and dentoalveolar effects of this conventional dental anchorage appliance in a short-term treatment, including forward displacement of the maxilla, clockwise rotation of the mandible, protrusion of the maxillary incisors, and retrusion of the mandibular incisors. However, the skeletal effects of maxillary protraction are still controversial. In some long-term follow-ups, there were no significant between-group differences in skeletal changes, compared with a control group under the same conditions.
To improve the skeletal effects, osseointegrated implants, orthodontic miniscrews, and miniplates have been substituted for conventional dental anchorage and used as bone anchorage in maxillary protraction. Several studies have demonstrated the dramatic skeletal effects of maxillary protraction by using bone anchorage, especially with titanium miniplates in the infrazygomatic buttresses of the maxilla. However, there are great discrepancies in the locations of implants and the directions of orthopedic forces in these studies, and no study provides enough evidence for choosing them.
The locations of the implants and the direction of the orthopedic forces are important in the displacement and stress distribution of the maxilla during maxillary protraction and thus affect the prognosis of patients with a skeletal Class III malocclusion. A 3-dimensional finite element model could simulate maxillary protraction and predict the results of the displacement and the stress distribution of craniomaxillary complex. It might be helpful to improve the curative effects of maxillary protraction.
The aims of this study were to use the finite element method to investigate displacement and stress distribution in the craniomaxillary complex when bone anchorage is used in the infrazygomatic buttresses of the maxilla under different loading conditions during maxillary protraction and to compare them with the results of maxillary first molar anchorage.
Material and methods
Spiral computed tomography images (Somaton Lightspeed/64 Plus; GE Healthcare, Waukesha, Wis) of the craniofacial complex region (0.5-mm layer; voxel size, 0.44 × 0.44 × 0.5 mm 3 ) were obtained. The scan data were from a 12-year-old boy with a mandibular fracture; informed consent was obtained from the patient and his parents. The data were saved as digital imaging and communications in medicine (DICOM) files and then imported into Mimics software (Materialise, Leuven, Belgium) for 3-dimensional reconstruction. Hounsfield unit values from 226 to 3071 were used to identify and distinguish the craniofacial bone from other tissues. Once the craniomaxillary complex was identified, other bone sections were segmented by removing every pixel from each slice in the data set. The reconstructed geometry of craniomaxillary complex was exported in STL+file format as the geometric model with dental anchorage. This geometry was then merged with 3 cylinders (radius, 2 mm; length, 5 mm; made by the Mimics software) that simulated the miniscrews at each side of the infrazygomatic buttresses of the maxilla. The merged geometry was exported in STL+file format as the geometric model with bone anchorage.
The STL+file was imported into MSC.Marc (MSC Software, Santa Ana, Calif), which was used to generate a volume mesh from the 3-dimensional geometry of the craniomaxillary complex. The model with dental anchorage was meshed into 1,502,391 hexahedral elements (C3D8) and 1,764,020 nodes, and the model with bone anchorage was meshed into 1,901,821 hexahedral elements (C3D8R) and 2,239,849 nodes.
The meshed models were exported into Abaqus software (Abaqus, Providence, RI). The mechanical properties of the compact and cancellous bones, teeth, and miniscrews in this model were defined according to experimental data from previous studies ( Table ). The materials in the analysis were assumed to be linearly elastic and isotropic. An encastre boundary condition was imposed on the nodes along the foramen magnum.
| Material | Young’s modulus (kg/mm 2 ) | Poisson’s ratio |
|---|---|---|
| Compact bone | 1.37 × 10 4 | 0.3 |
| Cancellous bone | 7.9 × 10 3 | 0.3 |
| Tooth | 2.0 × 10 4 | 0.3 |
| Miniscrew | 1.05 × 10 5 | 0.33 |
We established 2 finite element models in this study. One model simulated maxillary protraction with dental anchorage in the maxillary first molars. In this model, a 500-g force per side forward and downward relative to the occlusal plane was directed about 2 mm superior to the border of the alveolar ridge between the medial and distal aspects on the first molar. The angles between the force vector and occlusal plane were 0°, 10°, 20°, and 30°, respectively. Another model simulated maxillary protraction with bone anchorage in the infrazygomatic buttresses of the maxilla by using titanium miniscrews. In the second model, a 500-g force per side was applied to the miniscrews in the infrazygomatic buttresses of the maxilla with angles between the force vector and the occlusal plane of 0°, 10°, 20°, and 30°, respectively ( Fig 1 ).

The superimposed contours of displacements were generated by the Abaqus software automatically when the superimposition button was chosen. The undeformed model (without applied force) was at the bottom and the deformed model (with applied force) was on it according to the 3-dimensional coordinates. All anatomic structures were a best-fit superimposition, since a 3-dimensional finite element model was generated under a 3-dimensional coordinate system. To make the deformation of the 3-dimensional models seen directly, the same local 3-dimensional coordinate system and amplification coefficient were set.
To measure the amount of displacement of the craniomaxillary complex, we selected some representative nodes in the frontal and sagittal planes. The displacement in the transverse plane was not analyzed, since the applied force was symmetrical in this plane. In the frontal plane, the vertical displacement of the complex was analyzed by measuring at 4 marker nodes, including the anterior nasal spine and the posterior nasal spine in the palatal plane and the maxillary incisor and the first molar’s palatal cusp tip in the occlusal plane. Then the lines were drawn by the nodes of the anterior nasal spine, the posterior nasal spine, the maxillary incisor, and the first molar’s palatal cusp tip in the force vector directions of 0°, 10°, 20°, and 30° in both finite element method models, respectively. In the sagittal plane, we measured 6 nodes at the front of the complex that might affect the patient’s profile. Among these nodes, subspinale and maxillary incisor represent the characteristics of the dentition and the alveolar bone, and anterior nasal spine, inferior part of the nasal bone, nosewing, and nasion represent the skeletal characteristics of the craniomaxillary complex. The lines were also drawn by the above 6 nodes in the force vector directions of 0°, 10°, 20°, and 30° in both finite element models, respectively. In addition, we chose the nodes at the midpoints of the temporozygomatic, zygomaticomaxillary, and pterygopalatine sutures at the back of the complex and the nodes of nasion and right nosewing at the front of the complex for measuring stress distribution.
Results
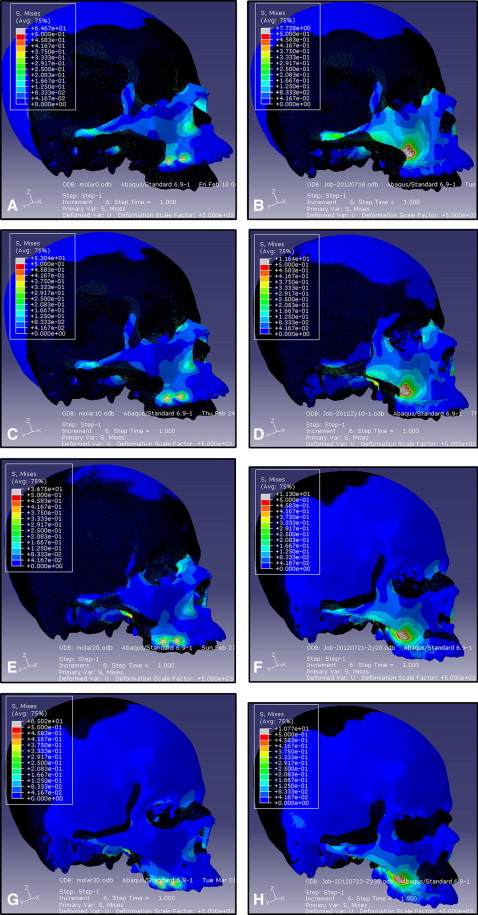
In the superimposed contours of displacements, the craniomaxillary complex in both finite element models experienced counterclockwise rotation after the application of force, with an angle between the force vector and the occlusal plane from 0° to 10° forward and downward relative to the occlusal plane. In the force vector direction of 20°, the complex still showed counterclockwise rotation in the dental anchorage model but moved almost without rotation in the bone anchorage model. In the force vector direction of 30°, the complex showed visible clockwise rotation in the bone anchorage model and displaced in an almost no-rotation pattern in the dental anchorage model ( Fig 2 ).
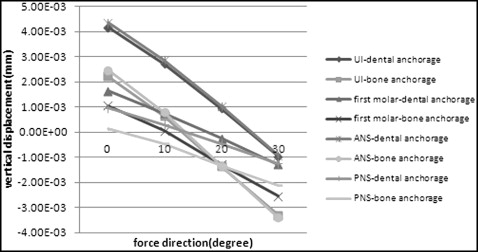
Both finite element models displaced upward in the force vector direction of 0°. In the force vector direction of 10°, all selected nodes in the dental anchorage model still displaced upward; however, the nodes standing for the maxillary incisor and anterior nasal spine in the bone anchorage model moved upward, and those standing for the posterior nasal spine and first molar’s palatal cusp tip moved downward. In the force vector direction of 20°, all selected nodes in the bone anchorage model displaced slightly downward, and the 4 lines drawn by the nodes nearly formed an intersection. For the dental anchorage model, the nodes of the maxillary central incisor and anterior nasal spine moved upward, and those of the posterior nasal spine and first molar’s palatal cusp tip moved downward. In the force vector direction of 30°, the nodes in both models displaced downward, and the 4 lines drawn by the nodes nearly formed an intersection in the dental anchorage model ( Fig 3 ).
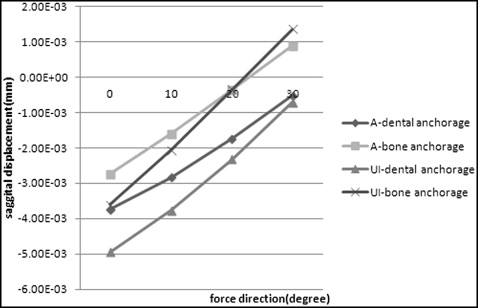
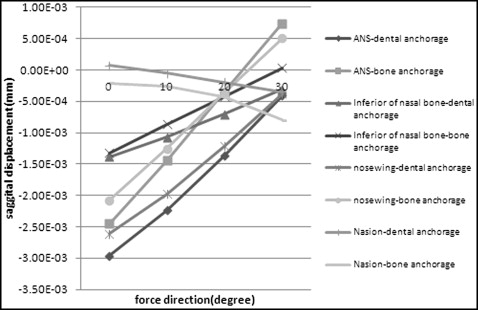
In the force vector direction from 0° to 20°, the selected nodes in both finite element models at the anterior part of the craniomaxillary complexes displaced forward; the amount of displacement decreased gradually, and the nodes moved more in the dental anchorage model than in the bone anchorage model. The 2 lines drawn by the nodes representing subspinale and maxillary incisor and the 4 lines drawn by the nodes representing anterior nasal spine, inferior part of the nasal bone, nosewing, and nasion nearly formed an intersection in the force vector direction of about 20° in the bone anchorage model, and in the force vector direction of 30° in the dental anchorage model, respectively. Meanwhile, the nodes in the bone anchorage model displaced backward in the force vector direction of 30° ( Figs 4 and 5 ).
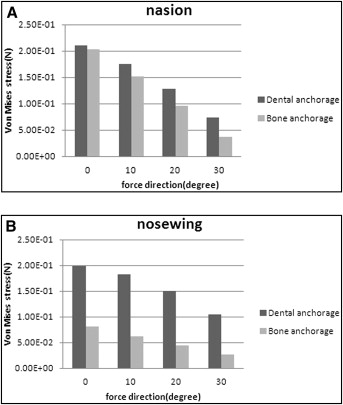
Von Mises stresses in the selected nodes of nasion and nosewing at the front of the 2 models decreased gradually in the force vector direction from 0° to 30°. Compared with the dental anchorage model, the Von Mises stresses of the nodes in the same force vector direction were less in the bone anchorage model ( Fig 6 ). At the back of the models, the Von Mises stress in the selected nodes of the temporozygomatic and zygomaticomaxillary sutures tended to decrease, whereas the stress tended to increase in the node of the pterygopalatine suture, with the force vector direction from 0° to 30°. The node stresses in the bone anchorage model were greater than those in the dental anchorage model at the back of the 2 models ( Fig 7 ).