Introduction
The purpose of this study was to investigate the dimensional changes in each skeletal unit in the mandibles of patients with facial asymmetry and mandibular prognathism.
Methods
The patients consisted of 50 adults with mandibular prognathism, divided into the symmetry group (n = 20) and the asymmetry group (n = 30) according to the degree of menton deviation. Three-dimensional computed tomography scans were obtained with a spiral computed tomography scanner. Landmarks were designated on the reconstructed 3-dimensional surface models. The lines to represent condylar, coronoid, angular, body, and chin units were used. Ramal and body volumes were measured in the hemi-mandibles.
Results
In the asymmetry group, condylar and body unit lengths were significantly longer, and coronoid unit length was significantly shorter on the nondeviated side than on the deviated side ( P <0.01). Angular and chin unit lengths were not significantly different between the 2 sides ( P >0.05). Ramal volume was significantly greater on the nondeviated side ( P <0.01), but body volume was not significantly different between the 2 sides ( P >0.05).
Conclusions
Both condylar and body units appeared to contribute to mandibular asymmetry, with a more central role of the condylar unit.
Facial symmetry is defined as the correspondence in size, form, and arrangement of the facial features on opposite sides of the median sagittal plane. Facial asymmetry is not uncommon. In groups with dentofacial deformities, previous studies reported incidences of facial asymmetry of 34% in the United States and 25% in Hong Kong, and, especially in groups with skeletal Class III, 42.3% in Korea and 40% in the United States. In spite of the high prevalence, reliable diagnostic measures for the assessment of the etiology of facial asymmetry have not been established, possibly due to the 3-dimensional (3D) complexity of the problem. In particular, the assessment of the asymmetry in each part of the craniofacial region might help to understand the etiology.
Two-dimensional (2D) x-ray films such as posteroanterior cephalograms, submentovertex views, and panoramic views have several limitations, such as magnification, distortion, and unclearness. In posteroanterior cephalograms, projection errors are caused by vertical head rotation, and width measurements have not been dependable in the diagnosis of facial asymmetry. Moreover, conventional and digital panoramic images are not expected to offer reliable information on the exact dimensions.
To overcome these limitations, paired coplanar x-ray images and 3D cephalometric techniques have been used. However, 3D images reconstructed from 2D x-ray images are also subject to the limitations of 2D x-rays related to the orientation of head position and the definition of reproducible landmarks on each x-ray film. Therefore, orthodontic diagnosis using 3D computed tomography (CT) has recently been brought into attention for the following reasons: (1) actual measurement without distortion regardless of head posture is possible ; (2) real anatomic surface landmarks, not projected landmarks, are used for the dimensional measurements; and (3) it enables volumetric measurements of an object. Hence, 3D CT is considered an effective tool to understand asymmetry.
Previous 2D studies on facial asymmetry reported that the mandible appears to be the dominant factor in facial asymmetry. Accordingly, some 3D studies on facial asymmetry focused on the characteristics of the mandible, reporting the differences of the linear measurements such as ramal height and body length between the nondeviated and deviated sides in asymmetric mandibles. In spite of ample evidence of the gross morphologic change in the asymmetric mandible, information on the role of each skeletal unit in the development of mandibular asymmetry is scarce. According to Moss and Rankow, the mandible is a composite of relatively independent skeletal units including alveolar process, coronoid process, angular process, body, condylar process, and chin. Examining the asymmetric mandible by the skeletal units might be helpful for understanding the etiology of mandibular asymmetry. The purpose of this study was to measure the dimensional changes in each skeletal unit in the mandibles of patients with facial asymmetry and mandibular prognathism.
Material and methods
Clinical and 2D radiographic examinations were carried out on patients who visited the Yonsei University Dental Hospital, Seoul, Korea, between 2005 and 2009. The patients consisted of 50 adults with skeletal Class III with mandibular prognathism (ANB, <0°; Pog to N perpendicular, >5.0 mm), no systemic disease, and no degenerative disease of the temporomandibular joint. Because the chin is strongly related to the perception of facial asymmetry, facial asymmetry was defined by the degree of menton deviation (MD) from the midsagittal reference line. The midsagittal reference line was defined with the methods recommended by Grummons and Kappeyne van de Coppello. The symmetry group consisted of 20 adults (10 men, 10 women) whose MDs were less than 2 mm from the midsagittal reference line. The asymmetry group consisted of 30 adults (15 men, 15 women) whose MDs were more than 4 mm from the midsagittal reference line. The patient characteristics in the symmetry and asymmetry groups are listed in Table I .
| Variable | Mean | SD | Minimum | Maximum |
|---|---|---|---|---|
| Symmetry group | ||||
| Age (y) | 25.1 | 4.2 | 20.0 | 33.0 |
| ANB (°) | −3.3 | 2.6 | −0.4 | −8.7 |
| Pog to N (mm) perpendicular (mm) | 8.7 | 3.8 | 5.1 | 18.0 |
| MD (mm) | 1.2 | 0.5 | 0.4 | 2.0 |
| Asymmetry group | ||||
| Age (y) | 22.6 | 6.2 | 19.5 | 40.0 |
| ANB (°) | −2.8 | 2.6 | 0.0 | −10.1 |
| Pog to N (mm) (y) perpendicular (mm) | 7.0 | 3.4 | 5.1 | 13.0 |
| MD (mm) | 7.7 | 3.4 | 4.0 | 15.5 |
The 3D CT scans were obtained by using a spiral CT scanner (CT Hispeed Advantage/GE Medical System, Milwaukee, Wis) with a 512 × 512 matrix, 120 kV, and 200 mA. The thickness of the axial image was 3.0 mm, and the table speed was 6 mm per second. The patients were positioned with the Frankfort horizontal plane perpendicular to the floor and the facial midline coinciding with the long axis of the CT machine. The gantry had 0° inclination. The digital imaging and communication in medicine (DICOM) images were created in 1.0-mm slice thicknesses after scanning. The DICOM data were reconstructed into 3D images (176 HU threshold value) using V-works software (version 4.0, CyberMed, Seoul, Korea). The mandibles were separated from the whole images, and the teeth above the alveolar bone in the mandibles were removed.
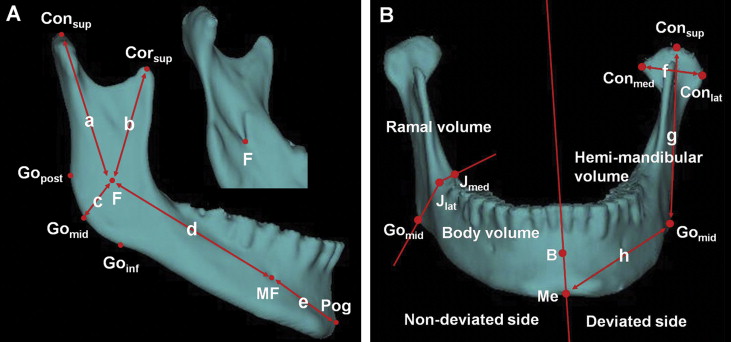
Landmarks ( Table II and Fig 1 ) were designated on the reconstructed 3D surface model, and their positions were verified on the axial, coronal, and sagittal slices. The following bilateral measurements were made ( Fig 1 ): (1) condylar unit length: Con sup -F; (2) coronoid unit length: Cor sup -F; (3) angular unit length: F-Go mid ; (4) body unit length: F-MF; (5) chin unit length: MF-Pog; (6) condylar width: Con med -Con lat ; (7) ramal height: Con sup -Go mid ; (8) body length: Go mid -Me; (9) hemi-mandibular volume: the mandibular volume was divided into 2 hemi-mandibular volumes by the plane connecting Me, B, and G; and (10) ramal and body volumes: hemi-mandibular volume was divided into ramal and body volumes by the plane connecting Go mid , J lat , and J med . The data were measured in units of 0.01 mm and 0.01 × 10 3 mm 3 .
| Landmark | Definition |
|---|---|
| Con sup (condylion superius) | The most superior point of the condylar head |
| Con med (condylion medialis) | The most medial point of the condylar head |
| Con lat (condylion lateralis) | The most lateral point of the condylar head |
| Cor sup (coronoid superius) | The most superior point of the coronoid process |
| F (fossa of mandibular foramen) | The most inferior point on the fossa of the mandibuar foramen |
| J lat | The most lateral and deepest point of the curvature formed at the junction of the mandibular ramus and body |
| J med | The most medial and deepest point of the curvature formed at the junction of the mandibular ramus and body |
| Go post (gonion posterius) | The most posterior point on the mandibular angle |
| Go mid (gonion midpoint) | The midpoint between Go post and Go inf on the mandibular angle |
| Go inf (gonion inferius) | The most inferior point on the mandibular angle |
| MF (mental foramen) | The entrance of the mental foramen |
| Me (menton) | The most inferior midpoint on the symphysis |
| Pog (pogonion) | The most anterior midpoint on the symphysis |
| B (supramentale) | The midpoint of the greatest concavity on the anterior border of the symphysis |
| G (genial tubercle) | The midpoint on genial tubercle |
Statistical analysis
To examine intraobserver and interobserver errors, we randomly selected 20 patients, and all linear and volumetric measurements were performed bilaterally on 2 occasions, the initial assessment and the reassessment after 2 weeks, by 3 observers (graduate students). The 2 assessments by each observer were analyzed with the intraclass correlation for intraobserver reliability, and the first and second assessments of 3 observers, respectively, for interobserver reliability. The method errors were calculated according to Dahlberg’s formula, Se = √(D2/N) ( D , the difference between double measurements, and N , the number of paired double measurements). The Shapiro-Wilks test for normality showed that all measurements were normally distributed. Because the 2-sample t test showed that MD and the differences in the measurements between the male and female groups were not significantly different, no differentiation was made for sex. The 2-sample t test was used to compare the measurements between the symmetry and asymmetry groups, and the paired t test was used to compare the measurements between the nondeviated and deviated sides. In the asymmetry group, 1-way analysis of variance (ANOVA) was used to compare the differences in the skeletal unit lengths, and the Tukey test was used to show the differences in the skeletal unit lengths with significant differences. The Pearson correlation analysis was used to determine correlations between MD and the measurements. Statistical evaluations were performed at the 5% level of significance with SPSS for Windows (version 17.0, SPSS, Chicago, Ill).
Results
Intraclass correlation coefficients ranged from 0.907 to 0.969 for intraobserver reliability, and from 0.905 to 0.921 for interobserver reliability, indicating high reliability of the measurements used in this study. The intraobserver measurement errors ranged from 0.24 to 0.64 mm for linear measurements and from 43.23 to 92.23 mm 3 for volumetric measurements. The interobserver measurement errors were from 0.41 to 0.98 mm for linear measurements, and 51.93 to 100.98 mm 3 for volumetric measurements.
The asymmetry group showed significantly greater differences in condylar unit length ( P <0.01), body unit length ( P <0.01), coronoid unit length ( P <0.05), condylar width ( P <0.01), ramal height ( P <0.01), body length ( P <0.05), hemi-mandibular volume ( P <0.01), and ramal volume ( P <0.01) between the nondeviated and deviated sides, compared with the symmetry group ( Table III ), confirming the overall asymmetrical morphology of the mandible.
| Symmetry group | Asymmetry group | ||||
|---|---|---|---|---|---|
| Measurement | Mean | SD | Mean | SD | P value |
| Condylar unit length diff (mm) | 0.45 | 1.66 | 5.69 | 4.10 | <0.001 † |
| Body unit length diff (mm) | 0.18 | 1.47 | 3.23 | 2.52 | <0.001 † |
| Coronoid unit length diff (mm) | −0.38 | 1.48 | −1.43 | 1.94 | 0.035 ∗ |
| Angular unit length diff (mm) | 0.11 | 1.20 | −0.06 | 1.01 | 0.597 |
| Chin unit length diff (mm) | 0.12 | 0.93 | 0.11 | 1.19 | 0.955 |
| Condylar width diff (mm) | 0.34 | 1.49 | 2.24 | 1.96 | <0.001 † |
| Ramal height diff (mm) | 0.65 | 1.19 | 5.57 | 3.74 | <0.001 † |
| Body length diff (mm) | 0.59 | 1.59 | 2.01 | 2.15 | 0.010 ∗ |
| Hemi-mandibular volume diff (×10 3 mm 3 ) | 0.01 | 0.38 | 0.90 | 1.21 | <0.001 † |
| Ramal volume diff (×10 3 mm 3 ) | 0.03 | 0.38 | 0.95 | 0.89 | 0.001 † |
| Body volume diff (×10 3 mm 3 ) | −0.02 | 0.52 | −0.05 | 0.72 | 0.205 |
In asymmetry group, condylar and body unit lengths were significantly longer, and coronoid unit length was significantly shorter on the nondeviated side than on the deviated side ( P <0.01; Table IV ). Angular and chin unit lengths were not significantly different between the 2 sides ( P >0.05; Table IV ). One-way ANOVA showed a significant difference in the skeletal unit lengths ( P <0.01). The Tukey test showed only that the difference in angular unit length was not significantly different from the difference in chin unit length ( P >0.05). The difference in condylar unit length was significantly greater than the difference in body unit length ( P <0.01). Condylar width was significantly wider, and ramal height and body length were significantly longer on the nondeviated side ( P <0.01; Table IV ).
| Nondeviated side | Deviated side | Difference | Correlation with MD ( P value) |
|||||||
|---|---|---|---|---|---|---|---|---|---|---|
| Measurement (mm) | Mean | SD | Mean | SD | Mean | SD | Minimum | Maximum | P value | |
| Condylar unit length | 50.39 | 3.86 | 44.70 | 4.69 | 5.69 | 4.10 | 0.16 | 14.29 | <0.001 ∗ | 0.658 (<0.001 ∗ ) |
| Body unit length | 63.92 | 4.62 | 60.69 | 4.47 | 3.23 | 2.52 | −0.50 | 9.53 | <0.001 ∗ | 0.624 (<0.001 ∗ ) |
| Coronoid unit length | 38.91 | 4.21 | 40.34 | 4.64 | −1.43 | 1.94 | −5.70 | 3.66 | <0.001 ∗ | −0.185 (0.329) |
| Angular unit length | 20.37 | 2.54 | 20.43 | 2.62 | −0.06 | 1.01 | −1.81 | 1.96 | 0.734 | 0.045 (0.814) |
| Chin unit length | 32.15 | 1.73 | 32.05 | 1.84 | 0.11 | 1.19 | −1.91 | 1.80 | 0.632 | 0.028 (0.885) |
| Condylar width | 22.13 | 2.74 | 19.89 | 3.13 | 2.24 | 1.96 | −0.31 | 7.84 | <0.001 ∗ | 0.275 (0.142) |
| Ramal height | 64.60 | 4.32 | 59.03 | 5.29 | 5.57 | 3.74 | −3.48 | 15.08 | <0.001 ∗ | 0.621 (<0.001 ∗ ) |
| Body length | 90.58 | 5.49 | 88.57 | 5.50 | 2.01 | 2.15 | −2.99 | 7.69 | <0.001 ∗ | 0.554 (0.001 ∗ ) |
Stay updated, free dental videos. Join our Telegram channel
VIDEdental - Online dental courses


