Introduction
The aim of this prospective, longitudinal study was to evaluate changes to the external shape and form of the nose after surgically assisted rapid maxillary expansion and orthodontic treatment. The changes were registered using a 3-dimensional computer tomography technique, based on superimposition on the anterior base of the skull.
Methods
The subjects comprised 35 patients (mean age, 19.7 years; range, 16.1-43.9 years). Low-dose, helical computerized tomography images were taken at treatment start and after orthodontic treatment, about 18 months postsurgery. The 3-dimensional models were registered and superimposed on the anterior cranial base.
Results
There were in general significant widening and overall anterior and inferior displacement of the nasal soft tissues. The changes varied in size and direction. No correlation was found between the initial and final widths of the nose, or between the initial and final widths of the nostrils.
Conclusions
After surgically assisted rapid maxillary expansion, the most obvious changes to the external features of the nose were at the most lateral alar bases. The difference in lateral displacement profoundly influenced the perception of a more rounded nose. Patients with narrow and constrained nostrils can benefit from these changes. The 3-dimensional superimposition applied in this study is a reliable method, circumventing projection and measurement errors.
Transverse maxillary hypoplasia is associated primarily with functional impairments, such as posterior crossbite, dental crowding, reduced nasal respiratory function, or anteroposterior skeletal anomalies, and less with facial esthetics. A widely recognized treatment modality for this condition is correction of the underlying skeletal anomalies by surgically assisted rapid maxillary expansion (SARME).
Although the skeletal and dental effects of SARME have been evaluated in several clinical and radiographic studies, little is known about its effect on the shape and form of the nose. The soft-tissue changes can be quite obvious, and most clinicians have observed patients in whom SARME has been associated with pronounced changes to the nose. In some patients, this might be regarded as an untoward side effect; in others, it could improve facial esthetics.
Soft-tissue changes after corrective orthognathic surgery have been described in a number of studies. Consistent findings after maxillary advancement and maxillary impaction are labial changes and widening of the nose. Most surgeons are aware of these phenomena and use different techniques to reduce these effects.
The size and shape of the nostrils and the width of the alar base are considered to play important roles in respiration. It is suggested that the site responsible for sensing airflow and stuffiness is in the nasal vestibule. Guenthner et al associated modifications in the shape of the external nares with changed airway patency. This finding was supported by Cole, who found significant associations between minor alterations in this region and improvement or deterioration in respiratory function. Moreover, Magnusson et al concluded that even small changes to the soft tissues in the most anterior part of a narrow nose can be critical to the subject’s perception of nasal obstruction.
However, with reference to SARME, little is known about associated soft-tissue changes and the effects on facial esthetics and respiration.
SARME is often followed by second-stage surgery that can have a further impact on the soft tissues and respiration. Thus, it is essential to identify soft-tissue changes associated with SARME to predict or prevent these effects.
Previous studies on SARME and its effects on soft tissues have been limited by the methods available at the time for quantifying soft-tissue changes. Ngan et al and Filho et al used traditional 2-dimensional (2D) lateral cephalograms. When applied to assess changes in the soft-tissue profile, 2D cephalometrics have major disadvantages. It is difficult to quantify soft-tissue alterations adequately from a frontal perspective. Berger et al used serial frontal photographs to measure soft-tissue changes, and Ramieri et al used laser scanning and 3-dimensional (3D) morphometry. In the 3D analysis, the superimposition method is crucial. The major disadvantage of these methods is the potential error associated with uncertain superimposition, which is related to approximations or averaged data.
Recently, there have been impressive advances in computed tomography and imaging techniques, offering new, precise, and accurate approaches to superimposition.
The purpose of this prospective study was to evaluate changes to the external features of the nose after SARME and orthodontic treatment, using a 3D imaging technique and registration based on superimposition on the anterior cranial base.
Material and methods
Our prospective sample comprised patients scheduled to undergo SARME. The inclusion criterion for SARME was a real transverse discrepancy according to Jacobs et al. The magnitude of the skeletal discrepancy (>5 mm) was primarily assessed clinically and on study models in Class I relationships. Transverse assessments were also done on computed tomography models.
This sample was previously evaluated by Magnusson et al with reference to skeletal changes after SARME. The same orthodontic, surgical, and radiographic procedures were applied in both studies.
According to power and size calculations, a priori, the minimum sample size was set at 34 patients, α = 0.05, and power of 80%. To ensure that the sample size met these requirements, 40 patients were recruited consecutively at the Department of Orthodontics, Institute for Postgraduate Dental Education, Jönköping, Sweden, and at the Department of Dentofacial Orthopaedics, Maxillofacial Unit, University Hospital, in Linköping, Sweden. Participation in the study was voluntary: 3 patients declined to participate, and 2 patients were excluded because their computed tomography records were incomplete. The sample thus comprised 35 patients (14 male, 21 female). The mean age at treatment start was 19.7 years (range, 16.1-43.9 years).
The study was approved by the ethics committee of the Faculty of Health Sciences, Linköping University, in Sweden (reference: M746-04).
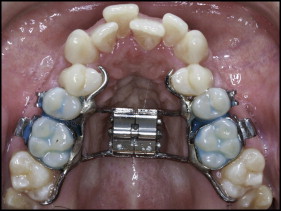
The presurgical orthodontic preparation included the following. The maxillary expansion appliance comprised a tooth-borne device activated by means of a conventional hyrax expander (hyrax II; Dentaurum, Ispringen, Germany) with a soldered framework and orthodontic bands ( Fig 1 ). The degree of expansion was calculated for each patient, including a general bilateral overexpansion of half a molar-cusp width. The patients were instructed to activate the jackscrew 1 turn (approximately 0.225-0.250 mm) twice a day after a postoperative latency period of 5 days. Postoperative control was scheduled for 12 days postsurgery and included a periapical radiograph to ensure clinically symmetrical interdental separation and a medial diastema. In patients with a “bad separation”—ie, intra-alveolar separation and risk for periodontal injuries—prophylactic treatment was initiated. At that time, the amount of additional expansion was calculated.
Surgical treatment was undertaken by 2 experienced senior oral and maxillofacial surgeons (P.N. and another) at the Department of Oral and Maxillofacial Surgery, Institute for Postgraduate Dental Education, Jönköping, Sweden, and at the Department of Dentofacial Orthopaedics, Maxillofacial Unit, University Hospital, Linköping, Sweden, with a technique similar to that described by Glassman et al.
The surgery was carried out under general anesthesia and nasotracheal intubation. The mucoperiosteal incision in the maxillary vestibule extended from the right to the left second premolar. Osteotomies were performed on the maxillary lateral walls, from the piriform aperture to the pterygoid plates. The pterygomaxillary sutures were kept intact. The linings of the floor and lateral walls of the nasal passage were reflected. A vertical osteotomy at the anterior nasal spine and the median palatal suture was carried out to ensure separation of the maxillary halves. The hyrax expander was activated by 12 turns to verify the success of the osteotomy and to ensure visible symmetrical separation; it was then deactivated by the same amount.
Depending on their physical condition, the patients were discharged from the hospital on the same day or the day after surgery.
The postsurgical orthodontic procedures included the following. After a mean active expansion period of 15 days (range, 11-17 days), the appliance was used as a passive retainer for 90 days. At that time, the hyrax expander was replaced by a modified transpalatal arch, and fixed appliance treatment began.
On completion of the active treatment phase, the transpalatal arch was removed, and fixed appliance treatment continued with stiff rectangular archwires to adjust the transverse width and to control and correct the buccal root torque of the molars.
All transverse discrepancies were corrected by the end of treatment (mean, 18 months postoperatively), and the orthodontic treatment period was then concluded. At this point, 26 patients were referred for second-stage orthognathic surgery. In the remaining 9 patients, the fixed appliance was debonded, and a Hawley plate was provided as a retainer.
The computed tomography examinations were undertaken at the Center for Medical Image Science and Visualization at University Hospital, Linköping, Sweden, and at the Department of Radiology, Ryhov County Hospital, Jönköping, Sweden, 1 week before surgery and at the end of the active orthodontic treatment phase (mean, 18 months postoperatively).
A helical computed tomography machine (Somatome Sensation 64 CT-scanner; Siemens Medical Solutions, Erlangen, Germany) with a low-dose protocol (CARE dose 4D; Siemens Medical Solutions) was used at 120 kV and 55 mA. The rotation time was 1 second, and the pitch factor was 0.9, with a collimation of 0.6 mm. The increment was 0.3 mm. According to the manufacturer, the isotopic resolution or voxel size was 0.33 mm. The patient’s head was positioned so that the Frankfort horizontal plane was vertical.
The scanned area comprised the anterior cranial base to the mandibular base. After examination, the images were processed at a radiologic workstation (Sectra Imtec AB, Linköping, Sweden) with a slice thickness of 0.75 mm and slice increments of 0.3 mm in Kernel H 60s sharp FR, to allow further segmentation and registration.
The data were processed to visualize and measure soft-tissue changes caused by SARME, using a modified version of a technique described by Cervidanes et al. This process involves image segmentation, registration, and visualization ( Fig 2 ).
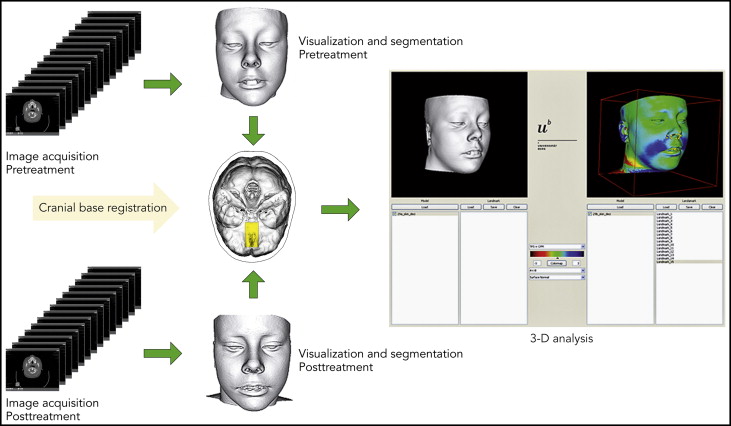
The image registration and superimposition of the preoperative and postoperative 3D models were done before segmentation with a volumetric registration method: specifically, normalized mutual information, based on the anterior cranial base. The cranial fossae and the ethmoid bone surfaces are regarded as stable areas, with growth completed before puberty. Once the preoperative and postoperative volumes are registered, they share the same coordinate system, which compensates for any discrepancies between before and after volumes, and diminishes the risks of projection and measurement errors.
Segmentation is the process of outlining the shape of a structure—in this case, anterior cranial base, and the outer surfaces of the nasal and midface soft tissues. The segmentation was performed semiautomatically in AMIRA (Mercury Computer System, Berlin, Germany) by an author (H.K.). In the semiautomatic segmentation technique, the region of interest is outlined with mouse clicks in the cross-sections of a data set, and algorithms (simple thresholding and region growing) are applied, so that the path that best fits the edge of the image is shown. With simple thresholding, is it possible to select a range of gray values (in Hounsfield units, HU). In this study, the lower threshold in bony structures was set to 300 HU, and values above this level were automatically selected. The threshold value was interactively adjusted to achieve better contours. Semiautomatic tools in AMIRA were effectively used to accelerate the process.
A landmark-based, nonrigid mapping technique, thin-plate spline, was used to determine the corresponding soft-tissue points between the presurgery and postsurgery 3D models. This was done by a pipeline procedure according to the method of Kim et al.
Di2Mesh software (Institute for Surgical Technology & Biomechanics, University of Bern, Bern, Switzerland) is a graphical user interface-based application allowing the user to compute surface-to-surface distances in any specified direction and visualize them with a color map.
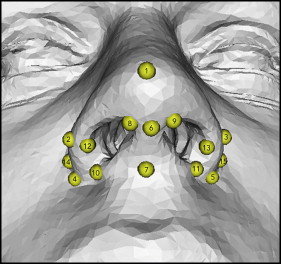
Fifteen validated landmarks were used for the measurements ( Fig 3 ). The landmarks were identified and digitized by the first author (A.M.). The nonrigid transformation model, thin-plate spline deformation, and closest-point matching were used to show displacements. The software (Di2Mesh) computed the closest-point relationship between the presurgical and postsurgical landmarks in a 3D Euclidean space coordinate system.
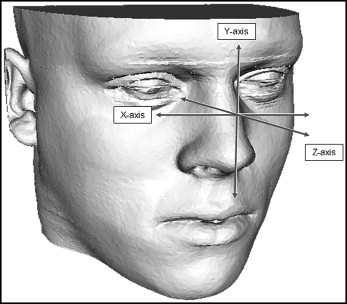
The displacement vectors were normalized with the Frankfort horizontal plane coordinate system according to the method of Xia et al. The transversal plane is defined by right and left porion, and the averaged coordinates of right and left orbitale. The frontal plane is perpendicular to the transversal plane, through right and left porion. The sagittal plane is perpendicular to the transversal and frontal planes, through nasion. This means that the zero point of the Frankfort horizontal plane will be the center of left and right porion. As shown in Figure 4 , lateral displacement on the x-axis, superior displacement on the y-axis, and anterior displacement on the z-axis were recorded as positive values.
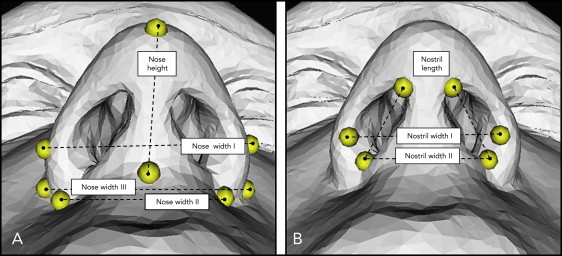
The transverse displacements of corresponding landmarks on the x-axis were also summarized. The Euclidean distances—ie, the shortest distances between 2 landmarks—were measured to evaluate the height and width of the nose and nostrils ( Fig 5 ).
Ten computed tomography volumes were randomly selected. The anatomic landmarks were located and digitized in each 3D model. The same observer (A.M.) repeated the procedure 4 weeks later, and the displacements of the landmarks were calculated. The error of the measurements was calculated by intraclass correlation coefficient (ICC) for single measurements; this is an expression of intraobserver reliability. An ICC above 0.75 indicates excellent reliability. The ICC values were between 0.851 and 0.992. Landmarks 1, 6, and 7 in the midline showed the weakest ICC values.
Statistical analysis
Statistical analyses were undertaken using the Statistical Package for the Social Sciences III (version 20.0; SPSS, Chicago, Ill). The distribution of data was tested with the 1-sample Kolmogorov-Smirnov test. The results showed normal distribution of the data, but because of the sample size, nonparametric tests were also warranted. Median values and percentiles were used to describe the changes and distributions. The Wilcoxon signed rank nonparametric test was used to evaluate pretreatment and posttreatment differences. The level of significance was set at P <0.05. The Spearman rho was applied to assess the correlations between the changes at the nose.
Results
There were in general significant widening and overall anterior and inferior displacement at the nose.
For the x-axis (lateral displacement, left and right), all landmarks at the alar wings showed lateral displacement ( Table I ). The displacements on the left and right sides were symmetrical and most obvious at the lateral alar bases ( Fig 3 ; landmarks 14 and 15). The amount of displacement of the lateral alar bases decreased gradually toward pronasale and toward the facial insertion of the nostrils.
| Landmark | X-axis | Y-axis | Z-axis | |||||||||
|---|---|---|---|---|---|---|---|---|---|---|---|---|
| Median change | p 10 | p 90 | Wilcoxon test | Median change | p 10 | p 90 | Wilcoxon test | Median change | p 10 | p 90 | Wilcoxon test | |
| 1 | 0.11 | −0.64 | 0.86 | NS | −0.26 | −1.40 | 0.28 | ‡ | 0.03 | −0.14 | 0.80 | † |
| 2 | 1.10 | 0.06 | 1.89 | ‡ | −0.25 | −1.34 | 1.23 | NS | 0.46 | −1.23 | 2.28 | ∗ |
| 3 | 0.70 | −0.13 | 1.91 | ‡ | −0.04 | −1.85 | 1.04 | NS | 0.63 | −0.72 | 2.39 | ‡ |
| 4 | 0.59 | −0.62 | 2.16 | † | −0.27 | −1.84 | 1.06 | NS | 1.14 | −0.17 | 2.82 | ‡ |
| 5 | 0.58 | −1.22 | 1.85 | ∗ | −0.48 | −1.91 | 1.11 | ∗ | 1.18 | −0.40 | 3.45 | ‡ |
| 6 | 0.10 | −0.54 | 1.38 | NS | −0.11 | −1.20 | 0.61 | NS | 0.41 | −0.59 | 2.04 | † |
| 7 | 0.09 | −1.22 | 1.20 | NS | −0.51 | −2.28 | 0.59 | † | 0.07 | −1.32 | 1.41 | NS |
| 8 | 0.42 | −0.47 | 1.67 | NS | −0.20 | −1.52 | 1.00 | NS | 0.26 | −0.36 | 1.57 | † |
| 9 | −0.10 | −1.44 | 1.00 | NS | −0.35 | −1.29 | 0.62 | ∗ | 0.22 | −0.50 | 1.31 | ∗ |
| 10 | 0.35 | −1.32 | 2.26 | NS | −0.19 | −1.49 | 1.23 | NS | 0.85 | −0.85 | 1.94 | ‡ |
| 11 | 0.29 | −1.04 | 1.87 | NS | −0.12 | −1.47 | 0.76 | NS | 1.07 | −0.23 | 2.37 | ‡ |
| 12 | 0.81 | −0.42 | 2.40 | ‡ | 0.48 | −1.79 | 0.71 | † | 0.18 | −2.06 | 1.44 | NS |
| 13 | 0.67 | −0.33 | 1.76 | ‡ | 0.47 | −1.43 | 1.10 | ∗ | 0.43 | −0.94 | 2.12 | † |
| 14 | 1.47 | 0.30 | 2.90 | ‡ | 0.10 | −1.12 | 1.66 | NS | 1.36 | 0.05 | 2.76 | ‡ |
| 15 | 1.41 | 0.46 | 2.60 | ‡ | −0.04 | −1.62 | 1.03 | NS | 1.98 | 0.37 | 3.25 | ‡ |
Stay updated, free dental videos. Join our Telegram channel
VIDEdental - Online dental courses


