Introduction
The aim of this study was to assess the use of 3-dimensional facial averages in determining facial morphologic differences in 2 white population groups.
Methods
Three-dimensional images were obtained in a reproducible and controlled environment from a commercially available stereo-photogrammetric camera capture system. The 3dMDface system (3dMD, Atlanta, Ga) photographed 200 subjects from 2 population groups (Budapest, Hungary, and Houston, Tex); each group included 50 men and 50 women, aged 18 to 30 years. Each face was obtained as a facial mesh and orientated along a triangulated axis. All faces were overlaid, one on top of the other, and a complex mathematical algorithm was used until an average composite face of 1 man and 1 woman was obtained for each subgroup (Hungarian men, Hungarian women, Texas men, and Texas women). These average facial composites were superimposed (men and women) based on a previously validated superimposition method, and the facial differences were quantified.
Results
Distinct facial differences were observed between the population groups. These differences could be seen in the nasal, malar, lips, and lower facial regions. In general, the mean facial differences were 0.55 ± 0.60 mm between the Hungarian and Texas women, and 0.44 ± 0.42 mm between the Hungarian and Texas men. The ranges of differences were −2.02 to 3.77 and −2.05 to 1.94 mm for the female and male pairings, respectively.
Conclusions
Three-dimensional facial averages representing the facial soft-tissue morphology of adults can be used to assess diagnostic and treatment regimens for patients by population. Each population is different with respect to their soft-tissue structures, and traditional soft-tissue normative data (eg, white norms) should be altered and used for specific groups.
Three dimensional (3D) imaging in orthodontics is an exciting development that has evolved greatly in the last 2 decades and will provide many useful applications in this specialty in the future. Study models have been the only 3D records routinely used by orthodontists; they have allowed clinicians to examine malocclusions from many viewpoints. These models have proven to be excellent diagnostic tools, but their disadvantages are that they not only take time for pouring and trimming, but also require storage space in the orthodontic office. When planning treatment for patients, the orthodontist must consider not only the models of the teeth but also what the planned treatment will do to the facial soft tissues. Because the soft tissues of the face largely determine the limitations of orthodontic treatment from the perspectives of function, stability, and esthetics, the orthodontist must plan treatment within the patient’s limits of soft-tissue adaptation and contours. Orthodontists use radiographs in addition to clinical photos to evaluate the patient’s hard tissues, but this modality has only 2 dimensions. Current methods of evaluation include facial photographs, which are inadequate because of distortions in perspective, magnification, and patient positioning. This mode of evaluation does not provide a true 3D representation. With developments in technology, many clinicians have shifted toward digital computer-based records for quicker results, easier organization, the ability to enlarge and enhance images, and the ease of sharing this information with patients and colleagues.
Three-dimensional images of the facial soft tissues can help provide the clinician this same information with a more accurate representation of facial morphologies and can be useful to better understand, compare, and predict outcomes before and after treatment.
Some applications of 3D imaging in orthodontics include before and after orthodontic assessment of dentoskeletal relationships and facial esthetics, auditing orthodontic outcomes with regard to soft and hard tissues, 3D treatment planning, and 3D soft- and hard-tissue predictions. Three dimensionally fabricated custom archwires, archiving 3D facial, skeletal, and dental records for in-treatment planning, research, and other medico-legal purposes are some other benefits of using 3D models in orthodontics.
To date, little has been done to include the use of 3D imaging tools in the analysis of facial morphologies of various populations. This study was intended to establish and compare the facial morphologic differences between white subjects from different areas of the world by using 3D imaging.
Material and methods
Subjects were drawn from 2 sites: the dental school in Budapest, Hungary, and the University of Texas Health Science Center, Dental Branch, Houston. All subjects were dental students invited to participate in the study if they met the following inclusion criteria: white descent, between the ages of 18 and 30 years, no adverse skeletal deviations, normal body mass index values, and no gross craniofacial anomalies.
The sample size was determined from the parameters of the growth of the nose, which is normally unaffected by orthodontic treatment and is the parameter with the greatest variance. With the likely change of 3 mm overall during the growth period and a standard deviation of 2.8 mm, a power of 0.85 with significance of 0.05 would require a sample size of 35 in each group.
Ethical approval and informed consent for this study were given by the institutional review board of the University of Texas Health Science Center at Houston and the participants.
The imaging system we used was the portable 3dMDface system (3dMD, Atlanta, Ga), a structured light system combining stereophotogrammetry and the structured light technique. This system uses a multi-camera configuration, with 3 cameras on each side (1 color, 2 infrared) that capture photo-realistic quality pictures. A random light pattern is projected onto a subject, and an image is captured with multiple synchronized digital cameras set at various angles in an optimum configuration. This system can capture full facial images from ear to ear and under the chin in 1.5 ms at the highest resolution. The manufacturer’s accuracy is less than 0.5 mm, and the quoted clinical accuracy is 1.5% of the total observed variance. Three-dimensional images captured by surface acquisition systems are highly repeatable, and 3D landmark data can be acquired with a high degree of precision.
Images from the 3dMDface system were viewed on a dedicated computer by using the 3dMDpatient software platform ( Fig 1 ).
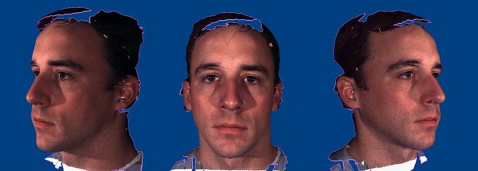
Natural head posture was adopted for all subjects because it is clinically reproducible. The subjects sat on an adjustable chair and were asked to look into a mirror with horizontal and vertical lines marked on it. They were asked to level their eyes to the horizontal line and align the midline of their face with the vertical line. Adjustments to the seating height were made to assist the subjects in achieving natural head posture. The subjects were asked to swallow hard and to keep their jaws relaxed just before the images were taken. Each image acquisition took 1.5 ms.
Images taken by the 3dMDface system were converted to OBJ files (also known as Wavefront object files, a geometry definition file format first developed by Wavefront Technologies, Ellicott City, Md) by using the proprietary software and then imported into a reverse-modeling software program (Rapidform 2006, INUS Technology, Seoul, Korea) (RF6) for analysis. This software provided 9 different 3D work activities, including 3D scan data processing; polygon cleaning, editing, and optimization; rapid prototyping work preparation; curve modeling and editing; polygon to nonuniform rationale B-spline (NURBS) conversion, modeling, and editing; freeform inspection and geometric dimensioning and tolerance; and customized application development in VB, VBA, C++, and JAVA.
Together, these functions allowed high-quality polygon meshes, accurate freeform NURBS surfaces and geometrically perfect solid models to be created. RF6 generated data as absolute mean shell deviations, standard deviations of errors during shell-to-shell overlaps, maximum and minimum range maps, histogram plots, and color maps.
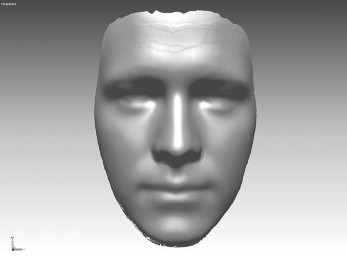
The initial OBJ files imported into RF6 had a semirough image texture because of the irregularity of the surface contours and the way in which light was reflected off the surfaces of different objects. Further data processing was carried out by a custom-built software subroutine to obtain a workable image that preserved shape, surface, and volume. The images were checked individually, and unwanted areas that could not be automatically removed were done manually by dividing the unwanted areas from the main shell before the next stage. Surface meshes with “defects” or “holes” were filled in automatically by RF6. Finally, 1 composite whole face per subject was generated ( Fig 2 ).
Average faces were constructed to represent the average, and their variations were based on the facial morphology of 2 white populations. The average facial constructs were carried out by using a previously validated software subroutine created from tools available in RF6.The steps required to produce an average face were reported previously and are summarized as follows.
- 1.
Prealignment of images by determining the principal axes of rotation, based on computing the tensor of inertia of each 3D image.
- 2.
Manual positioning, when necessary, to improve the previous stage.
- 3.
Best fit alignment by using the built-in algorithm in RF6.
- 4.
Averaging the z coordinates of the images based on normal images to a facial template.
- 5.
Point cloud triangulated to obtain an average face.
- 6.
The average face improved by filling in small holes and removing possible mesh defects.
- 7.
Color texture applied.
- 8.
Shells with 1 positive and 1 negative SD created.
The 4 average facial shells—Houston female (HOU-F), Houston male (HOU-M), Hungarian female (HUN-F), and Hungarian male (HUN-M)—were superimposed by using a specialized superimposition technique to compare morphologic differences. This systematic process involved manually aligning 5 points of the facial scans (2 points on the inner canthus of the eyes, 2 points on the outer commissure of the lips, and 1 point on the nasal tip) and subsequently by fine registration, with RF6 determining the best fit of the 2 scans.
The following paired groupings were analyzed in this order: HOU-F vs HOU-M, HUN-F vs HUN-M, HUN-F vs HOU-M, HOU-F vs HUN-M, HUN-F vs HOU-F, and HUN-M vs HOU-M.
The parameters used in this study were linear measurements, color histograms, and surface areas and shapes.
Linear measurements representing the mean differences between 2 surface shells were recorded in millimeters. This value represents the sum total of all differences recorded between overlapping surfaces of 2 shells, and the value could be used as an indicator of the best fit between 2 shells. Furthermore, it could also show the changes in surface fit or regions of changes on the full faces.
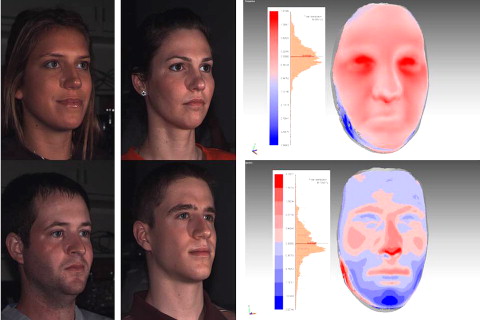
Color deviation maps, as previously mentioned, were produced by using the software tool RF6 Plus Pack 2. The color maps indicated the areas of change between the average facial shells. In this study, blue areas showed negative changes, and red areas showed positive changes ( Fig 3 ).
Surface areas and shapes were automatically generated by RF6. These shapes were obtained when a previous tolerance of 0.425 mm was applied to the paired surface shells studied. The areas that corresponded to 0.425 mm were deemed to be similar surfaces, whereas surface areas above this tolerance showed as surface shapes and color deviations.
Results
A sample of 217 subjects was acquired. Seventeen scans were excluded because they did not meet the inclusion criteria or had poor image quality. In total, 100 subjects (50 women, 50 men) from each group were obtained, making the final sample 200 subjects.
The mean ages were 23.5 years for the Texas group and 22.7 years for the Hungarian group.
The surface shells for each average subgroup were superimposed by using a previously denoted superimposition technique. These results are as follows.
Distinct differences in the absolute linear measurements between surface shells were noted in the subgroups. These linear differences ranged from 0.44 mm (HUN-M vs HOU-M) to 2.57 mm (HOU-F vs HUN-M). The results are shown in Table I .
Stay updated, free dental videos. Join our Telegram channel
VIDEdental - Online dental courses


