Introduction
There are disparities in access to orthodontic treatment for children from low-income families. Systematic programs of limited-care interceptive and preventive orthodontics have been proposed as a solution. The purpose of this randomized clinical trial was to compare dental outcomes and funding eligibility from a group of Medicaid patients randomized to receive interceptive orthodontics (IO) in the mixed dentition or observation (OBS).
Methods
One hundred seventy Medicaid-eligible children were randomized to receive IO or OBS and followed for 2 years, when complete data were available on 72 and 74 children, respectively. The 2-year changes in the peer assessment rating (PAR) were compared using the Student t test. The proportions of children no longer eligible for Medicaid funding as defined by handicapping labiolingual deviation (HLD) scores less than 25 at the 2-year follow-up were compared with the chi-square test.
Results
The IO patients had significantly greater decreases in the PAR scores—50%–compared with the OBS subjects, –6% ( P <0.001). Negative and positive overjet and maxillary alignment were the components most affected by IO; they decreased by 11.0, 7.2, and 3.7 PAR points, respectively ( P <0.001). Overbite showed little change. At the 2-year follow-up, 80% of the IO patients’ malocclusions that qualified initially were no longer deemed medically necessary by the HLD index, compared with 6% in the OBS group ( P <0.001).
Conclusions
IO significantly reduces the severity of malocclusions and moves most from the “medically necessary” category to elective but does not produce finished results for most patients. Overjet and alignment were most readily corrected by interceptive treatment. Deep overbites were the least susceptible to IO correction.
Orthodontic treatment has become increasingly common in North America. A major epidemiologic study found that the need for treatment in the United States was about 60%. This same study found that, in each racial group, treatment need can be as high as 59%, but that only 30% of white people, 11% of Mexican-Americans, and 8% of black people actually received treatment. Orthodontic treatment is much more prevalent in higher socioeconomic groups. A Medicaid amendment in 1967 (Title XIX) requires states to provide some orthodontic treatment coverage for children of low-income families. Despite this mandate, disparities persist.
One explanation for the disparity in access to orthodontic services is that there are not enough providers. Although a quarter of orthodontists participated in Medicaid in the Washington state in 1999, most treated only a few patients, and 10 clinicians provided 81% of all the publicly funded treatment. Orthodontists cite many reasons for nonparticipation in Medicaid programs, including low reimbursement rates, poor patient compliance, and excessive bureaucracy.
One method to increase access to orthodontic services to low-income families is to adopt wider use of interceptive treatments. Most patients who receive interceptive orthodontic treatment do not have all of their orthodontic problems addressed, and providing only partial treatment is not acceptable to most orthodontists. However, limited interceptive treatment can reduce the need for comprehensive treatment in the Medicaid population and eliminate malocclusions considered to be medically compromising. Because interceptive treatment is typically shorter and less costly than comprehensive treatment, it can reduce the cost per patient and might allow more patients to be treated without increasing overall costs. Washington Medicaid reimbursement for interceptive orthodontics is approximately a third that for comprehensive treatment, so interceptive orthodontic treatment could increase the number of children receiving treatment for the same health-care dollars. Studies have shown that interceptive treatment might be an effective strategy for reducing the severity of malocclusion and move orthodontic treatment from medically necessary to elective. Interceptive treatment might also attract more providers willing to treat Medicaid-funded patients because of shorter treatment times and simpler treatments. In a survey of orthodontists in Washington, most believed that early treatment provides benefits to patients. Orthodontists who did not participate in Medicaid seemed willing to do so if funding for early treatment was well structured. Data are not available for comparing interceptive treatment and no treatment in a Medicaid population in the United States.
The aim of this study was to compare dental outcomes from a group of Medicaid patients randomized to receive interceptive orthodontic treatment in the mixed dentition with another group randomized to only observation. (This randomized clinical trial was approved by the Institutional Review Board to provide comprehensive treatment to children in the observation group after their permanent dentition erupted. This group is currently undergoing treatment or awaiting treatment, so only their data at the observation stage are presented here.)
We also evaluated Medicaid eligibility and the changes after interceptive treatment.
Material and methods
A randomized clinical trial was designed to compare mixed dentition interceptive orthodontic treatment with comprehensive permanent dentition treatment in a Medicaid population. When completed, this trial will compare interceptive orthodontics with comprehensive orthodontics over 4 years. This report describes only the comparison between interceptive orthodontics and the observational control during the first 2 years ( Fig 1 ). The sample size was chosen to have greater than 80% power to detect an average difference of 5 peer assessment rating (PAR) points between Medicaid patients who received early treatment and those who did not. The sample size calculations were based on PAR scores observed in treating 259 patients in a randomized controlled trial studying early Class II treatment at the University of Florida. Patients were recruited from April 2003 to January 2005.
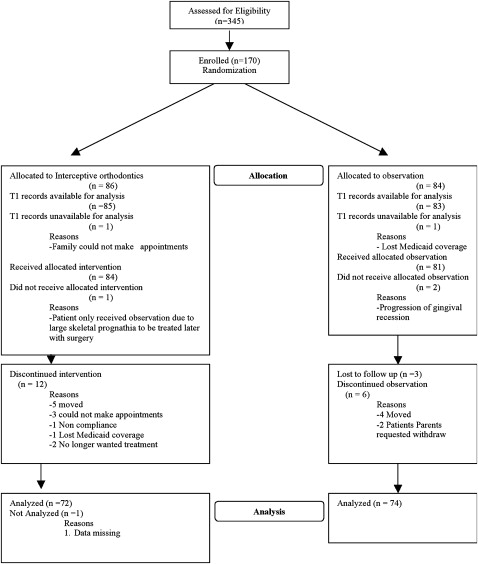
The recruitment process consisted of screening 345 children referred by local community health clinics; 170 were enrolled. At enrollment, the patients were randomized by using block randomization to 2 groups: interceptive or comprehensive orthodontic treatment. The randomization was done in blocks of 10; of each consecutive 10 patients, 5 were assigned to interceptive and 5 to comprehensive treatment. The data manager and the biostatistician maintained the randomization lists. Randomization tables were created by the statistical software S-plus (TIBCO Software Inc, Palo Alto, Calif). Patients were enrolled by the study coordinator and assigned identification numbers. The study coordinator forwarded the newly enrolled patient numbers to the data manager, who then communicated the treatment assignments. Treatment assignments were concealed until the intervention was assigned. In the initial 2 years, the interceptive patients received interceptive orthodontic treatment, and the comprehensive patients received periodic recalls only. All records were completed by April 2008. In the next 2 years, the interceptive subjects will be periodically observed, while the comprehensive group receives comprehensive orthodontic treatment. The purpose of this interim report was to compare dental outcomes by evaluating the PAR scores after interceptive treatment or observation. Additional analyses were done to compare Medicaid eligibility and the changes experienced by patients after interceptive treatment.
The criteria for enrollment in the study were as follows: (1) Medicaid-enrolled dental and medical patients from community dental clinics in Seattle; (2) in active maintenance by their health care providers at the referring dental clinic; (3) malocclusion acceptable for funding under the Washington state Medicaid plan for (a) alignment issues such as spacing, crowding, early loss of deciduous teeth, tooth agenesis, and ectopic eruptions, (b) anteroposterior problems such as Class II, Class III, protrusion, anterior crossbites, and excess overjet, (c) vertical problems such as open bite and overbite, (d) ttransverse problems such as posterior crossbites, and (e) functional problems such as habits and centric relation-maximum intercuspation discrepancies.
Patients were excluded for the following reasons: active oral disease including but not limited to caries, poor compliance with past medical and dental treatments, anticipated relocation from the Seattle area in the next 4 years, unacceptable oral hygiene observed during screening, craniofacial anomalies, physically unable to accomplish simple orthodontic appliance operations, history of previous orthodontic treatment, posterior crossbite with a shift, or unwilling to be randomized. Posterior crossbite with a shift was excluded because we thought it was unethical to randomize patients with this condition.
Recruitment took place after approval of the clinical trial from the Institutional Review Board. All patients and their parents or guardians were informed of the investigational nature of the study; guardians signed an approved informed consent statement for orthodontic treatment and participation in research, in accordance with institutional and federal guidelines. Children gave written assent.
Patients randomized to interceptive treatment received an orthodontic problem list prepared by a project orthodontist after clinical records were examined. A plan of appropriate interceptive orthodontic treatment was formulated based on the consensus of 3 project orthodontists (G.J.K., G.J.H., and G.M.G) independently examining the records. This plan was presented to the patient and the parent. After acceptance, the plan was followed until 2 project orthodontists agreed that the objectives were achieved, or a maximum 2 years had elapsed. Treatment appointments were scheduled at appropriate intervals determined by the project orthodontists. To reduce proficiency bias, orthodontic graduate students, supervised by faculty, performed all treatments. Models were taken at baseline (T1) and after the planned interceptive treatment or 24 months, whichever came first (T2).
Statistical analysis
Pretreatment and posttreatment dental casts were scored by using the PAR and the handicapping labiolingual deviation (HLD) index. The pretreatment and posttreatment casts were combined, assigned a number, and scored in random order by 2 calibrated and blinded examiners (C.J.J.). The examiners were trained and calibrated by other certified examiners. The 2 PAR scores (United Kingdom weightings) were averaged to obtain the final PAR scores. When the individual PAR scores differed by more than 5 points, the 2 examiners met and scored the models by consensus. Fifteen percent of the casts needed to be scored by consensus. Ten casts were randomly selected to calculate intrarater reliability.
The HLD scores were determined from the casts by using the Washington state modifications. Ten casts also were randomly selected to determine intraexaminer reliability. By using root mean square error, intraexaminer reliability was determined to be acceptable (1.8 PAR points and 2.3 HLD points).
The data were analyzed with statistical software SPSS for Mac (version 16.0, SPSS, Chicago, Ill). Descriptive statistics were performed on demographic and occlusal data. The significance level was set at P <0.05 for all analyses. Independent Student t tests were used to evaluate differences between total PAR percentage reductions; PAR components also were evaluated to assess the relative extent to which the various parts of the malocclusion were affected by interceptive treatment. When evaluating PAR component changes, the Bonferroni adjustment was used ( P <0.007) to prevent statistical errors caused by multiple comparisions. To assess the effect of interceptive treatment on Medicaid eligibility between time points, the McNemar test for paired dichotomous data was used. To test for differences in Medicaid eligibility after interceptive treatment between the 2 groups of the study, the chi-square test was used.
Results
Demographic data are reported in Table I . Ages, ethnicities, sex ratios, and occlusal relationships were well matched with no significant differences between the groups. We analyzed the data to detect any systematic differences introduced by differential dropouts and found none.
| With dropouts included | Without dropouts included | |||||
|---|---|---|---|---|---|---|
| Interception | Observation | P value | Interception | Observation | P value | |
| n | 86 | 84 | N/A | 72 | 74 | N/A |
| Sex | 0.874 | 0.744 | ||||
| Male | 42 (49%) | 40 (48%) | 36 (50%) | 35 (47%) | ||
| Ethnicity | 0.297 | 0.489 | ||||
| Black | 32 (38%) | 38 (45%) | 27 (38%) | 32 (43%) | ||
| Asian | 15 (17%) | 21 (25%) | 13 (18%) | 18 (24%) | ||
| White | 15 (17%) | 11 (13%) | 10 (14%) | 10 (14%) | ||
| Hispanic | 12 (14%) | 6 (7%) | 12 (17%) | 6 (8%) | ||
| Other | 12 (14%) | 8 (10%) | 10 (14%) | 8 (11%) | ||
| Initial Angle classification | 0.837 | 0.873 | ||||
| Class I | 37 (43%) | 37 (44%) | 31 (43%) | 33 (45%) | ||
| Class II | 36 (42%) | 32 (38%) | 30 (42%) | 28 (38%) | ||
| Class III | 13 (15%) | 15 (18%) | 11 (15%) | 13 (18%) | ||
| Initial diagnostic classification | ||||||
| Anterior crossbite | 39 (46%) | 33 (39%) | 0.580 | 35 (49%) | 28 (38%) | 0.189 |
| Posterior crossbite | 23 (27%) | 16 (20%) | 0.269 | 21 (29%) | 16 (22%) | 0.295 |
| Open bite | 24 (28%) | 22 (27%) | 0.765 | 19 (26%) | 20 (27%) | 0.931 |
| Age in years (SD) | 9.3 (1.8) | 9.3 (1.2) | 0.888 ∗ | 9.3 (1.6) | 9.3 (1.2) | 0.979 ∗ |
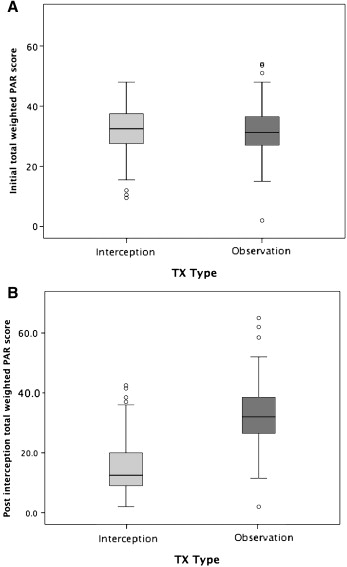
The total weighted PAR scores for T1 and T2 are shown in Table II and Figure 2 . There were no significant differences between the interceptive and observational groups at T1. However, there was a significant difference at T2 in the percentage of improvement, with the interceptive group showing a mean improvement of 49.6%, whereas the observational group had a mean worsening of –5.7%. Fifty-five of the 72 (76%) interceptive patients showed greater than 30% PAR improvement, but only 3 of the 74 (4%) observational patients showed greater than 30% improvement. Seventeen of the 72 patients in the interceptive group had greater than 70% PAR improvement, whereas none of the 74 observation group patients had 70% improvement.
| Interception | Observation | ||||||
|---|---|---|---|---|---|---|---|
| n | Mean | SD | n | Mean | SD | P value | |
| T1 PAR score | 85 | 30.7 | 8.2 | 83 | 31.4 | 9 | 0.65 |
| T2 PAR score | 72 | 15.4 | 9.7 | 74 | 32.9 | 11.2 | <0.001 |
| PAR improvement (%) | 72 | 49.6 | 30.4 | 74 | −5.7 | 20.8 | <0.001 |
To better understand how the various components of malocclusion respond to interceptive treatment or observation, the PAR scores were divided into their respective weighted components. We used weighted component scores because the weights reflect the clinical significance of the respective changes as validated by orthodontists. The differences between the T1 and T2 components are shown in Table III . As illustrated, the ranking of mean component improvement in PAR points was as follows: negative overjet (11), positive overjet (7.2), maxillary anterior alignment (3.7), and mandibular anterior alignment (0.6). There were no significant group differences in overbite, open bite, and centerline correction.
| Interception | Observation | ||||
|---|---|---|---|---|---|
| Mean | SD | Mean | SD | P value | |
| Negative overjet | 11.0 | 7.7 | −0.7 | 6.1 | 0.000 |
| Overjet | 7.2 | 9.1 | 0.5 | 4.2 | 0.000 |
| Maxillary anterior segment | 3.7 | 3.4 | −0.9 | 1.6 | 0.000 |
| Mandibular anterior segment | 0.6 | 2.1 | −1.0 | 2.7 | 0.000 |
| Open bite | 3.1 | 3.4 | 1.2 | 3.6 | 0.151 |
| Centerline | 1.4 | 3.2 | 0.4 | 3.5 | 0.167 |
| Overbite | −0.1 | 1.7 | 0.2 | 1.3 | 0.345 |
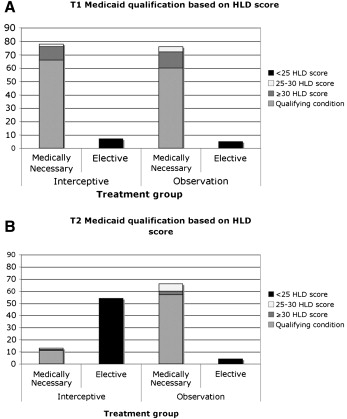
The Medicaid eligibility data between time points and groups are shown in Table IV and Figure 3 . Whereas some patients at T1 did not qualify for Medicaid coverage based on the HLD index, those same patients could have had elective treatment at T2 (data not shown). Because no patients had elective needs at T1 but then later the needs were considered medically necessary, only those who were classified as medically necessary according to the HLD index at T1 were compared for T2 changes ( Table IV ). The interceptive group showed an 81% reduction in patients with treatment need as assessed by the HLD index. Of the original 67 patients with treatment needs at baseline, 53 no longer had a medically handicapping malocclusion at T2. In the observational group, only 6% of those with a medically handicapping malocclusion at T1 were considered elective at T2.
| Interception | Observation | ||||||
|---|---|---|---|---|---|---|---|
| n | Medically necessary | Elective | n | Medically necessary | Elective | P value | |
| T1 | 85 | 78 (92%) | 7 (8%) | 83 | 78 (94%) | 5 (6%) | 0.61 |
| T2 ∗ | 67 | 13 (19%) | 54 (81%) | 70 | 66 (94%) | 4 (6%) | <0.001 |
∗ Excludes patients considered elective at T1 and those lost to follow up.
The T2 eligibility of both groups was also analyzed to determine whether there were differences based on Medicaid qualifications for treatment (data not shown). Although no differences were found in either group, in the interceptive group, the patients who qualified with an anterior crossbite had the most successful outcome (96%). Patients with a deep impinging overbite, high HLD score, or significant negative overjet had the least successful outcome, but, even in these patients, two thirds achieved success.
Univariate logistic regression models were constructed by using HLD success as the dependent variable and various PAR, HLD, treatment, and demographic variables as the independent variables ( Table V ). The only significant predictor of success was the orthodontist’s noting that treatment showed progress during the treatment period. Univariate linear regression models were also constructed with PAR score improvement as the dependent variable and various PAR, treatment, and demographic variables as predictors ( Table VI ). In this case, the variables significantly associated with PAR at T2 were T1 PAR score, T1 maxillary alignment, overjet, and the orthodontist’s noting treatment progress.
| Odds ratio | 95% CI | P value | |
|---|---|---|---|
| T1 HLD qualification | 0.29 | ||
| >25 HLD score | 1 | — | |
| Deep impinging overbite | 0.75 | (0.14, 3.90) | |
| Anterior crossbite | 8.63 | (7.81, 95.26) | |
| >9 mm of overjet | 1.68 | (0.22, 12.81) | |
| >3.5 mm of negative overjet | 0.75 | (0.05, 11.65) | |
| T1 PAR score | 0.97 | (0.90, 1.05) | 0.46 |
| T1 maxillary alignment PAR score | 1.15 | (0.90, 1.46) | 0.26 |
| T1 mandibular alignment PAR score | 0.95 | (0.66, 1.35) | 0.77 |
| T1 overjet PAR score | 0.97 | (0.86, 1.10) | 0.64 |
| T1 negative overjet PAR score | 0.88 | (0.75, 1.04) | 0.14 |
| T1 overbite PAR score | 0.75 | (0.47, 1.17) | 0.20 |
| T1 centerline PAR score | 0.93 | (0.75, 1.15) | 0.52 |
| Age | 1.04 | (0.73, 1.49) | 0.81 |
| Male | 0.38 | (0.10, 1.36) | 0.13 |
| Number of missed appointments | 1.21 | (0.93, 1.59) | 0.16 |
| Oral hygiene ∗ (0 = unacceptable, 1 = marginal, 2 = acceptable) | 0.44 | (0.06, 3.04) | 0.41 |
| Status of fixed appliance ∗ (0 = not as placed, 1 = appliance as placed) | 0.68 | (0.02, 20.40) | 0.83 |
| Status of removable appliance ∗ (0 = lost, 1 = minimal wear, 2 = worn but did not bring, 3 = worn as directed) | 0.61 | (0.25, 1.47) | 0.27 |
| Self-reported compliance ∗ (0 = none, 1 = less than prescribed, 2 = greater than or equal to amount prescribed) | 1.00 | (0.27, 3.68) | 0.99 |
| Orthodontist-assessed treatment progress ∗ (0 = no progress, 1 = slow, 2 = progress shown) | 13.50 | (1.20, 151.40) | 0.04 |
| Patient’s attitude toward treatment ∗ (0 = negative, 1 = neutral, 2 = positive) | 1.21 | (0.13, 11.01) | 0.87 |
| Initial Angle classification | 0.16 | ||
| Class I | 1 | — | |
| Class II | 0.43 | (0.10, 1.90) | |
| Class III | 0.19 | (0.03, 1.04) | |
| Ethnicity | 0.39 | ||
| White | 1 | — | |
| Hispanic | 0.55 | (0.04, 7.21) | |
| Black | 0.89 | (0.08, 9.69) | |
| Asian | 0.18 | (0.01, 1.86) | |
| Other | 0.44 | (0.03, 5.88) |
Stay updated, free dental videos. Join our Telegram channel
VIDEdental - Online dental courses


