Introduction
The objective of this study was to compare the locations of the centers of resistance (CRes) in the buccolingual (BL) and mesiodistal (MD) directions of the mandibular central incisors of 6 dogs.
Methods
Based on microcomputed tomography images of the teeth and their supporting tissues, solid models were used to build finite element models.
Results
The CRes locations for the 6 specimens were determined for displacements in the BL and MD directions with finite element calculations. Measured from the alveolar crest, the BL and MD locations were 43% to 51% and 31% to 43% of root length, respectively. Their average locations, 46.2% and 38.3%, were statistically different at the 95% CI.
Conclusions
The CRes location for BL tooth movement is significantly more apical than its MD counterpart.
Orthodontic tooth displacement is described as translation, rotation, or a combination thereof. Any such movement can be characterized by its associated center of rotation (CRot). Clinically, the displacement has been described in 2-dimensional planes. In each plane, the orthodontic load (force and moment) system required to achieve a desired displacement depends on the position of the tooth’s center of resistance (CRes). Its location is a function of root and supporting structure anatomy, and their mechanical properties. The most popular definition of CRes, a powerful conceptual tool, is the point, fixed relative to the root, that, if a force were applied to it, the tooth would undergo pure translation. An alternate definition is the point about which the tooth would rotate if only a moment of a couple were applied (anywhere) to the tooth. Clinically, the distance between the CRes and the bracket is equal to the moment-to-force ratio (M/F) required of a loop for tooth translation, and the amount of tooth tipping and root correction can be controlled by deviating from that ratio.
Experimental and analytical methods were used to locate the CRes. For example, Yoshida et al used a magnetic sensing system to demonstrate that in-vivo central-incisor CRes locations were influenced by bone height. Matsui et al used a photoelastic model to study the CRes of the anterior arch segment. However, most studies were based on simplified idealized finite element (FE) models in which CRes locations of specific teeth were reported. A 2-dimensional mathematical model was used to show that the most occlusal and apical CRes locations correspond to triangular and rectangular root shapes, respectively. A root-like shape produced a more apically located CRes than was experimentally measured by Yoshida et al but close to the location reported by Christiansen and Burstone. These results indicate that the more tapered the root, the more occlusal the CRes. Vollmer et al compared idealized and realistic 3-dimensional (3D) root anatomies and found that the latter produced a CRes location that was consistent with many other groups’ findings, but it was more apical than predicted by their more tapered idealized root. This trend seems reasonable because the apical root region cross-sectional area decreases with more taper and, thus, produces relatively less resistance to root motion near the apex. In general, analytical and experimental studies have indicated that the CRes of a single-rooted tooth is somewhere in the middle third of its root. However, it has not been reported whether a tooth has a single CRes or whether the CRes also depends on the direction of displacement.
Because it forms the compliant structure that supports the tooth, the periodontal ligament (PDL) is the primary determinant of the CRes location. FE models of the bone-PDL-tooth complex have been used to study the stresses in the complex and tooth movement. Thus far, however, only 2 articles have shown the PDL as a structurally realistic tension-only fiber-reinforced matrix. Provatidis did not directly address CRes location but found that it depended on fiber volume concentration when fiber angulations were not varied. Qian et al showed that the inclusion of fibers in the PDL model was an important determinant of CRes and CRot locations, although fiber orientation and stiffness, within reasonable ranges, had relatively little influence.
No study has compared buccolingual (BL) with mesiodistal (MD) CRes locations, and more realistic models are needed. Thus, the main objectives of this 3D FE study were to improve on the previously reported model and to investigate the effects of orthodontic load direction on the CRes of anatomically correct dog teeth.
Material and methods
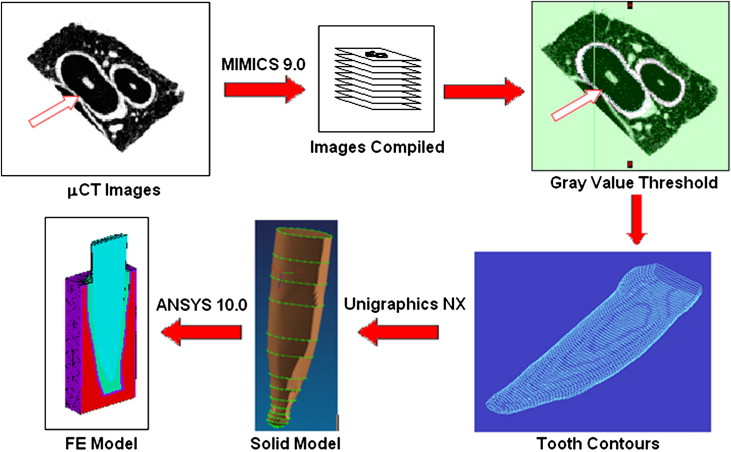
Six mandibular central incisors and their supporting tissues (PDL and alveolar bone) were obtained from 6 dogs that had been killed for an unrelated project. The specimens were scanned in a micocomputed tomography (μCT) unit (model 1072, SkyScan, Kontich, Belgium) to form the bases for 3D FE models. MIMICS software (version 9.0, Materialise, Leuven, Belgium) and Unigraphics NX (Siemens, Plano, Tex) were used to convert the μCT images into solid models as follows. For a tooth with a root approximately 12 mm long, 70 sections were selected along its long axis to assess the root, PDL, and alveolar bone. With MIMICS, the PDL and root boundaries in each section were demarcated by contour lines based on gray value threshold regions ( Fig 1 ). An IGES file of each structure’s contour was created and loaded into Unigraphics to convert them into solid structures. Depending on the anatomic complexity of the root and the PDL, 10 of the 70 sets of contour lines were selected for the model. A set of 20 equidistant points on each line was made, and second-order interpolation curve fitting was performed to smooth the contour. The solid structures of the PDL and the root were constructed from the resulting smoothed contours. A uniform cortical bone “shell” (lamina dura) was created around the PDL by offsetting the PDL contours. The process is shown in Figure 1 .
The solid model was imported into ANSYS software (version 10.0, ANSYS, Canonsburg, Pa) for assembly, meshing, and analysis. The bone, PDL matrix, and tooth were meshed with 10-node tetrahedral (SOLID187) elements. An atypical feature of the model is the incorporation of tension-only 3D spar (LINK10) elements to represent the principal fibers of the PDL. To create the fibers, a program was written to produce an ANSYS macro file that generated radially projecting fibers from root nodes to bone-socket nodes, randomly oriented between 20° and 30° to the horizontal, with a relatively even distribution within that range ( Table I ). In the apical region, the fibers were nearly vertical ( Fig 2 ). This amounts to the modeling of the PDL as a composite material that consists of a fiber-reinforced matrix.
| Angle (°) | Elements (n) |
|---|---|
| 20-22 | 1711 |
| 22-24 | 1476 |
| 24-26 | 1320 |
| 26-28 | 1327 |
| 28-30 | 1381 |
| Apical | 321 |
| Total | 7536 |
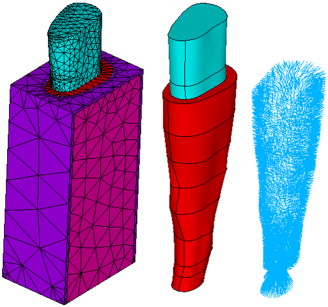
Material properties ( Table II ) and fiber characterizations ( Table III ) were obtained from the literature. As is common practice, bone and root were idealized as homogeneous and linear elastic. This is justifiable because, compared with the PDL, the bone and root elastic moduli are several orders of magnitude greater. On the other hand, PDL structural verisimilitude was maintained to the extent possible. In previous studies, particularly those with idealized models, PDL thickness was assumed to be uniform, but it is clear that PDL width varies not only from tooth to tooth, but also within each tooth—a variation that is incorporated in this model ( Fig 3 ).
| Structure | Elastic modulus (E) |
Poisson’s ratio (ν) |
|---|---|---|
| Alveolar bone | ||
| Cortical | 13 GPa | 0.30 |
| Cancellous | 1 GPa | 0.30 |
| Root | ||
| Dentin | 18 GPa | 0.30 |
| PDL | ||
| Matrix | 0.5 MPa | 0.47 |
| Fiber | 10 MPa | 0.35 |
| Region | Fiber density (fibers/100 μm) | Fiber diameter (μm) |
|---|---|---|
| Coronal and middle | 22.1 | 3.4 |
| Apical | 13.2 | 4.6 |
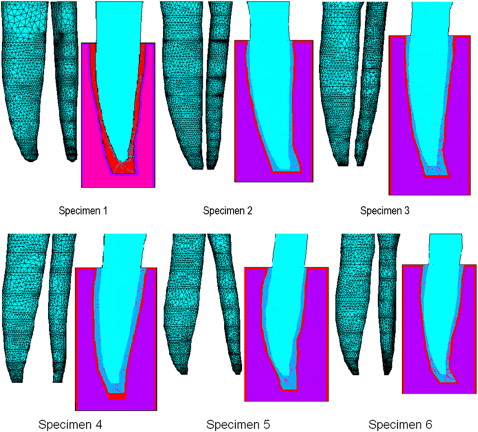
Each model consisted of an actual root shape and its specific PDL thickness. Because bone and crown have negligible effects on tooth displacement, they were simplified. Each model consisted of a homogeneous tooth (entirely dentin), a fiber-reinforced PDL matrix, and alveolar bone (cancellous bone encased in a thin layer of cortical bone). Zero displacements at the bottom, mesial, and distal sides of the alveolar bone were applied as the boundary conditions. The FE models contained approximately 100,000 elements and 115,000 nodes. Because of nonlinear fiber properties and the large strains experienced by the relatively soft PDL tissues, nonlinear static analyses were performed.
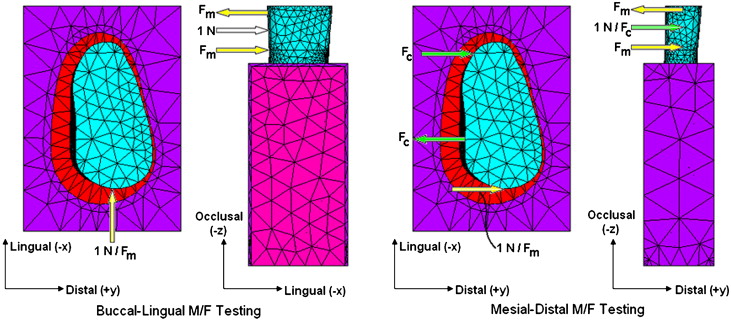
The unknown distance of CRes from the known line of action of the applied force (F) is equal to the required M/F for pure translation of the tooth. A Cartesian coordinate system was created. Its origin was located at the crown, where the force acted with its positive x-axis directed buccally, its y-axis mesially, and its z-axis occlusally. With this coordinate system definition, for the BL (first order) and the MD (second order) displacements, the relevant M/F ratios are My/Fx and Mx/Fy, respectively ( Fig 4 ). Based on these principles, the locations of CRes were calculated by using a parametric approach. For the BL direction, a lingually tipping force (Fx = –1.0 N) and an incrementally increasing correction moment (My = –1.0, –2.0, –3.0… N-mm, or equivalently, My/Fx = 1.0, 2.0, 3.0…) to counter the moment produced by Fx about the CRes were applied to the buccal sides of the crowns. The sought My/Fx produced tooth translation. The same procedure, but with Fy (= +1.0 N) and Mx (= –1.0, –2.0, –3.0… N-mm) was performed in the MD direction. But, in contrast to the BL movement, the line of action of the distally directed Fy = +1.0 N force (also applied to the buccal surfaces of the crowns) did not pass through the long axes of the teeth, thereby producing a confounding (+Mz) moment that rotated the teeth along their long axes. This third-order rotation was minimized with the application of a counter-rotating couple, Mz = –Fc x d N-mm ( green arrows in Fig 4 ), with Fc = 1.0 N and d equal to the distance between the root’s centerline and the line of action of Fy.