Introduction
This prospective observational study evaluated changes in the 3-dimensional position and remodeling of the mandibular rami, condyles, and chin at splint removal and 1 year after mandibular advancement surgery.
Methods
Presurgery, splint removal (4–6 weeks postsurgery), and 1-year postsurgery cone-beam computed tomography scans of 27 subjects were used. Superimposition on the cranial base was used to assess positional or remodeling changes in the anatomic regions of interest. Surface distance displacements were visually displayed and quantified by 3-dimensional color maps. A 1-sample t test was used to assess the average postsurgical changes of each region of interest. The level of significance was set at 0.05.
Results
After antero–inferior chin displacement with surgery (mean, 6.81 ± 3.2 mm at splint removal), the average 1-year postsurgery displacement was not statistically significant ( P = 0.44). Postsurgical adaptations greater than 2 mm were observed in 48% of the patients: 16% with an additional anterior–inferior displacement of the chin of 2 to 4 mm, and 4% with ≥4 mm; 20% had postero-superior movement of 2 to 4 mm, and 8% had postero-superior movement of ≥4 mm. The condyles tended to move, on average, ≤2 mm supero-posteriorly with surgery, and this small positional displacement was maintained 1 year postsurgery (right condyle, P = 0.58; left, P = 0.88). The rami exhibited outward (lateral) movements with surgery, with greater displacement of the inferior part of the rami (≥2 mm in 65% of the subjects). This torque of the ramus with surgery was stable 1 year postsurgery.
Conclusions
Three-dimensional assessment of skeletal changes with mandibular advancement surgery shows that nearly half of the patients have >2 mm change in chin position from splint removal to the 1-year follow-up, with approximately equal chances of anterior and posterior movement. Torque of the rami usually occurs with mandibular advancement surgery.
Although mandibular advancement surgery is considered a highly stable procedure, some clinical concerns have been raised regarding condylar changes that can lead to sagittal relapse and anterior bite opening. Assessment of surgical treatment outcomes with 3-dimensional (3D) cone-beam computed tomography (CBCT) images and superimposition tools allowed the identification and quantification of bone displacement and remodeling that can help to explain the interactions between dental, skeletal, and soft-tissue components that underpin the response to treatment.
Previous studies used 3D virtual model superimposition techniques to assess postsurgical outcomes and stability in Class III patients; however, postsurgical outcomes of Class II correction have not been evaluated with this methodology. The purpose of this study was to evaluate the 3D changes in the positionand remodeling of the mandibular rami, condyles, and chin at splint removal and 1 year after mandibular advancementsurgery.
Material and methods
Twenty-seven patients (9 men, 18 women; mean age, 30.04 ± 13.08 years; range, 17.2–48.1 years) who had surgery at Memorial Hospital at the University of North Carolina (UNC) by a surgeon and resident assistant from the Department of Oral and Maxillofacial Surgery were recruited for this prospective observational study. The protocol was approved by the Biomedical Institutional Review Board, and informed consent was obtained from all subjects. All patients had normal or horizontal facial patterns and skeletal Class II discrepancies with greater than 5 mm overjet that were severe enough to warrant orthognathic surgery. All patients underwent orthodontic treatment and had mandibular advancement surgery with bilateral sagittal split osteotomy. Nine participants also had genioplasty as an adjunctive procedure. Patients with anterior open bite, cleft lip or palate, or skeletal disharmonies from trauma or degenerative conditions such as rheumatoid arthritis were excluded.
CBCT scans were taken before surgery, at splint removal (4–6 weeks postsurgery), and 1 year postsurgery (after orthodontic treatment) with the NewTom 3G (Aperio Services, Sarasota, Fla). The imaging protocol involved a 36-second head CBCT scanning with a 12–in field of view. All CBCT scans were acquired with the patient biting on a thin wax bite to maintain centric occlusion. Two patients had at least 1 scan taken with the NewTom 9000 (Aperio Services), which has a 9–in field of view. Therefore, the field of view did not include the chin in the NewTom 9000 scans. The 3D models were constructed from CBCT images with a voxel dimension of 0.5 × 0.5 × 0.5 mm. Image segmentation of the anatomic structures of interest and the 3D graphic rendering were done by using the ITK-SNAP open-sourcesoftware.
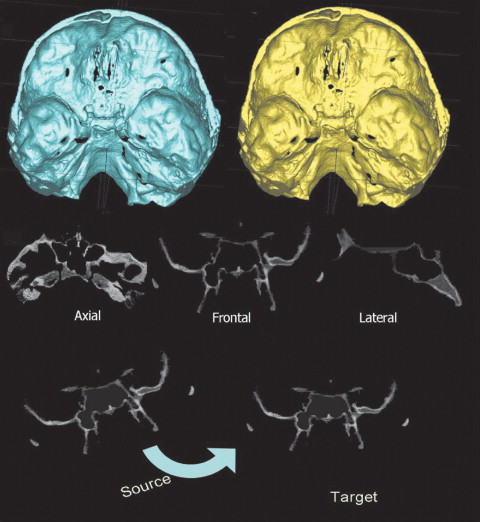
The presurgery and postsurgery models were registered with the cranial base as a reference, because this structure is not altered by surgery. A fully automated voxel-wise rigid registration method was performed with IMAGINE free software (developed by the National Institutes of Health and modified at UNC). The software compares 2 images by using the intensity of gray scale for each voxel of the presurgical cranial base ( Fig 1 ). Virtual models of the condyles (right and left), posterior rami (right and left), superior rami (right and left), inferior rami (right and left), and chin were relocated with the cranial base ( Fig 2 ).
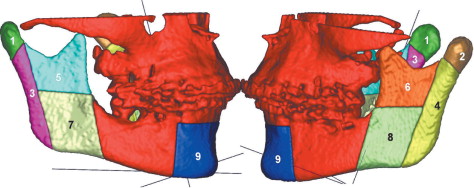
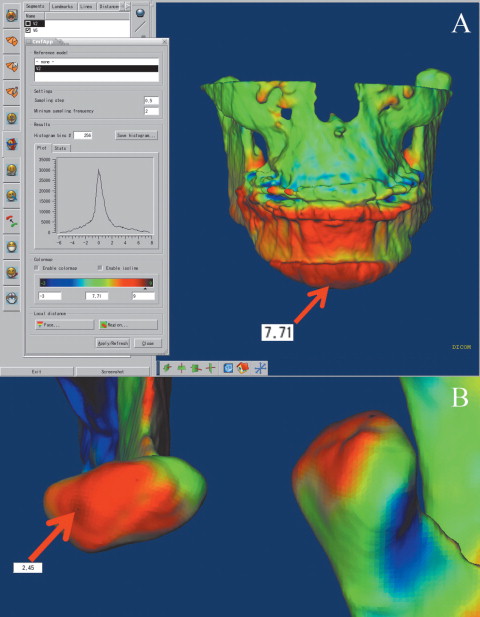
The use of multiple software for all image analysis procedures required exchanging 3D data among software and interchangeable file formats. After the registration step, all reoriented virtual models, originally saved in an open source image file format (.gipl format), were converted to a 3D interchange file format (.iv format). The software Vol2Surf (publicly available software) was used for this file format conversion, allowing the quantitative evaluation of the greatest surface displacement by the CMF software (Maurice Müller Institute, Bern, Switzerland). The CMF tool calculates thousands of color-coded point-to-point comparisons (surface distances in millimeters) between the 3D models, so that the difference between 2 surfaces at any location can be quantified. For quantitative assessment of the changes between the 3D surface models, the isoline tool was used. It allows the user to define a surface-distance value that is then expressed as a contour line (isoline) that corresponds to regions having a surface distance equal to or greater than the defined value. The isoline tool was used to quantitatively measure the greatest displacements between points in the 3D surface models for 9 anatomic regions of interest ( Figs 2 and 3 ). Positive values indicated anterior–inferior displacement of the chin, and negative values posterior-superior displacement. For the condyles, positive values represent posterior-superior displacement, and negative values anterior–inferior displacement. For the posterior borders of the rami, positive values indicate posterior displacements, and negative values anterior displacements. The lateral portion of the mandibular rami was divided into 2 parts (superior and inferior) to aid in identifying complex torque or medial or lateral movement of this region. Positive values represent lateral displacement of the rami, and negative values medial displacement. Displacements of the inferior and superior regions of the ramus in opposite directions or with different magnitudes indicate torque movement of this structure.
The largest displacements at each anatomic region of interest were computed for presurgery to splint removal (immediate surgical outcome), presurgery to 1year postsurgery (1-year postsurgical outcome), and splint removal to 1 year postsurgery (postsplint removalchange).
Statistical analysis
The greatest displacement for each region of 10 randomly selected superimpositions was measured twice, at a 2-week interval, and agreement between the replicates was assessed by using intraclass correlations(ICC).
For each anatomic region, a 1-sample t test was used to test the null hypothesis that the average postsplint removal change was 0. The level of significance was set at 0.05. The percentages of patients who experienced positive or negative displacements greater than 2 mm in each region were also calculated.
Results
Agreement between repeated measures was excellent for all anatomic regions: chin (ICC=0.98), condyles (ICC=0.92), posterior borders (ICC=0.97), superior rami (ICC=0.97), and inferior rami (ICC=0.95).
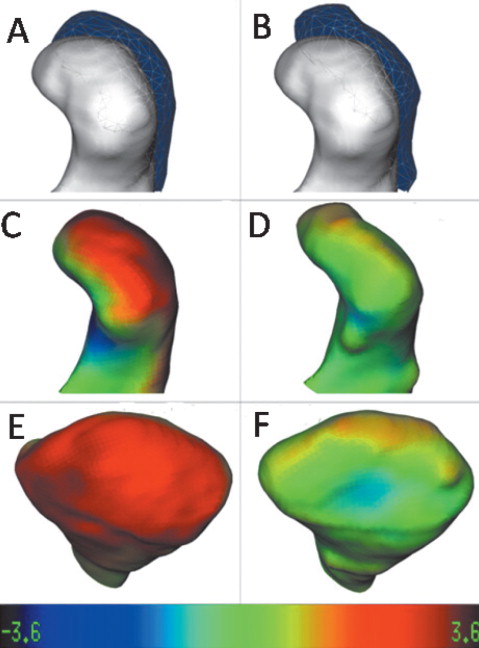
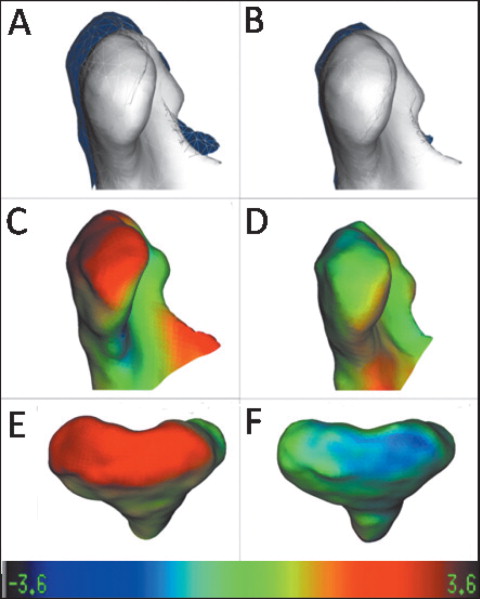
Qualitative visual analysis of the displacements and the remodeling process of the condyles indicated a general trend of posterior-superior displacement of the condyles with surgery, and a tendency for posterior condylar surface flattening adaptation (bone remodeling) at the 1-year follow-up. Examples of variability in adaptations to surgical displacements are shown in Figures 4 and 5 . In both subjects, the condyles were displaced postero-superiorly with surgery. In Figure 4 , a marked change in condylar morphology with posterior surface remodeling is evident. In Figure 5 , the postero-superior condylar displacement with surgery was not maintained at the 1-year follow-up, but the condylar morphology remained the same.
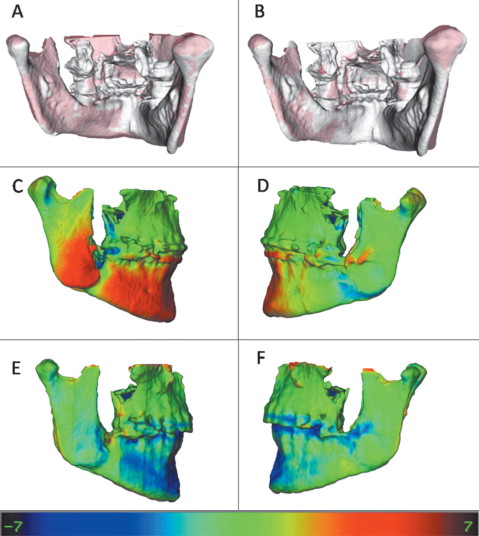
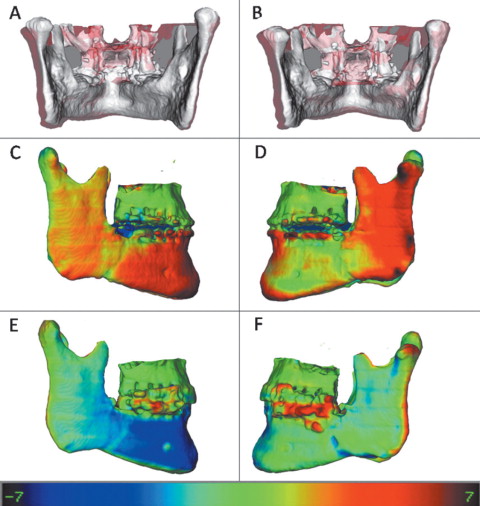
The qualitative evaluation of the ramus displacements showed that, in general, these structures had torque after the bilateral sagittal split osteotomy. Torque is usually expressed with a lateral movement greater in the inferior portion than in the superior portion of the ramus. Even though the patients in this sample were considered clinically symmetrical, the torque of the rami was generally asymmetrical ( Figs 6 and 7 ).
Color map observation in the posterior borders of the rami showed small changes on average, with displacements occurring as often to the posterior as to theanterior.
The chin was advanced anteriorly in all subjects, and the lower border of the mandible showed only small inferior displacement. Figures 6 through 8 show examples of individual variations in the stability of chin advancement postsurgically.
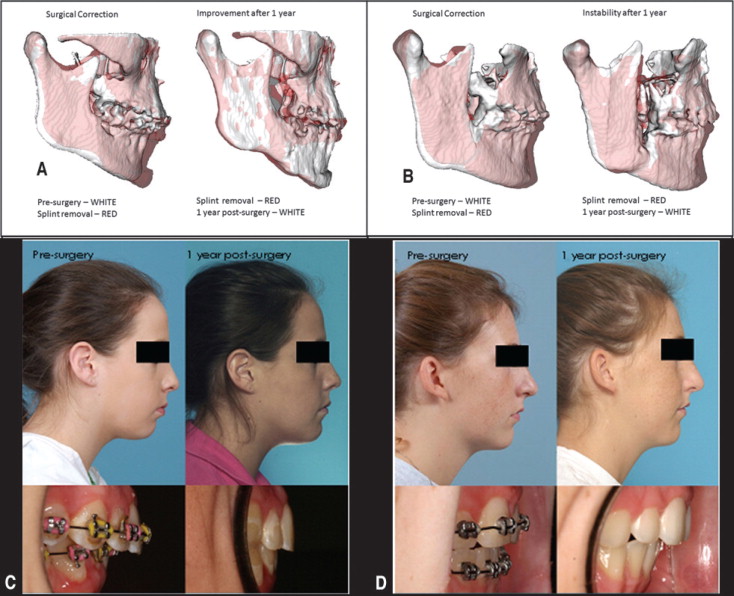
The mean mandibular advancements measured as surfaces distances in the chin region relative to the cranial base were 6.8± 3.2 mm at splint removal and 6.4± 3.4 mm at 1 year postsurgery. Interpretation of the mean behavior of the chin in this sample should take into account that 9 of the 27 subjects had genioplasty. The average postsurgical change at the 1-year follow-up was not statistically significant for the chin ( P =0.44) ( Tables I and II ). The variability in postsurgical surface displacements is illustrated in Figures 8 and 9 .
| Presurgery to splint removal | Presurgery to 1 year post surgery | ||
|---|---|---|---|
| Region | n | Mean ± SD (mm) | Mean ± SD (mm) |
| Chin | 25 | 6.81 ± 3.20 | 6.36 ± 3.41 |
| Inferior ramus (right) | 27 | 2.34 ± 2.35 | 2.10 ± 2.15 |
| Inferior ramus (left) | 27 | 2.97 ± 2.71 | 2.76 ± 2.80 |
| Superior ramus (right) | 27 | 0.62 ± 1.94 | 0.45 ± 2.08 |
| Superior ramus (left) | 27 | 1.57 ± 1.92 | 1.33 ± 2.05 |
| Posterior ramus (right) | 27 | −0.09 ± 1.84 | −0.03 ± 1.69 |
| Posterior ramus (left) | 27 | 0.08 ± 2.32 | 0.17 ± 2.55 |
| Condyle (right) | 27 | 0.81 ± 1.40 | 0.85 ± 1.59 |
| Condyle (left) | 27 | 0.98 ± 1.46 | 1.15 ± 1.54 |
Stay updated, free dental videos. Join our Telegram channel
VIDEdental - Online dental courses


