Introduction
Our objective was to analyze patterns of tooth movement and changes of arch dimension by superimposing 3-dimensional (3D) virtual models.
Methods
The sample consisted of 24 Korean adults with Class I malocclusion and minimal crowding, treated by first premolar extractions, sliding mechanics (0.022-in MBT brackets [3M Unitek, Monrovia, Calif] with 0.019 × 0.025-in stainless steel wire) and moderate anchorage. The 3D virtual maxillary casts at pretreatment and posttreatment were superimposed with the best-fit method. Linear and angular variables were measured with 3Txer program (Orapix, Seoul, Korea). Wilcoxon signed rank and Mann-Whitney tests were used for statistical analysis.
Results
There was no significant difference in the individual tooth movement between the right and left sides ( P >0.05). For the movement of each tooth, the maxillary central incisors (U1), lateral incisors (U2), and canines (U3) were significantly inclined lingually, extruded, and moved posteriorly and laterally. The maxillary second premolar (U5), first molar (U6), and second molar (U7) had significant mesial inward rotation, anterior movement, and contracted toward the midsagittal plane. The ratio of anteroposterior movement between the maxillary anterior and posterior teeth was 5:1. The amounts of contraction in U5, U6, and U7 were 1.4, 1.3, and 1.2 mm, respectively. When the amount of change between the adjacent teeth were compared, the linguoversion in U1 was significantly greater than that of U2. U3 and U5 showed significant opposite movements in all variables. There were differences only in angulation and vertical displacement between U6 and U7.
Conclusions
Superimposition of 3D virtual models could be a guideline for precise virtual treatment planning.
To analyze patterns of individual tooth movement and changes of arch dimensions in the 3-dimensional (3D) spaces is a prerequisite to making a practical treatment plan. Recently, 3D virtual model analysis has been applied to measure tooth size, and width and length of the dental arch, and to analyze tooth movement by mathematical superimposition of pretreatment and posttreatment models.
Three-dimensional scanning is a type of reverse engineering, the original purposes of which were to reduce the period of development and cost, to establish standardization, and to increase the accuracy of products. Now it is applied in the medical engineering area. The basic concepts of the 3D dental scanner (Orapix, Seoul, Korea; accuracy level: ± 0.02 mm/10 mm; resolution: 1024 × 768 pixels) are to shoot the laser light to the target material surface, detect reflection, and calculate its 3D coordinate system by using the trigonometric function. According to DeLong et al, the accuracy of measurement of 10 stone casts of a “dental” standard with known dimensions using 3D computer models was almost equal to that of a conventional contact digitizer.
The median palatal raphe, the palatal rugae, and the hard palate around the maxillary right and left first molars 4 have been suggested as reference landmarks and areas for superimposition of the maxillary models. Cha et al reported no significant difference in the horizontal and vertical movements of the maxillary central incisor and first molar between superimpositions of the lateral cephalogram and superimpositions of 3D virtual models. However, a few 3D studies have analyzed the angular and linear changes of individual tooth positions in terms of the facial axis (FA) point, which was used as the reference point for bracket bonding. Moreover, some 3D virtual model studies about tooth movement seem to be insufficient to assess 3D tooth movement. Chong et al evaluated the 3D virtual models for only rotational movements of the maxillary posterior teeth in patients whose maxillary first premolars were extracted. Cha et al measured only changes of the maxillary central incisor and first molar in the 3D virtual models, not in the whole dentition.
Therefore, the purposes of this study were to analyze patterns of individual tooth movement and changes of the arch dimensions in patients having first premolar extractions by using superimposition of 3D virtual models obtained from pretreatment (T0) and posttreatment (T1) and to present a guideline for precise virtual treatment planning.
Material and methods
The sample consisted of 24 young Korean adults (4 men, 20 women; average age, 24 years 8 months ± 4 years 11 months; SNA, 83.29° ± 3.98°; ANB, 3.10° ± 1.52°; U1-SN, 115.22° ± 5.47°; FMA, 26.48° ± 2.71°; lower lip to E-line, 3.80 ± 2.02 mm; crowding in the maxillary arch, 2.55 ± 1.08 mm; and average treatment period, 21.87 ± 4.14 months).
Since the patterns of orthodontic tooth movement and the changes in arch dimensions could be various according to the conditions of the malocclusion and the diverse treatment procedures, the sample was limited according to age, skeletal pattern, soft-tissue profile, dentition, and treatment methods: (1) young adults over 18 years old; (2) Class I malocclusion, normodivergent pattern, less than 4 mm of crowding in each arch, and ovoid and symmetric arch form; (3) lip protrusion (lower lip to Ricketts’ esthetic line >2 mm); (4) treatment including extraction of maxillary and mandibular first premolars with sliding mechanics (0.022-in slot, MBT brackets, 3M Unitek, Monrovia, Calif) and 0.019 × 0.025-in stainless steel wire, maxillary and mandibular second molars banded or bonded in the fixed treatment, and no headgear, transpalatal arches, or orthodontic miniscrews (temporary anchorage devices) used; (5) finished with Class I canine and molar relationships with normal overbite and overjet (>2 and <4 mm, respectively); and (6) after the brackets were removed carefully with debonding pliers, the remnant resin was removed by using an 8-bladed tungsten carbide bur (Fressima, FIT, Turin, Italy), an ideal cutting tool for ductile substrates such as resin materials, with little effect on the enamel structure.
The maxillary casts at T0 and T1 were scanned by using the 3D dental scanner and virtually constructed with the 3Txer program (Orapix).
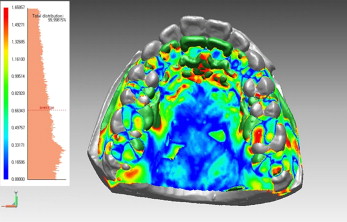
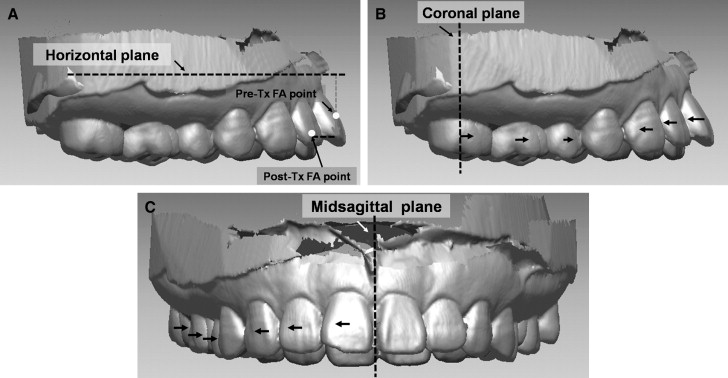
In the anterior area of the hard palate, the palatal rugae has been used as a stable landmark. Especially, the medial and lateral points of the third palatal rugae seem to be fairly stable for the estimation of changes in spite of vertical growth. In the posterior area of the hard palate, the midpalate area between the maxillary right and left first and second molars seems to show the least change during treatment, and deformation of the palatal mucosa in this area during impression taking could be minimal because of unmovable soft tissues. Therefore, we chose these areas as the stable landmarks for superimposition of the 3D virtual maxillary models at T0 and T1. Three-dimensional surface-to-surface matching (best-fit method, Fig 1 ) was used with a mean least squares technique by using polygons created by point data and a function of the Rapidform 2006 (INUS Technology, Seoul, Korea).
To prevent errors in landmark positioning, superimposition of the 3D virtual maxillary models was confirmed by superimposition of the lateral cephalometric radiographs as follows.
- 1.
After the occlusal planes of the 3D virtual models at T0 and T1 were established, the angular differences between T0 and T1 were measured ( Fig 2 ).
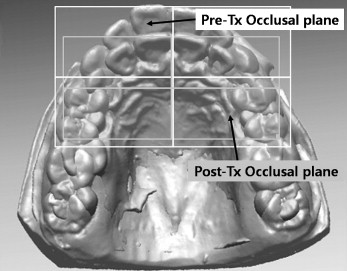
Fig 2 The occlusal plane on the 3D virtual model was established by using the midpoint of the maxillary right central incisor edge and the mesiobuccal cusp tip of the maxillary right and left first molars. The angular difference in the occlusal plane between T0 and T1 was measured. - 2.
After the angles between the Frankfort horizontal plane and the occlusal plane of the lateral cephalograms at T0 and T1 were measured, the differences were evaluated ( Fig 3 ).
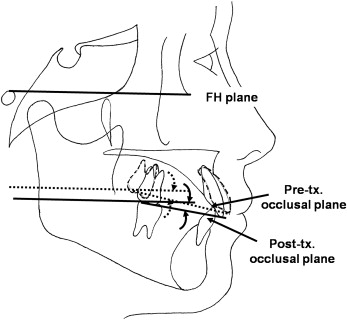
Fig 3 The angle between the Frankfort horizontal ( FH ) plane and the occlusal plane on the lateral cephalograms was established by using the maxillary central incisor edge and the mesiobuccal cusp tip of the maxillary first molar ( dotted line , parallel displacement of Frankfort horizontal plane at T0). The angular difference between T0 ( dotted line ) and T1 ( solid line ) stages was measured. - 3.
If the difference between the 3D virtual models and the lateral cephalograms was greater than 5°, superimposition of the 3D virtual models was adjusted according to the amount of occlusal plane change in the lateral cephalograms.
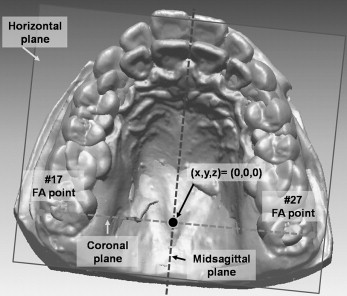
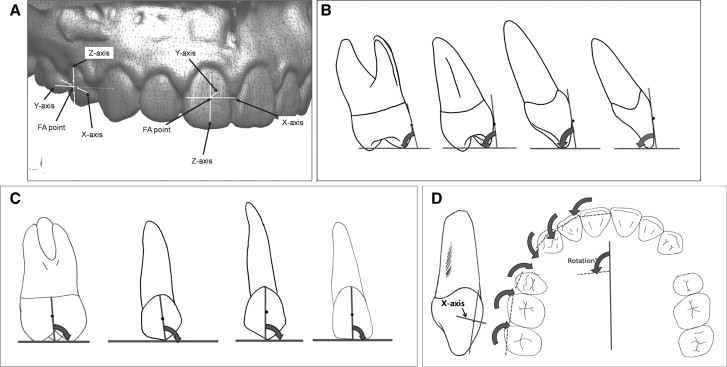
Definitions of the reference planes and landmarks are given in Figures 4 and 5 . Since the occlusal third including the incisal edge or cusp tip showed greater anatomic variations than the gingival third and could be changed during treatment because of attrition or fracture, it might not be a proper reference point to measure tooth movement. However, the FA point is easily recognized and used as a relatively stable guide for bracket positioning. In addition, the incisal edge and cusp tip can have greater changes due to the longer distance of the center of rotation than the FA point.
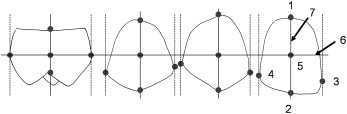
Angular and linear variables of the maxillary dentition (central incisor, U1; lateral incisor, U2; canine, U3; second premolar, U5; first molar, U6; and second molar, U7) were measured with the 3Txer program. The coordinate system for angular measurement of each tooth and the definitions of inclination, angulation, and rotation are described in Figure 6 . Reference lines and landmarks for the linear measurements and the definitions of vertical, anteroposterior, and lateral displacement are described in Figure 7 .
The reference points were digitized 3 times with a 2-week interval by 1 examiner (M.Y.C.). Intraclass correlation coefficients (ICC) for reference point identification were computed to assess intraexaminer reliability (repeatability). Since the assessment of the intraexaminer reliability of reference point identification showed excellent ICC values ( Table I ), the first digitized data were used.
| Variable | Intraexaminer reliability | P value |
|---|---|---|
| #11 | ||
| x | 0.998 | 0.000 ‡ |
| y | 0.998 | 0.000 ‡ |
| z | 0.950 | 0.001 † |
| #12 | ||
| x | 0.960 | 0.001 † |
| y | 0.993 | 0.000 ‡ |
| z | 0.993 | 0.000 ‡ |
| #13 | ||
| x | 0.838 | 0.012 ∗ |
| y | 0.992 | 0.000 ‡ |
| z | 0.988 | 0.000 ‡ |
| #15 | ||
| x | 0.999 | 0.000 ‡ |
| y | 0.997 | 0.000 ‡ |
| z | 0.891 | 0.005 † |
| #16 | ||
| x | 0.995 | 0.000 ‡ |
| y | 0.995 | 0.000 ‡ |
| z | 0.948 | 0.001 † |
| #17 | ||
| x | 0.910 | 0.004 † |
| y | 0.997 | 0.000 ‡ |
| z | 0.985 | 0.000 ‡ |
| #21 | ||
| x | 0.893 | 0.005 † |
| y | 0.994 | 0.000 ‡ |
| z | 0.910 | 0.004 † |
| #22 | ||
| x | 0.978 | 0.000 ‡ |
| y | 0.993 | 0.000 ‡ |
| z | 0.997 | 0.000 ‡ |
| #23 | ||
| x | 0.912 | 0.003 † |
| y | 0.989 | 0.000 ‡ |
| z | 0.993 | 0.000 ‡ |
| #25 | ||
| x | 0.958 | 0.001 † |
| y | 0.998 | 0.000 ‡ |
| z | 0.968 | 0.000 ‡ |
| #26 | ||
| x | 0.931 | 0.002 † |
| y | 0.997 | 0.000 ‡ |
| z | 0.991 | 0.000 ‡ |
| #27 | ||
| x | 0.987 | 0.000 ‡ |
| y | 0.995 | 0.000 ‡ |
| z | 0.998 | 0.000 ‡ |
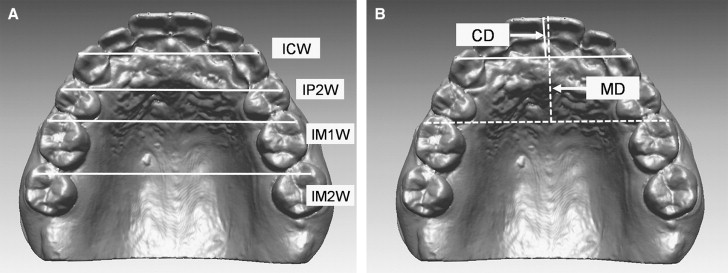
Because there was no significant difference in the individual tooth movements between the right and left sides between T0 and T1 ( P >0.05, Table II ), the data from the 2 sides were merged. Arch dimensions were measured with the 3Txer program. The definitions of arch width and depth are described in Figure 8 .
| Variable | T0 | T0 – T1 | ||||||||
|---|---|---|---|---|---|---|---|---|---|---|
| Right side | Left side | P value | Right side | Left side | P value | |||||
| Mean | SD | Mean | SD | Mean | SD | Mean | SD | |||
| Inclination (°) | ||||||||||
| U1 | 67.87 | 5.05 | 68.86 | 6.01 | 0.5471 | −11.68 | 5.17 | −12.83 | 4.93 | 0.4450 |
| U2 | 76.02 | 5.97 | 78.63 | 5.00 | 0.1157 | −6.42 | 5.66 | −5.22 | 5.99 | 0.4889 |
| U3 | 83.69 | 4.85 | 83.21 | 4.92 | 0.7373 | 2.17 | 5.97 | 1.91 | 6.62 | 0.8925 |
| U5 | 79.97 | 6.26 | 81.37 | 6.42 | 0.4564 | −0.57 | 6.17 | −0.17 | 5.50 | 0.8177 |
| U6 | 80.22 | 6.65 | 79.96 | 5.51 | 0.8851 | 2.05 | 5.04 | 1.22 | 4.88 | 0.5737 |
| U7 | 83.86 | 4.49 | 84.03 | 3.51 | 0.8837 | 2.56 | 3.76 | 2.47 | 4.03 | 0.9343 |
| Angulation (°) | ||||||||||
| U1 | 90.92 | 0.71 | 91.55 | 1.34 | 0.0533 | 0.00 | 1.03 | 0.33 | 2.01 | 0.4845 |
| U2 | 91.30 | 1.34 | 91.56 | 1.09 | 0.4703 | 0.16 | 1.56 | −0.43 | 1.63 | 0.2126 |
| U3 | 91.87 | 1.65 | 92.03 | 1.61 | 0.7382 | −0.50 | 1.77 | −0.55 | 1.93 | 0.9199 |
| U5 | 91.35 | 1.02 | 91.78 | 1.10 | 0.1769 | 0.00 | 1.02 | 0.21 | 1.84 | 0.6447 |
| U6 | 93.80 | 2.01 | 93.96 | 2.04 | 0.7859 | 0.22 | 2.10 | 0.11 | 1.91 | 0.8603 |
| U7 | 93.23 | 1.80 | 93.66 | 2.06 | 0.4505 | −1.43 | 2.50 | −1.52 | 2.97 | 0.9154 |
| Rotation (°) | ||||||||||
| U1 | 96.31 | 4.80 | 96.32 | 3.29 | 0.9929 | −5.45 | 5.62 | −4.65 | 2.86 | 0.5472 |
| U2 | 114.47 | 10.85 | 115.36 | 7.54 | 0.7482 | −6.96 | 10.95 | −6.49 | 5.57 | 0.8560 |
| U3 | 145.57 | 6.59 | 146.78 | 7.63 | 0.5674 | −0.53 | 6.56 | 0.12 | 7.46 | 0.7553 |
| U5 | 160.05 | 6.31 | 162.21 | 4.25 | 0.1812 | 5.21 | 5.73 | 6.14 | 4.36 | 0.5406 |
| U6 | 169.62 | 2.71 | 168.42 | 3.84 | 0.2282 | 4.36 | 2.95 | 3.75 | 3.01 | 0.4947 |
| U7 | 173.08 | 4.00 | 171.86 | 3.69 | 0.2906 | 4.41 | 2.48 | 3.50 | 2.53 | 0.2254 |
| Vertical displacement (mm) | ||||||||||
| U1 | 31.31 | 5.30 | 31.43 | 5.08 | 0.9383 | −2.93 | 1.68 | −2.94 | 1.57 | 0.9785 |
| U2 | 30.39 | 5.16 | 30.27 | 4.94 | 0.9361 | −2.28 | 1.64 | −2.25 | 1.48 | 0.9491 |
| U3 | 29.24 | 5.00 | 29.42 | 4.62 | 0.9026 | −1.72 | 1.50 | −1.71 | 1.48 | 0.9843 |
| U5 | 27.45 | 4.90 | 27.22 | 4.48 | 0.8657 | 0.75 | 0.91 | 1.12 | 1.22 | 0.2595 |
| U6 | 26.02 | 5.05 | 25.48 | 5.01 | 0.7135 | 0.15 | 0.81 | 0.19 | 1.11 | 0.8757 |
| U7 | 25.23 | 5.77 | 24.78 | 5.90 | 0.7950 | −0.43 | 0.83 | −0.38 | 1.17 | 0.8509 |
| Anteroposterior displacement (mm) |
||||||||||
| U1 | 40.96 | 4.13 | 42.57 | 3.61 | 0.1673 | 5.48 | 1.23 | 5.35 | 1.12 | 0.7174 |
| U2 | 37.80 | 3.40 | 38.47 | 3.08 | 0.4865 | 5.33 | 1.39 | 5.04 | 1.45 | 0.4828 |
| U3 | 33.18 | 2.59 | 33.16 | 2.41 | 0.9762 | 5.64 | 1.06 | 5.40 | 1.42 | 0.5323 |
| U5 | 19.09 | 1.53 | 18.90 | 1.23 | 0.6439 | −1.10 | 0.94 | −1.59 | 1.23 | 0.1367 |
| U6 | 10.12 | 0.91 | 10.29 | 1.08 | 0.5656 | −1.16 | 0.92 | −1.52 | 1.85 | 0.4066 |
| U7 | 0.00 | 0.00 | 0.00 | 0.00 | NA | −1.04 | 0.97 | −1.26 | 0.89 | 0.4366 |
| Lateral displacement (mm) | ||||||||||
| U1 | 3.37 | 1.40 | 2.97 | 1.59 | 0.3663 | −0.76 | 0.84 | −0.55 | 0.39 | 0.2913 |
| U2 | 11.00 | 2.11 | 9.99 | 2.71 | 0.1634 | −1.75 | 1.18 | −1.57 | 1.04 | 0.5780 |
| U3 | 17.80 | 2.11 | 16.69 | 3.11 | 0.1611 | −2.90 | 1.38 | −2.25 | 1.22 | 0.0967 |
| U5 | 23.33 | 2.34 | 22.65 | 2.75 | 0.3725 | 1.40 | 2.02 | 1.34 | 0.86 | 0.8874 |
| U6 | 26.06 | 2.07 | 26.01 | 2.36 | 0.9390 | 1.14 | 0.97 | 1.49 | 1.11 | 0.2727 |
| U7 | 29.30 | 1.85 | 29.19 | 2.54 | 0.8740 | 1.16 | 1.14 | 1.28 | 1.18 | 0.7241 |
To compare the amounts of change in each tooth between T0 and T1, the movement patterns in the adjacent teeth (U1 vs U2, U3 vs U5, and U6 vs U7) and the arch dimensions, the Wilcoxon signed rank and Mann-Whitney tests were used.
Results
We compared the changes in each tooth between T0 and T1. U1 and U2 showed a similar tendency of change as follows: significantly inclined lingually (12.3°, P <0.001; 5.8°, P <0.001, Table III ), rotated distally (5.1°, P <0.001; 6.7°, P <0.001, Table III ), extruded (2.9 mm, P <0.001; 2.3 mm, P <0.001, Table IV ), moved backward (5.4 mm, P <0.001; 5.2 mm, P <0.001, Table IV ), and moved laterally (0.7 mm, P <0.001; 1.7 mm, P <0.001, Table IV ). There was no significant change in angulation of U1 and U2 ( Table III ).
| Angular variable (°) | T0 | T1 | P value | T0 – T1 | Power (1-β) |
|||
|---|---|---|---|---|---|---|---|---|
| Mean | SD | Mean | SD | Mean | SD | |||
| Inclination | ||||||||
| U1 | 68.37 | 5.51 | 80.63 | 5.39 | 0.0000 ‡ | −12.26 | 5.03 | 0.999 |
| U2 | 77.33 | 5.61 | 83.15 | 4.16 | 0.0000 ‡ | −5.82 | 5.79 | 0.999 |
| U3 | 83.45 | 4.84 | 81.41 | 4.81 | 0.0160 ∗ | 2.04 | 6.23 | 0.683 |
| U5 | 80.67 | 6.31 | 81.04 | 6.29 | 0.8698 | −0.37 | 5.78 | 0.136 |
| U6 | 80.09 | 6.04 | 78.46 | 6.34 | 0.0706 | 1.63 | 4.93 | 0.412 |
| U7 | 83.94 | 3.98 | 81.43 | 4.33 | 0.0002 ‡ | 2.51 | 3.85 | 0.844 |
| Angulation | ||||||||
| U1 | 91.24 | 1.11 | 91.07 | 1.13 | 0.3488 | 0.17 | 1.59 | 0.048 |
| U2 | 91.43 | 1.21 | 91.56 | 1.27 | 0.6780 | −0.13 | 1.61 | 0.072 |
| U3 | 91.95 | 1.61 | 92.47 | 1.34 | 0.0595 | −0.52 | 1.83 | 0.282 |
| U5 | 91.57 | 1.07 | 91.46 | 1.22 | 0.7764 | 0.10 | 1.47 | 0.049 |
| U6 | 93.88 | 2.01 | 93.72 | 1.89 | 0.6038 | 0.17 | 1.99 | 0.059 |
| U7 | 93.45 | 1.93 | 94.92 | 2.92 | 0.0010 † | −1.47 | 2.71 | 0.048 |
| Rotation | ||||||||
| U1 | 96.32 | 4.07 | 101.37 | 3.68 | 0.0000 ‡ | −5.05 | 4.43 | 0.998 |
| U2 | 114.92 | 9.25 | 121.65 | 4.31 | 0.0000 ‡ | −6.73 | 8.59 | 0.801 |
| U3 | 146.17 | 7.08 | 146.38 | 9.16 | 0.8058 | −0.21 | 6.96 | 0.07 |
| U5 | 161.13 | 5.43 | 155.46 | 6.06 | 0.0000 ‡ | 5.67 | 5.06 | 0.993 |
| U6 | 169.02 | 3.34 | 164.97 | 3.85 | 0.0000 ‡ | 4.05 | 2.97 | 0.12 |
| U7 | 172.47 | 3.85 | 168.51 | 4.06 | 0.0000 ‡ | 3.96 | 2.52 | 0.292 |
Stay updated, free dental videos. Join our Telegram channel
VIDEdental - Online dental courses


