Introduction
Esthetic analysis of dynamic functions such as spontaneous smiling is feasible by using digital videography and computer measurement for lip line height and tooth display. Because quantitative measurements are time-consuming, digital videography and semiquantitative (visual) estimation according to a standard categorization are more practical for regular diagnostics. Our objective in this study was to compare 2 semiquantitative methods with quantitative measurements for reliability and agreement.
Methods
The faces of 122 male participants were individually registered by using digital videography. Spontaneous and posed smiles were captured. On the records, maxillary lip line heights and tooth display were digitally measured on each tooth and also visually estimated according to 3-grade and 4-grade scales. Two raters were involved. An error analysis was performed. Reliability was established with kappa statistics.
Results
Interexaminer and intraexaminer reliability values were high, with median kappa values from 0.79 to 0.88. Agreement of the 3-grade scale estimation with quantitative measurement showed higher median kappa values (0.76) than the 4-grade scale estimation (0.66). Differentiating high and gummy smile lines (4-grade scale) resulted in greater inaccuracies. The estimation of a high, average, or low smile line for each tooth showed high reliability close to quantitative measurements.
Conclusions
Smile line analysis can be performed reliably with a 3-grade scale (visual) semiquantitative estimation. For a more comprehensive diagnosis, additional measuring is proposed, especially in patients with disproportional gingival display.
Orofacial esthetics refers to dynamic facial expressions, such as smiling and speaking. The movements of the lips are the controlling factor for tooth and gingival display. According to the principles of visual perception, a harmonic and symmetric composition of teeth, visible gingiva, buccal corridors, and lips is a requirement for an esthetic and pleasing smile. This “smile composition” is framed by the lips; in this way, the arrangement of the teeth and the visible gingiva is dictated by the outline of the lips and the height of the smile line. The outline of the lips affects visual constructs such as the buccal corridors and the smile arc.
A smile line that displays the entire length of the teeth and some gingival tissue is associated with youth. In contrast, a smile line with only a portion of the teeth results in a less youthful smile. Moreover, it was found recently that size and visibility of teeth, and upper lip position were critical factors in the self-perception of smile attractiveness. Participants, smiling with their teeth entirely displayed including some gingival display, perceived their smile line as the most esthetic. Therefore, from a dental esthetic and patient point of view, the height and course of the smile line are important aspects of orthodontic diagnosis, treatment planning, and adequate long-term results.
Static analysis of the smile with the photographic methods available in the past inevitably led to a posed smile as the starting point for an orthodontic diagnosis, since this was supposed to be the most reproducible smile. This is, however, contrary to normal life, where smiles are not displayed in static but in dynamic situations. This drawback of photography has been overcome by contemporary videographic and computer technologies. Analysis of orofacial esthetics during spontaneous smiling and speaking is now feasible because the optimal record can be selected from a video registration. The use of digital videography to capture an authentic spontaneous smile combined with digital measurements has been tested lately, and it appeared to be reliable, reproducible, and valid for use in clinical practice. Moreover, it was found that a posed smile showed reduced smile line heights, tooth display, and smile width, compared with a spontaneous smile. Spontaneous smiling records were therefore recommended for diagnostic purposes.
In spite of the digitized methods, performing smile line measurements is, however, relatively time-consuming and therefore less feasible for regular diagnostic use in clinical practice. Next to the quantitative measurements, a qualitative and a semiquantitative approach to determine the height of the smile line are proposed in the dental literature. In the qualitative approach, the clinician observes the smile line and makes a judgment about its height. A disadvantage of the qualitative analysis is that it lacks standardization and objective criteria. With a semiquantitative approach, the lip line height and tooth display are visually and rationally estimated with a scale. Lip line height and tooth display can, for instance, be classified as a high, average, or low smile line. The semiquantitative approach is a more formal and more objective method than the qualitative approach, and still it has the advantage that it is easy and quick to use. With the focus on daily patient care, the combination of digital videography and visual estimation of lip line height and tooth display on the images could be an efficient way of dynamic soft-tissue analysis.
Since semiquantitative estimations of lip line heights and tooth display are easier to perform and efficient, and do not require dedicated computer software, the question is whether this approach is justified for use in clinical practice. Therefore, the objectives of this study were to test the reliability and validity of semiquantitative estimation of the smile line and to make a comparison with quantitative measurements.
Material and methods
Of 1069 military men on an air force base, 122 were randomly selected from 3 age cohorts (20-25, 35-40, and 50-55 years). Inclusion criteria were full maxillary and mandibular dental arches up to and including the first molars and white ethnicity. The research proposal was approved by the ethical committee of the Academic Centre of Dentistry Amsterdam, The Netherlands. Informed consent was obtained from the participants according to the guidelines of that institution.
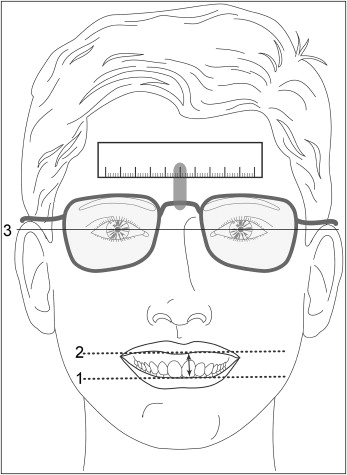
Of each participant, a video recording was made of a spontaneous smile of joy, a posed social smile, and full dentition with the aid of cheek retractors. The full dentition was measured to obtain the actual lengths of the tooth crowns. The video recordings were made in a setup consisting of a chair with a digital video camera (XM 1 [3 CCD], Canon, Tokyo, Japan), a television set, and 2 spotlights mounted in front of the chair. The television screen was placed at eye level. When the visual axis was horizontal, the subjects kept their heads mainly in a natural head position. The video camera was adjusted to the subject’s mouth level and continuously registered the face. To prompt spontaneous smiling, the subjects watched television fragments of practical jokes, which had been assessed by a panel as the funniest from a film of 50 practical jokes. The subjects were unaware of the exact aim of the study. While watching television, the subjects wore glasses with a clipped-on reference standard to enable calibration in a digital measurement program. In this way, a maximum spontaneous smile was recorded with minimal intrusion of the subject. After the video registration, the digital recordings were transferred to a computer. Then, the dynamics of smiling could be observed image by image. The video images of smiling with maximum visibility of teeth and gingivae, referred to as the records, were selected.
The records of spontaneous and posed smiles were measured with the help of the Digora program for dental radiography (Orion Corporation Soredex, Helsinki, Finland). For each record, the measurement program was recalibrated with the filmed reference standard.
Tooth length was measured on the full dentition record to obtain the clinical crown length. Teeth and gingival display were measured on the spontaneous and posed smiling records. In the maxilla, a central incisor, a lateral incisor, a canine, a first premolar, a second premolar, and a first molar were measured on the right and left sides alternately to exclude possible interferences of asymmetries. The most incisal point of each tooth and the lip edge were marked with a digital horizontal line, parallel to the interpupil line ( Fig 1 ). The vertical distance between these lines was measured ( Fig 1 ). Tooth display during smiling was calculated as a percentage of the clinical crown length as measured on the full dentition record. In case of a high lip line, gingival display above the cervical margin was expressed in millimeters. Sometimes, the upper and lower lips covered both the gingival margin and the incisal point. In that case, lip line height was denoted as not measurable. If a tooth was not visible, lip line height was coded as missing.
An extensive reliability study and a more detailed description were reported earlier ( Table I ). The reliability was expressed by means of the generalizability coefficient, which is comparable with the intraclass correlation. The generalizability coefficient allows a reliability estimate when several sources of error are present: in this case, teeth and ratings. The data obtained with the digital videographic measurement method were used in this study as the gold standard.
| Maxilla | |||
|---|---|---|---|
| Anterior teeth GC, SEM |
Premolars GC, SEM |
First molar GC, SEM |
|
| Interexaminer agreement | 0.98, 0.4 | 0.98, 0.5 | 0.91, 1.1 |
| Intraexaminer agreement | 0.99, 0.3 | 1.0, 0.2 | 0.99, 0.3 |
For the semiquantitative estimation, the lip line heights on the spontaneous and posed smiling records were visually classified according to a scale. Two classification concepts were used: a 3-grade scale, which has been used before, and a 4-grade scale.
According to the 3-grade scale, a lip line height that showed less than 75% of the tooth was visually classified as a low smile line. A lip line height that showed 75% to 100% of the tooth and less than 1 mm of gingival display was visually classified as an average smile line. A lip line height that showed the total cervico-incisal length of a tooth and a continuous band of gingiva (minimum, 1 mm) was visually classified as a high smile line.
In the 4-grade scale, a gummy smile line was added as the fourth category. Based on the results of perception studies in which smile line heights displaying more than 4 mm of gingiva were perceived as less attractive, a lip line height that showed more than 4 mm of gingiva was classified as a gummy smile line ( Fig 2 ). The other 3 categories were identical to the categories of the 3-grade scale.

To determine the intraexaminer reliability for the 3-grade and 4-grade scales’ semiquantitative estimations, all records were assessed twice by an examiner (P.G.) with a time interval of 2 weeks. To determine the interexaminer reliability, all records were assessed by a second examiner.
Statistical analysis
The measured tooth display and lip line heights were recoded into the above-described ordinal values of the semiquantitative estimation: low, average, high, and gummy smile line categories. Cohen kappa statistics were used to establish both interexaminer and intraexaminer reliability values and the accuracy of the semiquantitative estimation of smile line height in relation to the quantitative measurements. All of these analyses were performed for each tooth. According to the conventions, kappa statistics of 0.40, 0.60, and 0.80 were considered moderate, substantial, and almost perfect, respectively.
An error analysis was performed for further investigation of sources, which might lead to differences (errors) between semiquantitative estimations and quantitative measurements. The errors were correlated with the actual tooth length and the smile line height relative to the gingival margin. The significance level of P <0.05 was chosen. This meant that, with a sample size of 122, correlations of .25 can be detected with a power of .80.
Results
Table II shows the interexaminer and intraexaminer agreement values for the 2 concepts of semiquantitative estimation for both spontaneous and posed smiles. No substantial differences were noted between the values of interexaminer and intraexaminer reliability. The median values of the 3-grade scale estimation were considered almost perfect. For the 4-grade scale estimation, in which the gummy smile line was included, the kappa values were slightly lower and were considered substantial to almost perfect.
| Central incisor K, % | Lateral incisor K, % | Canine K, % |
First premolar K, % | Second premolar K, % | First molar K, % | Median K, % |
|
|---|---|---|---|---|---|---|---|
| Interexaminer agreement | |||||||
| Spontaneous smiling | |||||||
| 3-grade scale estimation | 0.89, 94 | 0.84, 91 | 0.85, 91 | 0.88, 95 | 0.75, 92 | 0.93, 97 | 0.87, 93 |
| 4-grade scale estimation | 0.83, 91 | 0.81, 88 | 0.83, 89 | 0.79, 86 | 0.73, 83 | 0.77, 84 | 0.81, 87 |
| Posed smiling | |||||||
| 3-grade scale estimation | 0.88, 93 | 0.85, 91 | 0.74, 84 | 0.89, 95 | 0.88, 95 | 0.90, 95 | 0.88, 94 |
| 4-grade scale estimation | 0.87, 92 | 0.83, 90 | 0.70, 81 | 0.78, 85 | 0.80, 86 | 0.89, 93 | 0.82, 88 |
| Intraexaminer agreement | |||||||
| Spontaneous smiling | |||||||
| 3-grade scale estimation | 0.95, 94 | 0.77, 87 | 0.86, 92 | 0.84, 93 | 0.73, 91 | 0.91, 96 | 0.85, 93 |
| 4-grade scale estimation | 0.92, 96 | 0.73, 82 | 0.82, 88 | 0.76, 84 | 0.75, 84 | 0.81, 87 | 0.79, 86 |
| Posed smiling | |||||||
| 3-grade scale estimation | 0.86, 92 | 0.87, 92 | 0.79, 87 | 0.84, 91 | 0.92, 96 | 0.82, 90 | 0.85, 92 |
| 4-grade scale estimation | 0.85, 91 | 0.86, 91 | 0.73, 82 | 0.73, 81 | 0.89, 92 | 0.72, 79 | 0.79, 87 |
Stay updated, free dental videos. Join our Telegram channel
VIDEdental - Online dental courses


